This content was created by Adam Bensman. This content was uploaded by Adam Bensman. This is a YouTube video titled "Interactive Hail Maps - Helping Roofers Mobilize After a Storm" created on August 18, 2015. It features Adam Bensman, known as the Roof Strategist, discussing the use of interactive hail maps and the HailRecon app to help roofing companies efficiently target areas affected by hailstorms for business opportunities. The video provides a detailed demonstration of the app's features and strategies for maximizing sales and marketing efforts in the roofing industry.
Chapters
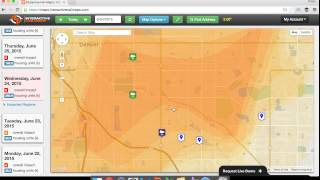
Adam Bensman, the roof strategist and I help roofing companies take the market by storm to maximize hailstorm opportunity with business and sales strategy to take their business to new heights. So we're going to demo interactive hail maps today. I know there's a lot of options out there when it comes to hail alerts, weather alerts and hail maps. I'm very, very partial to interactive hail maps. I think their technology and their user interface, specifically their mobile app called hailrecon, which is available for Android, iPhone and iPad and it works with your GPS to give you a tremendously huge competitive edge in the field. So whether I have a state account or national account, I'm going to get hail alerts around. So let's take a look. The storm that hit southern Nebraska here and if you take a look up in the upper right, right here where there's nothing, it's going to tell me the size of hail that fell. So 3 inches here and 2 inches here. This is very good data, very good information. So I go ahead and I click this area near Steel City, it's going to highlight the zip code and give me some very valuable data. Average households per square mile is three means it's super rural. Got 19,000 home average income and the household value is very, very small, 14,600 bucks. Now right off the bat I know, hey, great storm. Not the right opportunity for me to really have a great season with only three homes per square mile. Not tremendously huge homes. So on this left hand side you can see all my hail dates here. If I cycle up to June 24th, we're going to take a look at a small date here in Denver. So let me zoom out and pop into Denver. So let's say I'm a Denver area roofer and I take a look. This is a big swath. I mean I'm talking a pretty decent amount of time to actually get in and scout these neighborhoods. So before I get in my truck and hit, hit the road trying to get some, some recon done, I want to find out where do I want to start, how do I want to begin my targeting efforts. So if I click up here in the northern part of the swath, Commerce City, again you can see in the upper right, I'm looking at inch and a half, inch and three quarters hail. My average, excuse me, medium age is younger, 26.9, 27 years old. Average income is only 30,000. Home value 96,000. So again you can see this is half, it's kind of on the fringe half in the storm half, not an average household per square mile is 295. It's relatively suburban area, but not super, super populated. But maybe I want to check out Aurora and I click over here and I'm got 32,000 in income, 117 in household value. But my average household per square mile goes up tremendously. 2,300. Right. This is a good populated area. Might be a good place to put some, some effort. If I take a look here in the kind of near Glendale, we're going up a bit and our household value is 226. Income 33,000 and our household average household per square mile is 4,000. So this is good news. So maybe bigger homes. Some combo deals I want to focus on on this area. And just for kicks, we're going to take a look at this zip code. So you notice here we're kind of half in the swath, half out of the swath. So maybe I'm looking at areas down here. We see our average income and household value, densely populated area. Do I want to look there or do I not? So I click on show impact dates. Okay. And this report is going to run for me and what it's going to do is it's going to say, hey, this area has been hit over the last four years at location, meaning where I click within 1 mile, 3 mile and 10 miles. So 624, this is the date that we're looking at that got hit. Inch and a half, two and a quarter, not too far away, but down here, just a mile away, even a few weeks back, got an inch. So maybe there's not fresh damage. Fresh damage. But I've got opportunities to work old damage again. I have an old date to work and sometimes it can be very beneficial to open up that honey hole in an area that's on the fringe and not as much competition. Again, I got those dates. So as I hit the streets, I know where to target my efforts. So let's talk hailrecon, the interactive map. The iPad, iPhone, Android say I'm scouting. Okay, We've all used Google Earth or some sort of GPS on our phone. We know there's a little blue dot that keeps track of where you are and it lets you know where you're at in terms of the map. And I remember before I had this, I'd have to have, you know, my static map up and my GPS and I'd try to look at the roads and map it up. Well, now it all does it on one and the interface is fantastic. So let's say I'm scouting. I'm in the Glendale area and I'm right here. I say, hey, I want to tag this area. So, so I click and see how it drops. It clicks right where I click and click. Add address marker. So if it's a customer mine, I can make notes. It's going to give me the street address, the city, state, zip, all that stuff and I can change my data here. The little pin that drops. Let's change this little red one Hail size, you know, whether or not you want to include that is fine, but I like to take notes. So lots of three tab and older homes more prone to damage. I'm going to add the address marker here. It drops the pin. This is going to share it with my other users depending on how we set it up, whether they're a sales guy or a main account holder. But now I've got some data. Look at this. So comments. Lots of three tab and older homes. Now maybe we find an area we can drop a pin, don't work it right. Maybe it's a homeowners association that is really tough to break into or, or maybe a certain area that you're not going to thrive in. You can make notes. I focus on dropping my pins on where I really want to target my efforts. So I do my recon and my scouting and then I'm able to deploy my team and my assets, my sales or my canvassers to those specific areas where those pins are dropped. Remember, I want to work a neighborhood and not a city. If I can target my efforts and blow up and do 2, 3, 400 homes in a small area, my time is better spent. I build a market presence and I build a pipeline. So using interactive hail Maps and hailrecon, we've helped tons of clients really mobilize on their storms. But most importantly is save time. And time is paramount. When you're scouting a storm. You got to respond quickly and you got to target those efforts. If I've only got a sales team of 10, I can't cover this whole area. I got to carve out my slice of the pieces. I want to know where to work and I got to respond quick because that low hanging fruit goes fast. So with interactive hail maps again you get hailrecon, which is their mobile platform. It's fantastic. I believe in what these guys are doing. They do a fantastic job. So if you have any questions, shoot them in an email over at Interactive Hail Maps. If there's anything I can do for you. The Roof Strategist check us out online. TheRoofStrategist.com help you with business sales and marketing strategies to help take your roofing and storm restoration business to new heights. That's all we got for you in today's video. Hope this was a big help. Make sure to utilize that technology. Respond on those storms quick. Make a big, big impact for the rest of your season. Thanks again. We'll see you guys around.