Andrea Bronzini: Why Your A/B Test Winners Are Noise And What That Costs | SaaS District
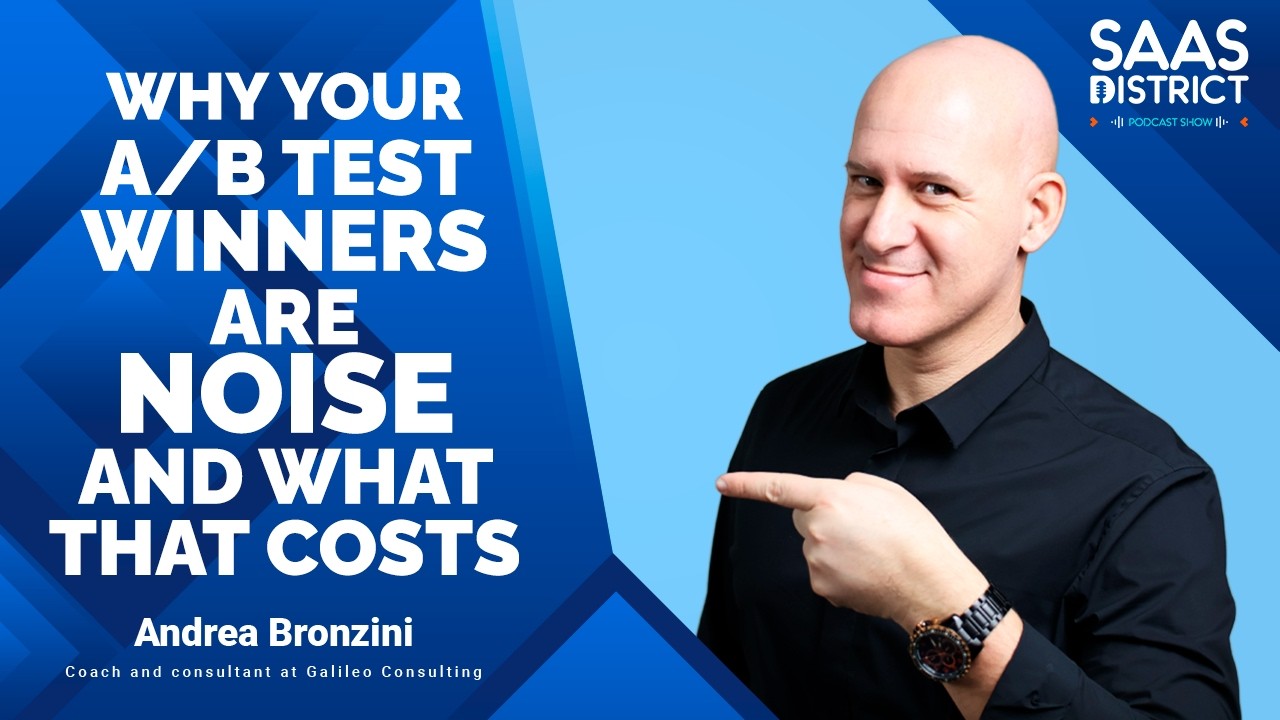
Andrea Bronzini explains why most A/B test winners are statistical noise, not real wins. His Noise Explorer tool shows how the same experiment produces wildly different results across runs. Companies waste resources chasing phantom lifts and should run tests longer or multiple times before acting on results.
Chapters
Hello, hello everyone. This is your host, Akhil Jabbar, and welcome back to another episode of SaaS District. In today's episode, we'll be talking about why your A/B test winners are noise and what the actual hidden costs are behind that. Today we have our guest Andrea Bronzini joining us. Andrea is an engineer a strategist and a system thinker with over 20 years of experience designing and building complex systems across industries. Currently, he helps organizations evaluate, acquire, and implement technologies by combining technical insight with commercial and strategic analysis. Now, he was frustrated by recurring structural issues, and he developed a systems-driven approach to diagnose and solve them faster, which led to the creation of his company called Zero Bottlenecks. And now he focuses on his current company, which is Confident Story, which we'll talk about today. He's known for turning complex, complex ideas into clear, actionable frameworks. So welcome, Andrea. Super excited to have you on the show today. Hi.
Nice to be here.
Yeah, yeah. Excited to go through. I mean, lots of interesting stuff to go over today. We'll focus on some of the stuff we're talking about, which is A/B testing. You know, you build systems across industries, have been working at Zero Bottlenecks. That's, you know, you're the company or one of your companies that you manage. Maybe before we get into some of the A/B testing, could you share a little bit about yourself? And then, you know, what are some of the bottlenecks that companies are Typically coming to you and say, hey, like, help me out, Andrea. How can you solve this?
Yeah, so my name is Andrea and I've been working helping online companies to grow for about 20 years now. Along the way, I noticed that my clients tend to have always the same kind of issues. So I started to think there must be a way to kind of analyze what are the problems, what are the bottlenecks and have a framework to make some diagnostic. And that's how Zero Bottlenecks was born. Now, another issue that was coming up very often was that people were running, like companies were running A/B tests, and they had problems because they were like finding winners. So they see in this experiment increase in lift in conversion rate, but then they roll out the experiment and they deploy the variation, and this So I think many of the listeners may have experienced this problem themselves. Also, another manifestation of the same problem is that if you run an experiment today and you run the very same experiment in 2 months' time, like you run it again, you're going to measure completely different numbers. And usually people think, oh, the conditions have changed, you know, like traffic, maybe intent, maybe some, you know, some other thing. Some competitors have done something, so your conversion rates are affected. But actually, you don't need to go that far. I mean, you don't need all these excuses. Noise can explain all this change. And so during my research about bottlenecks, about A/B testing, and I do a lot of simulation. So I built a set of tools that are, they're built to understand noise. Now, the problem with noise is that we know that there is noise, right? And you know that if you measure something, it's not 100% correct.
Yeah.
But this particular thing that we are trying to measure, and I'm talking about conversion rates or lift, which is a combination of 2 conversion rates, A and B, right? So these things are called stochastic processes. They're random. They're not like a thing you can measure with a ruler. If you measure a table, for example, you take the measurement 3 times and 3 times more or less you're going to get the same measure, right? And this is the disconnect with our intuition that we live in a world that is physical and we can measure things. But when it comes to conversion rates, it doesn't work like that. And The noisiness, it's much larger than what we feel, what we can imagine. So that's why these tools I built are so powerful because you can see the noise. And then once you see it, you cannot unsee it. You're gonna be more careful.
As we're blinded to our own experiments, right? We just focus on the results and what we're doing, but we don't understand actually like, hey, there's all these other factors playing a role.
Because you don't have this visceral sensation of how large noise can be.
That's a good point.
And the consequence, I'm not going to show you the tool and I'm going to guide the listeners through the experience here. I want you to experience noise. But the consequence is that if you measure a lift, say 8%, so we run an A/B test and we find a winner and this winner seems to have 8% lift, that 8% is not 8%. That's the entire point of the story here.
Yeah.
Most likely it is overestimated and it can be overestimated by a lot. Like it could be 2%, not 8%. And this leads teams and companies to kind of plan on a lift that doesn't really exist, at least in that magnitude. And also you have seen like case studies, like we increased the conversion rate 12%. No, you didn't. These numbers, again, there may be lift, but it's very hard to quantify how much it is. So we have to be careful because the entire strategy of the company can be blinded by this wrong lift. I mean, the company can make wrong decisions if they are blinded by the lifts.
Absolutely. And just to be clear, you know, people listening in, For people over here, we're talking about A/B testing landing pages, websites. So you're testing out, you know, copy, design, images, I guess, just to be clear, right? That's what we're talking about here inside your app. Most people are converting, you know, testing for lift in terms of conversion, usually, I think in this case, right, some kind of conversion metric. So, you know, before we get into some of the sharing the screen and more about into the A/B testing, can we talk a little bit about kind of your background, you know, mixed engineering, strategy, system design? Can you share a little bit how you, how you think about shape, shape the way You look at business decisions and then also building out KPIs for teams, which is first, you know, very important as well. Yeah, true.
So essentially, I'm an engineer, but I've worked in every field of engineering and then somehow I ended up in sales. And so I've seen the entire thing, the entire marketing funnel, been on the marketing side, on the sales side. And I believe business is a process. is essentially a process. And there are inputs and there are outputs. So that's how I see a business. And for me, the way I've been helping companies is to look at the numbers and understand how these numbers are coming to be. So where people come from, where do people go, what are they doing? This all results in numbers, right?
Mm-hmm.
And looking at these numbers, you can understand how the process behind the numbers is moving. And this is, again, the concept of bottlenecks. There are constraints in this process, and these people have to move, money has to move in a certain way. And by looking at how people are moving, how money is flowing, you can understand what is working and what is not.
Correct.
And this is a very engineering approach, if you want. We don't guess, we just look at the numbers and understand what's not working in the business.
And what kind of KPIs are you generally building out for teams? How do you suggest them to structure that?
Yeah, you have to, well, this is pretty simple. You have to map your funnel and by funnel, I don't like the word funnel because there is a lot of different concepts attached to it. So I call it conversion path. It's the conversion path. So people come from whatever traffic source you have, they land on a page, then they read the page, they click on a button, they go on another page. Maybe you have a product page, maybe you have a pricing page, and you need to map all these possible ways to get to the payment. All right?
Correct.
Then also after the payment, for example, you have lifetime value you want to track, you have activation of you have retention to track, right? So this is all part, it's not conversion anymore because the conversion happens with the payment, right? But still it's part of the journey of the user through the site and with the business, right?
Mm-hmm.
So as a company, you must have a very good idea of the process itself and the numbers that are associated with each stage of the process.
Right.
And I help companies do this, basically, to figure out how people move and where are the places where the company should focus attention. Because one of the problems is that companies are doing a lot of activities, but some activities move the needle while other activities are just a check. Yeah, I've done it, but it doesn't help.
Yeah, sometimes we think we're doing a lot, so we think we're moving things forward, but sometimes, like, okay, we need someone to say, hey, this is actually where you need to focus your weight. This is all noise, kind of what we're talking about here. What are some maybe common decision-making bottlenecks that you see inside companies today when they're coming? Like, at what point in the funnel or the journey or the conversion points or inside the business you say, like, these are generally the biggest bottlenecks? Like, hey, can you help me out here?
Okay, so this is not easy because it requires experience, expertise.
You need to know what you're doing.
But I would say, so, if you have to optimize the business, let's talk about this conversion path, which also ties to A/B testing. If you have to optimize the business, you want to first start bottom to top because you need to make sure you don't have anything broken.
All right.
Right. So, you start from the payment page and you come up and you make sure that everything is working. You don't have to A/B test, but you need to make sure that everything can work as it's supposed to work. Okay. So the first pass is bottom to top. Then you want to optimize top to bottom for 2 reasons. First, because you need to get more people in the top so that you get numbers in the bottom.
Correct.
If you have a very small number of people in the funnel, well, you don't have enough people to test. So you want to increase the number of people people as early as possible in the funnel. And the second reason, which is not often talked about, but it's very important, is that if you were to optimize the entire funnel bottom to top and then you change your ads, for example, you are putting new different people inside the funnel. So all the optimization you had done before, it's not good anymore.
Right.
So that's why it's important that you figure out the ads or the, let's say, the acquisition strategy first.
Lead generation, yeah.
Yeah, lead generation, traffic generation, that has to be figured out first because that determines the type of people you get in the funnel. And also it drives your messaging. Like if you are trying to acquire particular ICP, And you start ideal client profile. If you start to get these people inside the funnel, then you want to talk about things on the funnel. You want to frame your product in a way that these people respond to. If I were to optimize bottom to top, well, when I arrive to the top and I want to raise the traffic, maybe I need to adjust the messaging, right? And then I'm going to undo everything that Right. So that is the important approach. Then in terms of bottlenecks, well, that's very specific to the company, but you have many activities like marketing. Maybe you're writing blog posts, maybe you're doing podcasts. So you need to track the numbers and see what is that is not generating the return that you would expect. That it's appropriate for the amount of effort you are spending. And so looking at these numbers at some point, again, the activities are many, many, many. I have a model, it's like 85 bottlenecks. So one of them is the bottleneck. You can have only one bottleneck at a time, but there are many different possibilities.
Love it. So let's, Andrea, let's get into maybe talking about the A/B test winners. You know, we've been talking about this now kind of more practically. Let's get into the practice of it. So people who are listening in, if you want to follow along, maybe watch the video. If not, if you, you know, Andrea will share through it as well. But if you want to share your screen, Andrei, you know, so we're saying, you know, many A/B test winners are actually noise. Let's see what that actually looks like so people can understand what the noise actually means.
Yeah. Okay. Can you see my screen?
Not yet. Still loading, I believe. Yeah, now we can see it.
Okay, so you're looking here at a tool that I called Noise Explorer, and the job of this tool is to make you understand the noise and how much of it we have when we make experiments. Again, it's not only about experiments, it's also about the conversion rate. So if you use KPIs, and every business does, Your KPIs have this problem. And the problem is noise. Actually, noise is not the problem. Noise is something that helps us. The problem is mistaking noise for certainty. All right. So I'm going to show you here one thing. We have on the chart, for the listeners who are not seeing this image, I will explain. We have a chart with measured lift. This green dot here is lift. And the value of this lift is 8. 8.33% in this example, right? So now I'm going to push this button here, Run Observation, and this will generate an alternative measurement of this very lift. Same value, 8.33%, but it's a different version of what we could have measured.
All right.
So here we have this lift is 28 days of data. We have 12,000 users on the A variation, 12,000 users on the B variation, so same number. And in conversions, we have 480 conversions on A and 520 on B. All right, so B looks better than A at this point.
So just to clear, you know, people are— this is 50/50 traffic, 50% going to A, 50% going to B, and we're running an experiment for 28 days and then we're measuring the conversion.
Yes, and we got 8.33. Now, if I run another experiment, let's say, yeah, so this is what I could have observed, right? Now, in this particular case, we passed very close to what we actually have observed, you see? But if I do it again, look at this.
Hmm. You see?
This is the same underlying lift. It's 8.33. But what comes out in terms of measurement is completely different. Now, if you are not seeing the chart, this run at 28 days is going through -0.8, and the one we observed is 8.3. So there is a difference of 8%.
Mm-hmm.
And if we do it again, Yeah, check this out. This one here is 15%. You see? Now you see that between the top measurement that we had, which is 15, and the bottom is basically -1, there is 16% difference. And that is the range of measurements we could have gotten out of our experiment. And if I keep doing this, it gets noisy, you see? Mm-hmm. And it gets a particular shape. It looks like a trumpet. You see, like the beginning is very wide and then suddenly it shrinks. There is kind of a sort of knee here. And then it goes converging, but not how people think. This thing does not converge to 8.3%. It converges to a very wide interval, which is like in this example is 16%. Top. And in the bottom here, we have +1. So you still have 15% range for your lift. You don't know what is exactly. You see? So this is the— this is to make you grasp the uncertainty of lift, like the magnitude of lift. We see that at some point here, it's above the red line. Red line is 0. So it becomes positive, but we still don't know how much this lift is. And another thing we can see from this chart is that here in this area at the very right end of the chart, we have 12 weeks. All right. But almost nobody runs experiments for 12 weeks.
Right.
Yeah, it's a year. If you run an experiment for 4, you are about here. And here the uncertainty is even larger. So you are measuring, like if you measure here -6%, you would throw this away and say, okay, this is not a good variation, let's move on. But you see that it's the same variation. It was 8%, now it's -6%. So this is not to say that experimentation doesn't work. It's to say that you have to take the results with extreme caution because what you're measuring It's not certainty. It's one draw from a random pool.
It's a sample, just a small sample.
Yes. This draw is very, very, very noisy. Now, I would— you have questions?
Yeah, I guess so. If I look at this, how do I interpret this and say, okay, what is the noise here? And does this mean that I should run the experiment for longer or I should run it several times? Or what's kind of the interpretation of it?
They're the same, like longer several times, it collapsed to the same thing. It's just the message here is that the real result is driven by noise. I will show you in another way. So this one here, the gray envelope here on the chart is the noise if the lift is zero. Okay. Suppose there is no difference. This is the noise you're going to see. All right. So for something to be statistically significant, it has to be outside this gray area. This is statistical significance made visual.
Okay.
So statistical significance made visual. And if I run an observation now, you see that this run started outside, then collapsed inside, and then it went outside.
Again.
So if I were to observe this, probably day 5 here was already, oh yeah, this is a winner. Then by day 24, I'm not so sure anymore.
You see?
And then it goes up and down. Let's run another one. This is never statistically significant. And yet it's the same underlying data. It's the same effect. In this case, the noise is like adversarial and it's pushing against the signal. So in a way, noise is helping the signal to surface. Think of it like a wave in the ocean. You're trying to measure a ripple, but there is a wave which is going up and down. And you can see the ripple only if the wave is going up.
Right.
The wave is going down, you miss the ripple entirely. And this is the same. So this is what we are doing when we are running an A/B test. And we need to get a little bit, this run as well, you see, it's completely in the gray. So again, we didn't measure anything here, it's not significant. And we need a little bit of luck, you see, now this is going out. And again, the simulator here shows you that Well, in this case, about maybe 50% of these runs are out and 50% are under the noise. So it's very hard for this particular one to call it. But that is what noise does. Now, moving on to KPIs. If we look at conversion rates, this is conversion rate. We have just 2 numbers. Same story, we can draw multiple runs and the observed value of conversion rate changes every time. Okay?
Right, right.
Now, here I have a little feature here. There is a link. If you click on this, you will open another tool checking this particular, this particular, let's do it like this. So now we are checking 2 KPIs.
All right.
And this thing tells me that there is a 90% probability that this is a true effect. Okay. The problem is that when you are looking at KPIs, for example, you want to see how many leads you are converting from visitors to leads. You have a certain baseline percentage, right? You have, I don't know, maybe it's 10%, right? And every week you have a line in your spreadsheet you are checking every week.
Correct.
What is it?
Right.
And let's say it's 10%. Then one week you measure 8% and the entire company immediately panics because they feel like something is broken or someone has done something, right? And you have to run this tool here to make sure that you are in, I mean, that this measurement is not noise. Because if I change this number here and I put, for example, 490, you see, this can look like a plus 2% improvement, but it is most likely noise. And on your spreadsheet, you would have measured 4 and 4.2. But actually there is no difference. This is just a wobble of the observation. What is the practical effect? Again, companies, they freak out when they see their numbers move. And this number can move a lot.
We like stability, right? I guess that's the point we're looking forward to finding.
We like stability because we think the table is always length as the table, right? But that's not true for KPIs. In my experience, companies take action. They start to change funnels. They start to change emails. At the moment they see something that goes a little bit on the bad side, you know. But my message here is that you really need to use a tool like this. And by the way, it's free. So just use it.
Cool.
To try to understand if you are reacting to noise. The flip side is that you run a campaign, this 4 turns into 4.2, and then you celebrate and you think you have a winner again. This is KPIs. There's no A/B testing, but you think, oh, we made a campaign, it was a great success. Well, probably it wasn't. Probably it was just a random variation which will come back to around 4 in the next weeks.
Right.
This ties back to bottlenecks. Bottlenecks, you have to choose the right focus for your company, the right thing to do. And if you're looking at these numbers, your KPIs, and you start to make fuzzy decisions and change the focus every week because you're basically chasing the noise, this is bad. It's like really, really bad. So this part of my work, understanding noise, is the reason is that if we understand noise, we avoid overreacting in positive and in negative. And we avoid to switch to activities that shouldn't be done, at least for the moment, right? Shouldn't try to fix your emails if this is just noise.
Exactly. So what is the real cost? You know, when people are making these decisions, they're looking at this data and they're saying, Maybe they're ignoring this noise and they're saying this is a false win, as we're saying. But what is this ripple effect in terms of making this decision and actual cost and business results?
Yeah, so one is strategy. Again, example of the emails, you may have a new sequence, then you just get a few noisy measurements and you think the sequence is bad. But if you know that this is within the range of the noise, then you understand that, okay, it's too early to worry about it. We shouldn't react. We should keep this email sequence running and maybe it will adjust. Maybe there is no difference. So this is kind of like being mindful about the numbers we see in our dashboards because the dashboards, they don't tell you. This is noise. They just give you a number and then it's your job to interpret the number. And this tool here, it's an aid to understand the numbers better and to avoid making rash decisions when we see some change that either we like or we don't like.
Yeah, I appreciate that. So, Andrei, I want to ask you one last question here before we kind of jump into the rapid-fire questions. It's like, okay, if a team wants to avoid this trap, right, they're running an experiment. What's one change that they should make to how they run the experiment or make this decision? Or in other words, what would make for a more clear and more powerful experiment? Do you check for noise beforehand? Or what part of the process is this noise check?
If you're talking about KPIs and you have like a weekly cadence of monitoring, every week I would run this tool. And understand, is this really something new that we didn't know? Like, is it truly higher or truly lower, or it's just a normal wobble? And if it's a wobble, you don't do nothing. You just go on with the business. You stick with your strategy. If it's something that is real, like a decrease or an increase, then you can shift the focus and allocate resources in a different way. And instead, about A/B testing, my recommendation is don't take the results as truth. It's never, it's never truth. So if it is statistically significant, it's probably good. Take it. But don't go say we had 12% lift. So we expect 12% lift in revenue. Because that's not going to happen. That's the wrong expectation. Right.
Awesome. Andrea, let's jump into the rapid-fire questions. So I would love to hear from you. What's one activity you enjoy outside of work that gets you into a flow state?
All right. So if we're talking about work, it's working. To get in the flow, I just start to work. Even if it's hard, maybe Maybe at the beginning I don't really feel like, but then it kind of starts to flow. That's how I get in flow for working. And otherwise, I just like to have walks outside and this gets me thinking. I kind of have my best thoughts when I'm outside walking.
Love it. What's one piece of advice you wish you had known and you would tell your younger self, Andreas, your 25-year-old?
Yeah, that is good. I would say validate. That's the only thing. Like too often we get ideas, we start to build products, we start to build companies even. And then it turns out that, well, this thing shouldn't have been built. So validate, I think it's validate more, like try to get people to tell you, yes, yes, I really want this product. Yes, this solution is really what I need.
And would you say, you know, when we talk about validate, most sense we're talking about people paying you, right? Or—
Yeah, people paying, or at least being willing to give you attention and try the things you want to build. And yeah, so I think that's very important.
Makes sense. Andrea, what are some of the biggest challenges you're currently facing in order to continue to grow your business? Meaning what keeps you up What keeps you up at night these days?
Distribution. That's a big problem, I think, for everyone, because with AI lowering the boundary for development, you can do everything like real quick. And this makes distribution more and more important because everybody can build, but then to bring the product in the hands of the customers, you need visibility. So distribution is going to be the next best thing. And it is a problem because you never have enough leads. You always need more leads. And so I'm trying to get better at that.
Marketing and sales. Yeah, absolutely. Andrea, who or what are some of the best 3 resources? These can be books, mentors, or people you follow in the space who you say have been most instrumental to your success over these last few years.
Yeah, I'm a big reader. I've read more than 400 books in the past 5, 6 years. I listen to books actually, don't read it. So one book that I've read several times is the E-Myth Revised by Michael Gerber.
Yeah, yeah.
I can't say that. The E-Myth Revised by Michael Gerber. And that book, it's kind of a story, but it's very good because it explains how a company should run. I think that's a very foundational book that people may want to read. Another book is all the work of Donald Miller, StoryBrand. I don't know if you know him.
For sure.
This framework, the StoryBrand framework, basically teaches how to tell a story about your company, about what you do, that people can join, that they can see themselves in what you do. And it's a very helpful framework. And then more recently is obvious, Alex Hormozi. And I like his particular way of framing things. So it's breaking down concepts and reassembling them in a way that it's easy to understand and it makes sense. A little bit my, also my way of doing things with bottlenecks and all these things.
Absolutely. Yeah, great book by the way, The E-Myth Revisited. It's been several years since I've read that, but yeah, it was good to refresh and understand it. So yeah, we'll put the links in the show notes for people to check them out. Andrea, what does success mean to you today? Whether it's personally, business, financially, life, I guess there's no right answer.
Yeah, so in business, I think success is a steady stream of leads and predictable revenue. I think that makes success for a business because that's something you can scale. If you don't have leads and you don't have some stream of revenue that comes out of that, it's very hard to grow a business. So that's what I would define as success in business. In life, I value freedom. Highly. And my end goal has always been to do what I want, where I want, when I want, and with whom I want. And this means you need to have enough money not to worry about money. So that's why I'm in, like, in business. That's why I'm building assets and companies just to fuel my desire for freedom.
Exactly. Yeah. Love it. Love it, Andrei. This has been great. For anybody listening in, founders who want to get in touch with you, learn more about you, and your company, where's the best place to get in touch and where should they reach out?
You can go on confidencestory.com. You will find these tools that I showed on this episode. You will also find other tools that are free to use and can help you grow your business.
Awesome. So we'll put the note. So it's confidencestory.com. Make sure to check them out and say hi to Andrea. So thank you so much, Andrea. I appreciate you jumping on the show today.
Thank you. Thank you.
It was a pleasure. Cheers.
Thank you all for watching this episode and joining SaaS District today. Don't forget to like, subscribe, and hit the bell for future episodes where we interview top leaders in the SaaS industry. If you're a SaaS company looking to grow and unlock the true value of your business, get in touch with us at Horizon Capital and myself or one of our consultants will provide a free assessment To help you get there and hit your goals. If you have any feedback or suggestions for this podcast, please comment down below and help us improve our content for you all. Thanks again, and see you on the next one.
More from Akeel

Get a mentor as soon as possible — and make sure it’s a mentor in your space.



Keith Gillispie: Why Most New Investors Fail & How to Avoid the Common Traps #250 | SaaS District