MatterFact Flowcharts The Secret to Reliable LLM Analysis
25 Oct 2025 · 1 min

0:44
Ashutosh Agarwal shows how to encode decision-making into flowcharts that LLMs follow for repeatable analysis. Building the flowchart makes the process verifiable and reliable, whether analyzing specific industries or individual stocks.
Chapters
More from Ashutosh

youtube.com
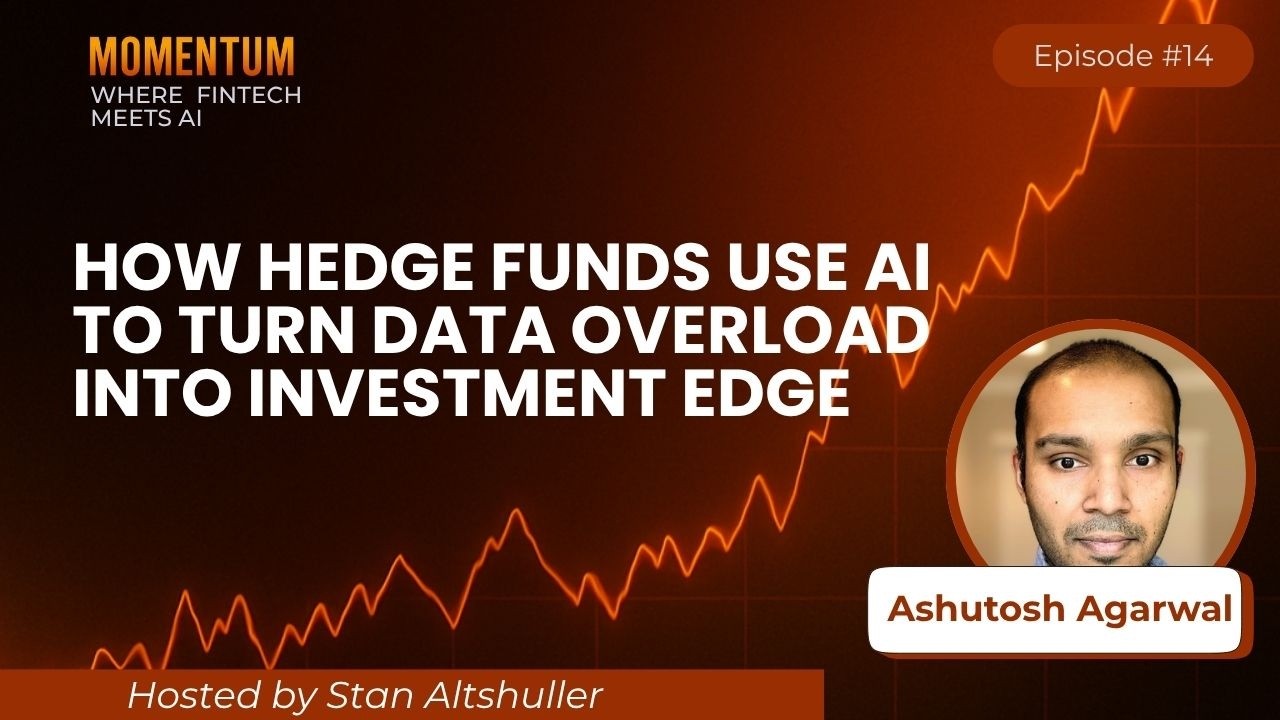
How Hedge Funds Use AI to Turn Data Overload into Investment Edge | Stan Altshuller Ashutosh Agarwal
4mo ago

youtube.com
Stock Picking & Financial Analysis - AI's Impact! | MatterFact CEO Ashutosh Agarwal
1y ago