The 800‑lb Gorilla of GDP
11 Feb 2026 · 1 min
0:54
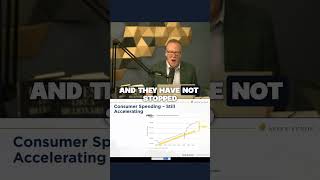
In this brief monologue, Bob Fraser presents a single, long‑running chart of U.S. consumer spending that spans from the 2008 financial crisis through the COVID‑19 pandemic. He argues that this chart captures roughly 70 % of GDP, making it the "800‑pound gorilla" of economic analysis. Fraser notes a brief dip in 2020 during the pandemic, followed by a post‑COVID surge that has driven a 42 % increase in consumer spending since the pandemic’s onset, with the pace still accelerating. He concludes that as long as this consumer‑spending trend remains upward, the overall economy will stay strong, positioning the chart as a simple “cheat code” for gauging economic health.