Julie Broad (Book Broad of Book Launchers) reviews K-Lytics as a market-research tool for indie authors, focusing on its strength in visual "strategy maps" and Kindle-only data. She notes K-Lytics is primarily useful for fiction (especially romance) at the basic level and that nonfiction authors will find Kindle-only metrics limited because many nonfiction sales are in print or audiobook. She tested K-Lytics premium (stated price $97/month; cheaper if prepaid annually) and demonstrates category reports showing metrics such as average sales/day (example: the #1 bestseller in Business & Money sold ~647 Kindle ebooks/day in Oct 2022), average price, page count, title counts, and month-over-month changes. She finds the strategy maps useful visually but cautions nonfiction authors to dig deeper into subcategory data to make decisions and emphasizes knowing and reaching your reader over relying solely on Kindle data.
Chapters
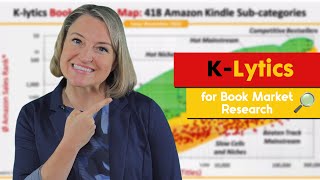
We talked about Ingram Insight Reports, Publisher Rocket, KD Spy, and many other data sources for indie authors wanting to research their books before, during and after they've launched it. But one tool exists that I've not yet covered on this channel and that is K Lytics. So if you're looking for another tool to give you book market data or you're just curious about whether K Lytics is for you or not, well then this video is for you. Hey there, I'm Julie, the Book Broad of Book Launchers. At Book Launchers, we help nonfiction authors write, publish and promote nonfiction books to grow brands and businesses. Some of that work involves book positioning and metadata research. We primarily use Google Keyword tools and Publisher Rocket and KD Spy for this research. But we've also been building some of our own lists internally because we find sometimes these tools don't give us the kind of results and data that we need. And we're also constantly testing and researching and seeing what else else is on the market. We checked out K Lytics in the past and didn't feel like it gave us what we needed for the metadata and keywords. But I recently decided to go back in and check them out again and so today I'm going to summarize what I discovered. Alright, first I paid for their premium subscription which is $97 a month right now. Now just a side note, it's a way better deal to prepay a year because it works out to something like less than $50 a month if you prepay a year. But I didn't know if I was going to keep it, so I just did monthly. Then they also have a basic membership which is much cheaper. But I really don't think it would be valuable to a nonfiction author to have their basic membership because their basic membership focuses on summarizing the hottest categories on Kindle and most of those are romance. So at the basic level, the focus on top categories dominated by fiction and romance in particular, with a little mystery and thriller thrown in there, it's not going to be very useful to my non fiction author friends. Now here's an example of what I mean from their basic report. What you're seeing here is from October 2022. So you see, this is cool data, but it's very high level. It gives you a good perspective of the market trends and current sales. And the cool thing you can see here is the performance of the number one bestseller in the genre or the category. On a daily basis many of our authors are asking us for how they did or how their book is doing relative to other books. Well, if you want to compare yourself to the number one book in your genre. And here you go. The number one bestseller in business and money in October 2022 was selling about 647 ebooks per day. Oh, and that reminds me, I want to emphasize something. This data is only ebook data. This is only Kindle. When it comes to nonfiction books in particular, that isn't any bitty, teeny weeny perspective on the overall market. Now, it doesn't mean it's useless. It helps you understand trends and some of the demand opportunities. But please, please, please, please remember in nonfiction, some authors are selling a ton of books off of Amazon and even those on Amazon, the majority are in print, not in Kindle. So I think that's very different when it comes to the romance market. In the romance market, you're getting a much bigger picture of the market when you look at ebook sales, because people who consume a book a week or a book a day, like many romance readers do, they're reading ebooks. They're not buying as many in print. For our authors, our nonfiction authors, we're almost always seeing print to be at least half of their overall sales and sometimes as much as 70% of their overall sales. And then audiobook sales and ebook sales jockey for second and third. So looking at ebook sales for nonfiction is not even close. And for the whole market in books in general, it's not even close to a full picture. But it's still fun to look at trends and market activity. At least I think so. Do you, if you do smash the thumbs up button, the data that we're going to look at. So the basic level is okay, but I would say if you're not a romance author or you're not an author, just trying to get a high level sense of the market. I think you'll want the premium version, if you're interested in this, to make a few decisions. For one book, just do a month or two of their subscription. There's no obligation. So you can get the data and then call it a day. But if you have bigger book plans, it probably makes sense to buy a year so that you save the big savings. At the basic and premium level, they have these strategy maps, which is where I want to take you next, because I think it's kind of fun to see this visually. In these maps, they plot out more than 400 book subcategories available on the Amazon Kindle store. You can see on this map the vertical position on the map represents opportunity in terms of sales performance. So you look at the top of the map for the high Amazon bestseller sales rank, which is a good thing. And then look along the horizontal axis of the map where you're seeing the degree of competition. The hot sell area is where you would love to be as an author because there's tons of sales and a lot fewer competitors. Now, if you look left on the map, lower number of titles equals less competition, and the right on the map is higher number of titles, which is more competition. So they've done this really cool green shading to represent book categories where the opportunity to risk ratio is the most favorable. Now, this is the November 2022 premium strategy map. As you can see, it could also be called the romance strategy because it's romance, romance, romance for the most part. So not useful for nonfiction authors. Like, I'd love to have this for nonfiction authors because then I could see what's happening in the subcategories of nonfiction. Like right now. Are all the books on inflation crashing it while the crypto books are crashing? I don't know. But alas, this is not going to give us that kind of data. But we can do granular and some digging on our own, which is where the power of K Lytics would be for a nonfiction author. So I'll show you that in a second. But I do love these strategy maps as a visual way of seeing opportunities in the market. So if you're a Roman author, you could use this to figure out the next genre of your book. If you wanted to try to write to where the market is for a nonfiction author, you'll have to dive into their data to get a sense of the sub subcategory performance you're considering. So let's take a look at that now. And by the way, I'm going to stick into the K Lytics website to show you this. But you can download this as a spreadsheet if you like to do dances with spreadsheets for simplicity. I'm not doing that. I've just done a category filter to get us all the nonfiction categories. For general market info, you can sort by best performing category. When I do that, I can then look for anything that is green. This is nonfiction and only Kindle, so we're not seeing a ton. But here's a weird one. Biographies and memoirs, professionals and academics, chefs. That's the category. And then you see another one where there's opportunity, which is cultural and regional, black and African American. And then this category about The Royal is not a surprise because Meghan Markle and Prince Harry have all these books that have been written about them this year. So it makes sense that this category is hot and selling a ton of. So on that point, make sure when you see a trend like this, you're digging into the reasons behind it. And don't just assume if you write something that fits in that category that you're going to sell. Well, unless you're doing an expose on Meghan and Harry and you're going to be launching it right now, because that might crush it. But the information here is interesting, including page count. And of course, to see what's going on, click on the category and bestseller list, which I'm going to do for the chef's one because it seems like a weird one. Okay, well, these books are popular. Interesting because it's such an odd category. But now you can see what books are actually falling into that category. When you scroll down, you see there's a ton of non seller nonfiction books in here. And again, don't get discouraged or panic about this. This is looking at Kindle sales and it's not representative of all nonfiction sales performance. It's why I always tell authors it's more important to know your reader and how you'll reach them than it is to do this kind of a research. Because you could sell thousands of books direct to your reader if you know their pain. Point a company that's serving them and they want to buy those thousands of books. Okay, let's just filter for the hot books so you can see the data. Not much is hot in the nonfiction space in these reports. Again, a factor of this being Kindle sales and being relative to all of the fiction books. But the data you get is interesting. So you see the average sales rank the average sales per day of the bestsellers. See, we're seeing three books per day on average in this sub subcategory. You see average price, lowest price, how many titles, how that title number is changing month over month, and you also see average page numbers. It's good data to have a sense of when you're doing your metadata research, but it's not necessarily going to have real decision making power to have this information. What I love are the summary presentations Alex of K Lytics puts together for his members. His analysis and insights in these presentations are great, but again, rightfully so. He focuses on romance and other fiction categories more than nonfiction authors. So as nonfiction authors, we're going to find the information on Kindle sales rather limiting and maybe discouraging. I'm going to keep my subscription for a few more months to play with it, and maybe I'll do one more video for you. If you want that and you have specific questions or comments, please post them below and make sure you've subscribed to the channel. Turn the notifications on so you can catch my video response when I create it. Now, after watching this, you might be wondering what other research tools you might want to check out. Well, this video is going to help you with that. And if you want the latest and possibly the greatest from the channel, this one is for you. Either way, I'm really excited to see you again, so please click on over.