Copying Tesla's data engine, but with food images | nutrify #1
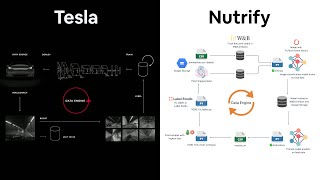
Daniel and Josh show how Nutrify builds a data flywheel: train a model on food images, find the most confused predictions, manually relabel 60 of them in Label Studio, retrain. Josh rebuilt the iOS camera in SwiftUI to cut CPU and battery use. The model currently predicts lemon for everything, a bug they're tracking down next.
Chapters
Hello, welcome to Nutrify HQ. I have no idea what episode this will be or how these episodes will turn out, but basically my brother and I are building a food education app and it's the 5th of December 2022 and here's what we want to do this week. So I'm the ML guy. Basically, I want to make the training script reproducible. So train.py. I'm taking inspiration here from the beautiful PyTorch image models library on GitHub. This is how you know you're getting serious, is when you print out the Python script. It's 11 pages long, so I've got some reading for this morning. But by the end of this week, I want to make the training reproducible. I want to make a training.py script and have, by the end, I run python train.py and the latest dataset, which is a bunch of food images on GitHub— I mean, sorry, Google Storage. and labels, which is also a CSV file right now on Google Storage, gets used, and the results get tracked on— I'm using Weights and Biases to track the experiments, so the modeling results, and I'm using Weights and Biases artifacts to track the latest data, so the food images, and the artifacts as well for the labels. So if they change, it should implement into train.py. So if I update the images or update the labels, every time I run train.py, which will be a manual process for now, it should use the latest data. So that's me for this week. And now Josh.
Hello, my name is Josh and I am an iOS developer, as you can see here. My job at the moment is not— well, it's— I think it's the fun part. It's the front end, a lot of the front end design, which is what I like doing. So I have here create Snapchat-like views, swipe between. So it is a camera app, so I want it to function like other camera apps that are out there. The only reason I say Snapchat is because a lot of the other apps out there that are camera apps function the same way. They all function the same way, so people just know how to use it regardless. Save photos to a photo album on phone. So what we want to do is all the photos taken on Nutrify, obviously we want to, you know, be able to teach Nutrify and whatever. So create an album on someone's phone, which then we can ask, can we have, like, basically have those out, that album of photos, and then we can, you know, we get more data in a sense, so we can make everything else up here better, right? Detailed food view. So when you take a photo of a food, just, you know, start working on being able to tell people what actually is, what more about the food. At the moment, it's kind of like a skeleton. It's working. I know it needs a bit of work, but yeah, it works and it looks pretty— it's looking pretty good already. Basically frontend this week, I reckon, getting that sort of sorted.
Beautiful. Right now, if I run python train.py, it's going to call my training script, which is a bunch of hacked together code. So don't pay too much attention to this, but I'm trying to get the workflow down pat of creating a data flywheel. So this should be tracking to Weights and Biases right now. We can see epoch 1 there, bunch of warnings 'cause of the data. You can ignore those. But the beautiful thing about this is that we can click into this on Weights and Biases. And this is how my model is performing right now. So we've got the details there. I'm not training it for too long. I've got the epochs frozen at 10 because I want to keep it nice and simple. I want to just train for 10 epochs, Where do we go here? Epochs. And see how well it performs because I want to freeze the model and iterate over the dataset trying to replicate the data flywheel. So this is the goal of what we're trying to do right now. We have a data source, which is a big lump of images in a Google Storage bucket. I want to train a model and find where the model performs the worst on training and test examples, update those examples in terms of maybe more images or better labels, retrain a model, and then see which model performs the best. So if we go back here, given a certain dataset, that is. The beautiful thing about using a service like Weights and Biases is that I've got all of the experiments I've been running saved here. So this is Volcanic Forest number 44. Here is the magic part, which I found out— this is really fun— and that's artifacts. So this is the important point about tracking what data goes into your model what labels goes into your model and what comes out. So right now for this experiment, the input artifacts is I have a set of labels which are stored on Google Cloud and a set of images which are also stored on Google Cloud. And then they go into my training.py script. We go here, which is again hacked together. There we go. run.use_artifact, that's Weights and Biases, uh, and there's labels. So there's the labels, Weights and Biases artifact. So if we click into one of these artifacts, we can go lineage and it's going to show you how this model was created. So we have the input artifact, which is labels. We have the input artifact, which is a dataset. Then we have the experiment tracking run here, which is what we've just looked at. This is in the runs. And then we have a trained model artifact. Now this is— right now it's being stored on Weights and Biases, but I could download this from Google Cloud because it's also stored on my Google Cloud instance. So files, there's the model there, there's the current timestamp, model.pth, download that. There we go. It's going to download. I'm not going to wait for that, but this is what I want to do in this predict.py script. So this is my goal for the afternoon or the next couple of days is to download the best model from Weights and Biases. So if we come into here, this is create model. Again, this is just hacked together script. We want my model is that run.use_artifacts weights_and_biases model artifact, which comes from the args. I want to download the model. So in that case, it might download this file here and then use it in this script. It's going to use the same dataset. And then I'm going to start writing some code here for the model to make predictions across the training and test samples. And then I want to export/show the results particularly the results that the model is most confused about. So for example, it has the highest test loss, but the label or the prediction was correct or the prediction was wrong, which is exactly in line with the Tesla's data engine. Find the inaccuracies. So examples where the model might be really confident, but the label was wrong. And then I'm going to relabel those examples or delete them if they're not worth having in there. Retrain a model, and then go back to Weights and Biases and see which model performs the best. I've broken out the functionality of predict.py into a notebook because I've just found it's faster for me to experiment in notebooks. And then I can move the code that works back into predict.py. And so the goal here is to predict on a series of images. So Here's what my function up here does, which is predicts on a single image. It opens the image, uh, makes a prediction with a trained model here with torch inference mode, and then saves the details of that prediction to a dictionary. So then I get a list of dictionaries with the image path, the prediction label, the probability, and the pred class. So then I can later do some experimentation to find out where my model was most wrong. And I just found out that I had an indexing error because I thought, surely out of 1,000 random samples— I've got 25,000 images, but I'm only doing 1,000 random samples to keep, uh, experimentation quick. So a random 1,000 indexes, and then I just started printing out the true class and the pred class because I couldn't figure out where the indexing error was. And then I had this dictionary here— or sorry, this DataFrame here of the image path, the pred label, the pred prob, pred class, true label, and true class. And I figured out my model was basically random guessing. It got 5 samples correct out of 1,000, which is pretty much bang on random. If you have 1,000 samples and 199 classes, you should get about 5 correct out of that 1,000 if you're just randomly guessing. So I updated the prediction code to index correctly. So now let's plot some of the most wrong samples based on the improved prediction code. There we go. Beautiful. That's exactly what we want. So we've got a prediction here for eggs, but the truth is porridge. Bread is parsnips, but the true is rosemary. Squash. So you can see here, these are samples where the model has a high prediction probability. So it's pretty confident that it's eggs. But the label is different to the prediction. So the true label is porridge, the prediction is eggs, and the prediction probability is high. So what I'm doing here is grabbing the top, say, 10 examples. In this case, it's 100. Let's just go most wrong. We'll get the first 20. So my goal here is to say, for example, I go through all of these and correct the label. So in this case, is the prediction or the label correct? Got the prediction as egg. I would, in that case, it's a bit confusing because it's a dish. That's going to be a problem I have to take on later. But in this case, I would change the label from porridge to eggs. And in this case, is it parsnips or rosemary? Well, for me, that's parsnips more than it is rosemary. I guess it's picking up rosemary here from the label maybe, or the text. So the prediction here was chocolate cake, whereas this is hot chocolate. So you can see how we can inverse on the table of the most wrong predictions, those with the highest prediction probability, and compare the pred classes to the true class to potentially improve our labels and thus get a better model. So what I'm going to do here is keep working on the predict.py script so that I can do this at scale across a whole dataset rather than just 100 or 1,000 random examples. And then I want to create a pipeline where I can go back through and correct the labels that could be better. Nice! So I've just followed through this little guide here, which is the log tables documentation in Weights and Biases. That's actually one of the big features of Weights and Biases is that how simple it is to get things running. And then I've got a little bit of code here to take the wrong, or the most wrong, DataFrame, the samples from here. So we've got images There's my plot there, and you can just create a table by— I turn it into a dictionary, so the most wrong dictionary. So then we've got samples as a list of dictionaries, which are the most wrong, the top 100 most wrong. Weights and Biases doesn't handle— it needs to be JSON serializable, so I turn the POSIX paths, the paths here, into strings. So if we turn— we look here, that's a POSIX path. I've turned that into a string there. And then I've used the weights_and_biases.image object to turn the image at this location into a viewable image object, which is what we've got here. And then we can create a table with columns. We've got a list there. weights_and_biases_table.columns equals columns. For sample in mostwrong_dict. So this is here, all these samples, 100 of them. We're going to add data to the table and then we're going to log the table, the Weights and Biases table, to the run. And if we come up into here, we've got a beautiful visible table which is stored within all of my experiments. So I can view this as full screen, and then it's just like having my DataFrame from before, but it's interactive. So we can go right to the end. So we've got one example here which was predicted fruit juice but the true label is passion fruit. So maybe we could relabel that. And then we've got tofu, which was the predicted class, but it should have been— apparently it's pork belly. We've got iced coffee, but this is— the true label is milk. So this is giving us an insight into some images that we could improve. So the next step will be to take these, load the images into some labeling software, and potentially improve what the true label should be. So that the next time we train a model, the predictions improve. So it looks like if I want to use Label Studio for updating my prediction labels or updating my existing labels, I need to use the Label Studio JSON format. How to format your data to input it. Label Studio treats different file types different ways. If you want to import multiple types of data to label at the same time, for example, images with captions or audio, you must use the basic Label Studio JSON format. That's what I'm going to be trying to do is, because currently I've got everything in a CSV. Here we go. There's just my CSV image path, pred label, pred prob, pred class, true label, true class. I need to figure out how to convert this into the JSON format. That's about enough for today. I've run into an error here trying to upload a single image sample. I'm not quite sure how Label Studio wants me to upload my data. The guide is quite convoluted. There's about several different ways to do the same thing. Essentially, I just want to upload a sample with a link and what the label already is and what the prediction was. But I'm finding that quite confusing. All right. So after a whole bunch of trial and error, of trying to get the most wrong samples into Label Studio. I ended up figuring out, thanks to a bunch of help from this YouTube tutorial here, Data Labeling for ML Model Retraining with Label Studio, how to get my labels from a CSV into a dictionary, into the JSON format, which is here, that is required for Label Studio. And then also Label Studio requires HTML to set up the labeling interface. I'll show you what that looks like in a second. But I've got some very hacky code here to create a series of HTML-like strings. So there's the start, it's a Vue tag. And then there's the middle of the string, which programmatically reads classnames.html.txt and then adds it to the end and then exports it as this big HTML file here, which then if I go into label Shuyo, appears like this. So I've got the true prediction here, which is porridge. The prediction from the model— oh, sorry, the true label is porridge. The prediction from the model is eggs and the score was 0.965. And now of course I can readjust it to something here. Eggs, fennel. I'm going to keep it at eggs for now. But if I go into the settings here, instructions on a labeling interface, this is what I wanted to create programmatically, code. There. So rather than filling out all of these fields by hand, which is what I thought I would have to do, that's why I've got a bunch of hacky code here to turn it into an HTML script. So that's very fun. But now essentially what I can do is take this. These are my most wrong examples. Go into Label Studio and I now have a visual interface to relabel them if necessary. Look at that, 100 images labeled. So this is very exciting. We're slowly putting together all the pieces of the puzzle for a data flywheel. But I've been through all of these images, gone into them, and sort of— I didn't really have a structure of going through it. I just wanted to experience what it was like to manually label data. And I found some examples that are quite confusing, such as nectarine versus peach. It makes a lot of sense for the model to get confused on these kind of samples, considering that nectarine looks quite similar to peach. And then another one was pawpaw and papaya. If a true sample was papaya, the model might predict pawpaw and vice versa. So going through all of this has given me the idea, or a few ideas actually, to use a big model for a labeling pipeline. So that means a very large, in terms of parameter and megabyte size, model to label examples. So the bigger model will likely be more accurate. And then I can update the labels based on the inference of the big model and then use those updated labels to train a smaller model to deploy to various devices. Then another idea would be to have a similarity model go over the text and images and figure out what kinds of classes are most similar to each other. So blueberries and strawberries, mandarins and oranges, chicken breasts and chicken thighs. And then the predictions could return the top 3 predictions associated with that label. So for example, in the workflow, the model could predict blueberries, but it also returns information for strawberries, raspberries, and blackberries. So for example, if I look up blueberries, so this is a great example of when again, there's 2 foods in the image, because right now we're just doing single class classification. The true label blueberries, but the model has predicted raspberries. So we could just say that the prediction is raspberries, but in an array or something like that in the user interface, we could have blueberries, strawberries, blackberries all along with it because they're quite similar and they usually group together. Look, this is the power of going through labeling data, right, manually. You get just a great insight of how your dataset could be improved. We're freezing the model and iterating on the data. But for now, I'm finished labeling these most wrong examples, 100 or so. My next step will be to export them in some way. Let's see what this looks like. Now we have some updated annotations. Yeah, here we go. Fruit juice is the updated annotation. And then we can come down here and we have the data that is that unique identifier there. So my next step is to merge these updated annotations with my original annotations in the Google Cloud Storage bucket. And then hopefully it pulls everything together in Weights and Biases. We've just merged the updated Label Studio labels through a bunch of little Jupyter Notebook scripts. We download the original annotations, we put them into a DataFrame, We get a dict, a dictionary, a reverse dictionary map, as well as a regular dictionary map. Because what we do down here is we open the most wrong annotations from Label Studio. And so this is the updated label that I created through Label Studio. And if we scroll down, I just made sure they were correct with some, again, hacky checks that I created a data frame with the updated labels. And then I essentially formed or created a merge on the original annotations and the updated labels here on the image name, because remember, the image name is a unique ID. So then we have the original class name, the original label, the updated label, and the updated label key. So the updated label is actually the updated class. So if we come down here, a lot of them are going to be null because I only— I found out that I only updated 60 labels. Get the rows where the updated label is not null. So a lot of the original annotations don't have an updated label. They're just going to be the same. And the class name is different to the updated label. So that means that the updated label is different to the original class name. So if I get here, this is going to be the updated rows. After labeling the 100 most wrong images, I decided that 40 of them can keep their original label. So I've only changed 60 samples in the dataset. So be interesting to see how much this changes the model's results. Let's go python train.py. No bugs. I need to activate the environment, of course. Let's see what happens. Logged in. Is running. Is it going to re-download v0. Oh, okay. I don't think it's using the latest version of the labels. Ah, you know what I need to do? I need to let Weights and Biases know that I've updated the labels. Boom, there we go. So I just have to rerun this artifact tracking here. I know I've got it, I've got this all over different scripts here, but this is organized chaos. I just have to re-add the reference to my annotations path, which is on Google Cloud Storage, Google Storage, because I uploaded this file, Weights and Biases is now tracking the updated version. It should pull v1 now. So if we have a look in artifacts, so foodvision_labels_v0, that's what it was using before. We want v1 to be over here. Do we get foodvision_v1— v2? There we go. Beautiful. foodvision_labels_v1_annotations.csv. So that is all we've changed. I've changed 60 samples here. Let's see, let's let the model train and then come back and see how it alters the performance. GPU humming away in the background. Looks like we've done 2 or 10 epochs. Let's have a look to see if the test loss has changed. We're uploading the model. So we've got our runs here. This is the robust morning, which is what I've just run with 60 updated labels. What do we get? Test accuracy. Oh, we have a little fall. Robust morning. Do we have a lower test loss? About the same test loss. Okay. So it looks like we have to update more samples. My little experiment didn't work. Yeah, there we go. Okay. Test loss 1, 4, 1,948. Let's sort this by ascending. So that was what we just did before, robust_morning_75. So that was with the latest. Now this is the beautiful thing. Although we didn't get better results, I mean, Sage Donkey, what we ran 2 days ago is still the best. We did get a boost in training accuracy though. So that's a good sign and a slightly lower training loss. Remember, we only updated 60 samples. We've now got the workflow down pat, but there's been a lot to take in here. So let's make it a bit more visual. End of the week, machine learning update. So make train.py reproducible. I did finish that. However, the code is still pretty rough and it's not on GitHub yet, so I need to update that. I need to now do, for next week, the same with predict.py and a few other labeling scripts. Track the data on Weights and Biases artifacts. That is happening right now. Track the results on Weights and Biases. That's happening right now with the Weights Biases experiments, and the labels are also being tracked on Weights Biases. And so at the end of the week, I wanted to be able to hit python train.py and the latest data and labels get tracked, slash the results, or get used, sorry, and the results get tracked. So that is a tick. So next week is mostly going to be refining the scripts train.py, predict.py so they all work together because it does work together now, but It's pretty hacky.
Josh? Yep, you wanna switch a room? Yeah, hold the camera. Do do do do do. All right, don't really need this because all of mine didn't get done. So what initially the Nutrify demo was built in was an ARKit or augmented reality application. There was a few functions there that were just looping a lot of stuff, and I wasn't happy with how it was running because like even on a 14 Pro I was— it was capping out down to 30 frames per second. And I think just purely because it was an augmented reality application, it was built as an AR app using the AR camera. It was more like a game. So it was trying to keep up with 60 frames while performing a vision request and then after that performing another Core ML request. So what we did was I was like, don't worry about all that. I'm not happy with the phone overheating and like glitching and like running, running really low, which is what you would get when you're running 100, 120% CPU. I went ahead and rebuilt the whole thing in a custom camera preview using SwiftUI and UIKit, mash them together, and it gives us what we've got now. Uses 10x less CPU, so phone doesn't overheat, which is a plus, which also reduces the amount of battery that we're going to be using. So You're going to go from high, very high battery uses is what Xcode was telling me to now low, very low, and then a fraction of the RAM as well. So using like 20 MB.
Let's see a demo.
We'll see a demo. Awesome.
I like performance increases.
Live demo. What the app does is here it will tell you if it detects food or not in the camera using the vision request, which is using another model from Daniel Bourke. So it was two models running. 1, food or not food. 2, is it a food? What food is it? All right, so when you're panning across the table on a, on a, like an aircon remote, it's going to say no food detected. You won't be able to take a photo. It's going to give you some feedback. If you were to move the camera closer to a food, then it can start detecting that there is a food in frame. And once you take a photo, at the moment, as you could probably see through the screen recording, Everything is a lemon.
Um, so our app is currently a lemon, but that's good. Errors are what you want in machine learning models. So when you get errors, it gives you an opportunity to improve the errors and thus improve the model. So right now our model is just predicting lemon for everything. That could be an issue with the model, or it could be an issue with maybe the indexing of how it's coming out on the phone.
Yeah. Good, could be a whole bunch of things. Could be the way I'm feeding the photo to the model. It was working before, so it was before we decided to film this video today. All of a sudden now it's only outputting lemons.
What are you going to do next week then, Josh?
I'm going to, you know, I'm going to have to go back and see where, what the photos are coming out like and just see, you know, how they look and what's being fed to the models.
More from Daniel
Small Language Models (SLMs) Are the Future: Fine-Tuning AI That Runs on Your iPhone

Introducing Sunny - A MedGemma-Powered Skin Health Tracking App (Kaggle Competition Entry)
Benchmarking: NVIDIA DGX Spark & NVIDIA RTX 4090 | Part 4 - Comparing the results
Benchmarking: NVIDIA DGX Spark & NVIDIA RTX 4090 | Part 3 - Running LLMs on the RTX 4090
Benchmarking: NVIDIA DGX Spark & NVIDIA RTX 4090 | Part 2 - Formalizing the tests
Benchmarking: NVIDIA DGX Spark & NVIDIA RTX 4090 | Part 1 - Creating a series of tests

Local Multimodal RAG on the NVIDIA DGX Spark | Part 4 - Publishing our demo to Hugging Face


Local Multimodal RAG on the NVIDIA DGX Spark | Part 3 - Putting it all together