09 netsniff ng jon schipp
Jon Schipp presents NetSniffNG, a suite of eight high-performance network analysis tools built with memory-mapped I/O and kernel-level optimizations. The talk covers core tools like netsniff-ng for packet capture, trafgen for traffic generation, and flowtop for connection tracking, plus hardware tuning needed for line-rate capture.
Chapters
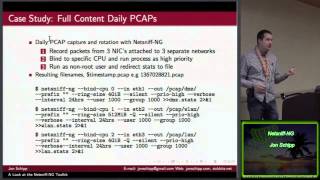
Hello. Jon Schipp is a HackerCon winner, Captain's Flag/NetCon winner. He's a Black Badge holder and has spoken at every HackerCon since then, is that correct? That is correct. So please join me in welcoming Jon Schipp. Hello everyone. Alright. Okay, so today I'm here, my goal is to persuade everybody to try out the NetSniffNG toolkit. And we're gonna go through a bunch of examples and this will be primarily a technical talk, so bear with me. So the first question is, why would we want to use NetSniffNG? NetSniffNG is a suite of tools. There's a number of them, there's 8. And there are 7 of them that are pretty much production ready. It's a fairly new toolkit and it's coming to a good stage in development. Now the word up here that's interesting is high performance. And we'll talk about that, why NetSniffNG is, could be called a high performance suite of tools. So let's get started here. First, a little bit about me, some introductory things. I just took a new job recently at the National Center for Supercomputing Applications, which I like very much. And you may have heard of them if you're familiar with Bro. Is anybody familiar with the Bro project? Alright, so we do, we have involvement in the Bro project, some of our developers on the team. I'm the founder of the DuBois County Linux User Group, I'm with the Southern Indiana Computer Club and I am a contributor to NetSniffNG, mainly documentation but I've done some, I've submitted some patches for code and I do testing and reviewing. Okay, so a little bit about NetSniffNG. So it started in 2009, like most open source projects it was done in the free time of a few people. So there's two core or main developers now, maintainers, and that is Tobias Clauser and Daniel Borkmann, and they are both Linux kernel developers. So NetSniffNG is packaged in a number of Linux distributions, so you can find a package manager and usually have it. It'll probably be an older version though. There'll be new packages coming out in the future. So what can we use it for? Well, standard network tools are used for analysis and debugging, monitoring, and auditing, and NetSniffNG can fulfill all those gaps. So here's an overview of the toolkit, and you can see there's quite a few tools. We'll only talk about a few of them today, primarily IFPPS, BPF-C, NetStiffNG, and Traefgen with a little bit of Flowtop in the mix. So let's put this into the bigger picture. What does this look like? So at the top we see the toolkit, and the branches are the domains of each tool. So we have traffic encryption, measurement, generation, and capturing, so you can see where that fits in. So the gain. So NetSniffNG and Traefgen use memory-mapped I/O buffers to process, to buffer and then process packets. And that is about the fastest you can get on a Linux system from user space. So the buffers are memory-mapped between kernel space and user space. So there's less amount of interrupt switch between the two and less context switches. And we use in Linux, or Linux system, we use the system call socket and we pass specific options to use pf packets to get full access to all parts of the packet, from the headers to the payload. And at the bottom you can see where it mentions that gives us control over the entire packet including the data link layer.. And like for example, uh, HP uses raw sockets and you don't get the data link layer in that. It's IP and above whenever you're generating traffic. However, with Traefik we can get the whole thing. It is optimized for Linux, uh, because of our developers, or the core developers are kernel developers and they work in network development and a few other areas. Um, they are familiar with the internals and thus they can take that with their knowledge and then move that into NIST DiffEng to take advantage of new features, which we'll talk about. It's also a very small code footprint. Tools are very small in size. So as I mentioned, it is a good point in its lifecycle, so there's been a lot of additions over the past year and the tools are relatively stable now and production ready. And I've used them in production for a company already to do full content packet capture with NIST DiffEng, and I've used Traefik and PerformanceTest. And we'll get into that. So let's see here. So another reason you could, that's NetStfng can be useful if you're a developer, as I mentioned that they're kernel developers, so they have some of the latest additions integrated to NetStfng, and if you wanna review examples of source code using the latest developments from the kernel, you can review the code. 'Cause maybe there's not many other tools that use a particular feature available in the kernel. So here's some latest developments in the Linux kernel. Available in 3.2 and above is tpacketv3. So before we were using tpacketv2 and this is a, just a structure to store packets in. And libpcap uses tpacketv2, thus all the tools that are using the libpcap library will also then use tpacket version 2. Now nestefng is not reliant on libpcap. For packet processing. So they actually have the tpacketv3 code in there. So in— on the discussion mailing list on one of the Linux kernel mailing lists, tpacketv3 was suggested to have a 15-20% reduction in CPU usage and a 20% increase in packet capture processing rate. So that is something to consider in high-performance applications if you can use an application that can take the value from this new tpacketv3 structure. Another thing that was recent in the Linux kernel 3.10, so that's a few months ago probably, is a new BPF instruction. So this is really nice. So with this instruction, what we can do is you can actually just write packet headers to disk truncating the payload. And all you have to do, I have an example of the instruction at the bottom. So in high-level BPF language you would say load poff, that is the instruction, and then we want to return the value that's in the accumulator, the reta. That will then return, once you implement that into the socket, I see tell net-sniff-ng to read that filter file, header.pffc in my example, and then the packets will be written to disk, headers only, data truncated. Because before that would kinda suck. You'd probably have to do some sort of math 'cause, you know, we have the UDP 8-byte header, the TCP 20-byte header, you have to work in all that. So this is really nice, this is a new addition. And this is not implemented in libpcap, that is not to say that it won't be in the future, but this is a new instruction and it is in bpfc which is a part of the nistdiffng suite. Here's another example of a neat little addition and this is the Virtual Netlink monitoring device. So you can create a new pseudo interface and it can actually record Netlink messages, which are basically networking-related messages passed between the kernel and user space for inter-process communication type things. And this is actually a packet analyzer neutral, so you can do this with NetStiffNG, and you could also do this with tcpdump or any other tool. Okay, so now let's get into NetStiffNG. So it is an analyzer, replayer, and packet recorder. And it is now included in, well first I should ask, is anybody familiar with Security Engine? Any hands in the air? Security Engine? So yeah, most of us are familiar with Security Engine, it's a very cool project. NetSniffNG is the backbone for packet capture recording in Security Engine now. It replaced DaemonLonger maybe a year ago, I don't remember what the timeframe was for that. And I've submitted a few patches to Security Onion to actually allow you to view the pcap stats from NetSniffNG whenever you use the SoStat tool. And now I submit also a patch to do in the menu when you're setting up, you can actually specify the ring buffer size, the size of the ring buffer in memory that you can allocate packets. So you can increase the size if you need to if you have a lot of packets coming in. BPF, or excuse me, NetSniffNG enables the BPF JIT compiler. So the JIT compiler, just-in-time, is a compiler in the kernel where whenever we, what actually happens is the difference between a BPF compiler regularly and the JIT is that JIT converted into native architecture code, so it tends to be quicker 'cause you're running on native instructions. So we'll put a JIT image in there and then it'll compile the stuff and then it'll be native code. So in all the latest kernels, I'm not sure what version, that's probably been there for a while though, the JIT, but Nessif-ng will set a value in your sysctl settings to enable the JIT and take advantage of that. And the result is you get about 50 nanoseconds of performance increase per packet coming in where the BPF filter has to be applied to the packet. And it also does basic OS tuning. So your proc/net, or not proc/net, your, there's certain system settings like your rm and wm buffers. Increases those sizes to large values so you can buffer more traffic. And with the top part, we're at now speeds comparable to pf_ring in transparent mode 0. One neat thing is that the Linux kernel, if you don't want to use BPF, it has a few options for packet types. So instead of actually applying a BPF filter, there's socket options where you can say, I only want broadcast traffic, multicast traffic that are not— the socket says, "Oh, we'll only capture these," and this is actually not done in BPF. And NetSniffNG has the option to take advantage of that. So what you do is you just say, "Hey," there's a few options that we support, actually support all the packet types, and you say --host if you want all traffic that is addressed to the host that you're on. --broadcast, it automatically gets all the broadcast traffic it sees and writes it. So you don't actually have to do a BPF filter for broadcast. Which is pretty cool. So here's a few examples. So NetSniffNG is pretty intuitive, the options are very easy to read, in, out, so I really like that, makes it simple. So things are coming in, things are going out. In can be a file, interface, you can replay to another interface, so you say in interface, out interface, you can use things like that. And output to a directory, output to a single file. So here we give an example, we're doing a full content, how we may do a full daily content packet capturing. Scenario, we wanna use --silent so it doesn't print to the terminal 'cause if you print to the terminal you're gonna have interrupts and that'll take more processing time. For every packet the terminal needs to be interrupted to print to the screen. And then we specify a ringbuffer size, we set the priority to high which is pretty much the same as setting the nice level to -20, so on and so forth. And we wanna rotate at 24 hours so every time we hit 24 hours a new pcap file will be rewritten. And we can also do this from wireless, we can sniff from wireless. Raw 802.11 replay from interface to interface and we can also apply a BPF filter. This is another example where you just say, you can actually use tcpdump-like filters, so libpcap filters where TCP and port 22 and what it actually does, NISTFNG does not rely on as I mentioned to use libpcap for packet processing but it does use it to allow people to make easy filters without using a Slumber-like code to write the filters which is kind of a pain. It is compiled with the libpcap library, but that is only, only to compile the filters. Or you can specify filters with bpfc and then integrate those in there by specifying the file. So here's a little output, this might not be too visible from where you guys are sitting. We can, if you use the --verbose option, we get the default ring buffer size, the number of frames that can fit in the buffer, the max frame size. And so on and so forth. NetSniffNG gives you, does a MAC OUI lookup so you get the vendor of your MAC address like Wireshark and many other tools. GeoIP location's built in which is kinda nice so in the example below you see that we have a packet that is sent to Sydney, Australia. Yes, Bill? Is there a -V? Yes, there is. I think it's -V. —go. Yeah, there's also, so I'm giving you guys the GNU long format options, there are also the short options too, but just for readability, yeah, for readability it's easier to use the long format 'cause it has a little description of what it is. Sorry. Yeah, no problem. And then we got some statistics that come with most packet capturing tools and that is incoming packets, the number that were processed, those that passed the filter, those that dropped, and the percentage of the drop rate in a percent, and then the capture duration. So let's move on to the next tool. This is Traefik Gen. So Traefik Gen is a traffic generator. This is really cool. This can be used for fuzzing and it can also be used for just generating packets. You wanna see certain responses from machines or performance metrics, which is, I think, is a key hit for this tool. It is multithreaded. And it is a low-level traffic generator, as we talked about before. With the socket it uses, we can have entire access to the frame. So here's an example of this graph here shows Traefgen versus Mauzaton or versus PacketGen. PacketGen is a Linux kernel package generator. And this is a kernel module that is used among the kernel developers and other people to stress test machines and stacks. And this is a performance metric against that, and we can see that Traefgen is very, very close to packagegen. Packagegen— this was done from Daniel's thesis, one of our core developers. Packagegen is quite a little bit faster in his performance tests. Look at the frame sizes— excuse me— at the bottom. But Traefgen is up there with them. So, which is really cool, because this is done from user space, whereas The Packagen utility is actually done in a kernel module, so it's done completely in the kernel. So a little comparison between the two. Packagen is faster on smaller packet sizes. It's about the same otherwise between Traftgen and Packagen. So I give an example of small packet size, 64 bytes. Traftgen was able to do on the system I was using 520,000 packets per second, and with Packagen I was able to increase that to about 60,000. Or 620,000 packets per second. Trapgen is more customizable. This is because of the way that Packagen is designed, which I think I have an example next slide. You actually use the proc filesystem, you actually echo values into /proc/fs and there are certain values that you can echo and then pretty much you don't have any other choices. With Packagen we can create a file, a configuration file of bytes and from the beginning of the frame to wherever you want to stop, send it out. So you have complete control, and we'll give an example of that coming up shortly. And as I mentioned, traefgen or packagegen uses the procfs, but traefgen, besides being able to read from a configuration file, it also has expressions, built-in macros, so you can do things quicker. This is an example of packagegen. So basically you echo a bunch of values to procfs, And then when you're done with all this, so this basically says I wanna create a packet with a source MAC address, a destination MAC address, destination IP address, source ports, and at the very end we'll run another command to tell the kernel module to send that data and read from those values. And it sends it out. Here's Trapgen. This is in hexadecimal. But it doesn't have to be like this. There are ways to do this Well, this is nice to have hexadecimal values 'cause you can just copy and paste from Wireshark's protocol dissectors, right? And paste it in here and you can make your own stuff like that. But we can actually use decimal, ASCII, and so on, so we have a lot of control. Okay, so here's some performance metrics, or a basic performance metric I did. This is on an old machine and it is reported, I will preface this with that many people are reporting line rate among the frame sizes 4-traf gen for 1 gigabit per second Ethernet. My machine being 6 or 7 years old wasn't able to quite make that, but you can see in the 1 gigabit line rate attempts for the 64-byte packets I got 24%, and as the packet size increases I get closer to line rate. So you see 96%, 97%, 98%, and then 98%. So that's pretty much line rate, very close, 2% off for those last two sizes. 10 gigabits per second, a little harder to do. Again, I'm using an older machine, this is the same machine that had another slot with a few network cards. And I did a comparison with TrapGen and PacketGen and basically for PacketGen is about double on the smaller frame sizes. So where I have 3%, they would have 6% in PacketGen in performance, so This is a basic test. I'll do more later with actual run, multiple runs and such and release those. But that gives you an example. So there's how we can use Packet Attraption. If you wanna send 15 million packets out of an interface using all the cores available on your system, you would run this command. You just say, "Hey, I wanna read in this configuration file." I called it 64.cfg, which is telling that it is 64 bytes. A packet of 64 bytes, output it to eth2, and specify the value of the number of packets to regenerate. So here we can do a fuzzing test. So if you have this configuration file with a bunch of random data and you wanna fuzz a network stack, you can put it in there and you can use a smoke test option. There's also some seed values where, so basically this will run this and then it will do an ICMP echo request to the destination machine in see if it's still alive, and it'll generate a seed value if you specify that option for debugging. So you can find out if it crashed. It can generate raw 802.11 frames. So open a mon0 interface, right, get raw access to the device, and then we can generate traffic out like that. And in this example I also specified we only wanna use 2 CPUs. And another thing about TrapGen is that we can use stdin, stdout, so there's built-in configuration. -e, we pipe it out to another instance of Traefgen, tell it to read it in, and then pass it along to the interface. So here's the expression language. This is nice. So we have a few macros. We have fill, random, dynamic random, constants, decrementers, and incrementers. Few examples. Let's go to the next slide. So for fill, number 2. So we say we want to fill some data for n bytes. So we wanna say, if you want to do fill a packet of 0xFF, 255 in decimal, 10 times, so we make a 10-byte packet of those values, we can just do fill, put in those two parameters for the, the almost like function thing, the macro, and then we can send it out. So you can do cool things like that. So if you wanna do a random packet, we can look at this instance. So if you wanna generate a packet of 582 bytes completely random, you can do that. And each time there'll be a random packet generated. So here are the types. So I mentioned that we can do hexadecimal as you saw previously, and we can do ASCII, characters, strings, that would be the ASCII, and binary. So we can go actually down to the bit levels and do binary, which is really cool. So, and we can also do shellcode. So if any people are interested in sending shellcode, you can do that. We just escape it out. So the C preprocessor, so we can actually, uh, Trapdium integrates with the C preprocessor so we can use definitions and things that the C preprocessor can read and replace in the Trapdium configuration file. And it actually includes a file stddef.h which is a header file full of already made, pre-made options and headers to make it easier for you. For example, if you want to use, you want to say in the Ethernet frame, you want to say hey, you know, we have the Destination MAC, source MAC, and then the protocol field, which says what is gonna be above. What is gonna be above this frame? And that is gonna be IP in most cases, right? So there's an option if you don't know what the number is off the top of your head, you can just tell Traefik to put in eth_p_ip and that puts the value that means, hey, there's gonna be IP, and that is 0800 in hex. So this is how we create packets. So basically you have a curly brace, left curly brace, packet data, right curly brace, right? And the packet data goes in between, and for each curly brace that is a packet. If you have a file and you wanna do curly brace, packet data, curly brace, enter, new line, left curly brace, packet data, right curly brace, that's two packets. So between each set of curly braces is a single packet, so you can make multiple packets in a single file. Okay, so again the random data examples and the fill. And if you're good with a scripting language, you can use Python. You can just generate some data, like here Python we use string concatenation and math on using strings and Python basically just multiplies string times 8 and it prints it 8 times. So we can do that and make a packet. And here's the example, the result of that Python, little Python script is this. I removed 6 lines of the packet 'cause I multiplied by 8 and it wouldn't fit on the screen. And then here's the result, so I generated it out with trafgen, I run Nessif-ng, it prints it to the screen. You can see my packet, my packet, my packet under the ASCII decoder. And if you wanna know why it's cut off at the ET in the beginning of the character, it's because my packet is actually where the— is now the values written in the Ethernet fields. Of course that's not decoded, so if you do a hex dump on that you'll find out that, you know, 04 is M, and so on and so forth. Which is kinda nice. So here is a little more advanced example. This is a UDP configuration, so we're gonna make— we're gonna use dynamic elements. Those macros, and we say from the configuration file we can specify the number of CPUs we want to use. I think that's pretty cool. So what we do is we say use CPU 0 through 3, so 4 CPUs, randomize the Ethernet link layer, IPv4 protocol, we want to do a 20-byte random IP header, gonna be invalid most likely, so this is gonna be stuff. And then randomize the UDP header and then randomize 1,472 bytes of payload data. And we send that out and it'll do it. Here's a more complex configuration. This is using the built-in TrapGen-E. If you use this, it's a built-in TCP configuration that you can use and modify. So we fill the MAC address, destination MAC address, with the values eth and a length, which is 6, It's just a macro, or not a macro, it is a definition in the C preprocessor from that file that says this is gonna be 6, so the length of a MAC address is 6 bytes, as most of us know. So put that in there, 6, and then we say we want these 3 bytes of the source MAC, we're gonna randomize the last 3 bytes, and so on and so forth. We specify in binary the IPv4 version, international header length, and type of service, so on and so forth. And we do the TTL type, it's time to live, TCP protocol, hex value 06, the checksum, got a macro for checksums, and so on and so forth. So we get pretty granular, actually very granular, just about as granular as you can get. And then we do some bit shifting for the TCP header. So that's pretty cool. At the end we put an ASCII string in that says "Gotcha!" and that is the packet. Alright, so we can actually take an existing, if you don't wanna write your own stuff, I understand 'cause it's difficult, it takes time. You can take an existing pcap, say you use tcpdump or whatever tool you like to use, you can actually tell NessDiffNG to pipe it to stdout and what NessDiffNG does, it puts it in a Traefgen element. It puts them in the element format, so hex values. You can then take that value, pipe it into Traefgen using stdin, so you say --in space in, which is the common notation for reading from standard in. And then we want to generate 1 million packets from that pcap file. Here's a script I wrote to make it a little bit easier for some traffic configuration. So I wrote a script called genconfig. This is in Bash. And what it does is it has some pre-made configurations. I'm gonna add more as I have time. I currently have UDP syslog messages, so you can do a syslog message. It's predefined, the value. You can modify it, but you'll if you want to like increase the actual message length, like I said, something like TrapGen Stress Tester, if you want to increase that you'd also have to increase the values for the number of bytes in the IP, so it's the header, so it's valid. But it can be done real simply. And then the RFC 2544 article is a document that specifies the It's a performance metric document that is the benchmark methodology for testing network devices. And the frame size in section, I think it's 9.2 or 9.4, is the set that you should use if you're testing Ethernet devices. You want to do performance metric, you should use these frame sizes, basically what it says. I wrote each configuration in UDP for each set, or for each frame size in the entire set. So if you want to generate the entire set out, You just say the bobs. Look at the examples. Jconfig -G, which is going to say your generation type. I want to generate the RFC 2544 frame set. I want to use a source IP address of 1.10, a destination IP address of 20, and a destination port of 123. So NTP in this example. It's going to generate the entire set. So you have the 64-byte, 128, 256, so on and so forth with those values so you can just take Traefik and say read it in, send out your interface to those machines, they hit your machines, you can test it that way. So it makes testing simple. It's a pain making your own configurations from scratch. Another example was I did a beacon frame generator. So this one we use raw802.11. It is a frame that says you can actually specify up to 8 characters of the SSID value and you can tell Traefik to generate a frame with SSID of 8 bytes, and I use the example of free Wi-Fi here, and you pipe it into Traefik and you'll have that. So you can, if you want to do some, send a lot of frames very quickly, you could do that. I imagine Aircrack-ng won't be able to touch this, so that's something you can try. Anyways, next one. So performance test. What could we do? Well, here's an example of how you can conduct a performance test. So we want to create the packet distributions in the RFC 2544 document. There's the sizes. We could then send those sizes to a destination machine. You want to directly connect them. That takes out any middleman like a switch that may drop packets too. So you have the performance from here through the cable to the destination machine. It's the best way to do performance testing because it takes out any problems with middleman devices. And then on the receiving machine I would first verify as I'm generating traffic to see what the performance level is. I use ifpps which is included in NetSniffNG Suite. And we'll talk about that. And that just gives you some byte counts, some performance counts, some system metrics. You know, CPU time and so on and so forth. IRQ settings or values. And then what I would do is if you can script all this, if like you want to do packet capture tests, and that's what this example's for. You wanna test tcpdump versus Gulp versus NetSniffNG versus DaemonLogger. Versus Time Machine and so on and so forth, versus, oh, I forgot to mention, uh, DumpCap and Tshark. So what we do is we would maybe take a script and have it, you know, have this tool TCPdump run 10 times on the destination machine. Traefik sends that traffic, say 15 million frames, you script it so that it kills it after those frames are sent so you can give it a gap of, you know, 15 million frames, um, 64-byte packets would not doesn't take very long, it's probably less than a minute, at least it was on my machine I think. So you can kill it after 2 minutes to give it a gap and then rerun another process. You can do this for all the tools and then have them write to a file and at the end you can use tool like capinfos to read how many packets were written to disk versus how many TrapGen sent. You sent 15 million and you only captured 13 million, you lost 2 million packets. So you can do it kind of like that. And you would wanna test not just disk but you wanna write to memory 'cause disk is very slow unless you have high performance disks or a large array array or something like that. Or you can write to /dev/null too if you don't want to capture packet, the writing mechanisms in the code, in most of the code, and get the disk out of the way, you just write to /dev/null. And then at the end you can use an awk script, I'm working on kind of this whole thing right now, so in the future I'll have it done, it's a lot of work I tell you. But you can use awk to read the values from and then calculate, do some math, average packet loss, the number divided by how many there are, so on and so forth. Okay, so here's an example of full content daily PCAPs. We already have 3 NICs in the system and we wanna send, say we have a span port each on each, in our switches, we wanna send to this interface, to this interface, to this interface. We run 3 instances of Nessus NG and we wanna use a timestamp format. And this kind of, this example is just pretty much here to show you how many options you get with Nessus NG. This uses a lot of them, so we wanna drop our privilege level, we don't want our system, our Nessus NG to run as root in case there's an issue or vulnerability with the BPF filter in the kernel or the application itself or even the dissectors in the application. So that's good practice, we specify the ring sizes and so on and so forth. Hardware considerations, so if you're doing a high-performance packet data or packet capture, there's a lot of things to consider. It's really almost overwhelming. And here are a few. So first of all, we want NAPI drivers. So in the Linux kernel, NAPI— excuse me— is the new application programming interface. So driver code was rewritten at a point after 2.something in the kernel where it's more efficient. Basically, the NAPI drivers now have built-in interrupt throttling and mechanisms, so you're not generating 70,000 interrupts starving your CPU from all the other processes except the capturing process, you know what I mean? 'Cause every time a packet comes in, it used to be it made an interrupt. So if you have 70,000 packets come in, estimation, 70,000 interrupts, CPUs interrupt every single time, you know, that's a problem. So we also have RSS, Receive Side Scaling. This is a mechanism to distribute load from the network card into multiple CPU queues. RPS, this is the software implementation of Receive Side Scaling called Receive Packet Steering. And that is if you do not have a NIC card that is capable of multi-queue, multi-queuing, then you can do it in the Linux kernel by actually— there's a mechanism, or used to be, that packets were buffered in the backlog queue. And in this case we actually don't use that, really don't use it anymore. And if you implement RPS, it actually buffers those packets across the CPUs in each CPU's backlog queue. So you can do that if you don't have a NIC that can support multi— doesn't support multi-queues. So modern, many modern NICs that are in, you know, $400+ range and up is usually support RSS. But if you don't have that, you're on some commodity hardware, then you may want to look at RPS. Queue length is how many packets you can fit in a queue before they start falling off, the buffer overflows. Offloading mechanisms, so you want to, if you can't and your NIC is can perform it. You want to offload checksumming, you want to do UDP segmentation offloading, TCP segmentation offloading if your NIC can handle it, because that takes load off your CPU. A few other things, obviously you want a large amount of RAM, multi-core CPUs, you want to take advantage of hardware locality if you can. If you have— use DMA, many cards now, modern ones will use DMA, Direct Memory Access. Direct cache access, that's like an Intel thing. You can take advantage of caches to take in packets. And if you don't have fast disks, write to a temporary RAM-based filesystem. Or buffer into memory as much as you can and then write to disk later. PCIe bus is pretty much what you need. You don't want anything lower if you're doing high-performance stuff. And here's some more software configurations, or considerations. So use the latest mainline or stable Linux kernel. And that is because if you're using a tool like Nessus NG anyway, you'll have the latest features and you can take advantage of those. And a lot of those, the latest kernels have latest fixes, latest features, latest bug fixes, I guess you could say. And what we'll need to do is tune. So after you have a latest kernel or a recent one, what you wanna do is you wanna tune your system. And that is trying to test, you would use traefik, for example, and just test the number of values, try to find what's optimal for your system. What is optimal for one system may not be optimal for another system. You'll probably find that is the case all the way around. So here I have an example of increasing the socket buffer with rm_max, increase the value. The txq_length, we increase the, that is the queue disk length, in the system. So packets go into queues from the driver into the— or actually if it's transmitting into the queues, into the driver, and so on. But we can increase the queue to 10,000, defaults in many cars to 1,000 packets. We want to set SMP or IRQ affinity. We can bind a specific interrupt to a specific CPU and take advantage of that. Let's say there's a CPU that isn't like— CPU 0 is usually used for a lot of the operating system stuff. So if you can use CPU 8 for your traffic generation stuff and then use the IRQ for that NIC and send a dfinity to that, then that CPU 8 or 10 or whatever it is will take advantage of that and handle all those interrupts and give way to the CPU 0. So it can back off a little bit. We're gonna set the value of the JIT compiler. I told you earlier that NetSFNG automatically does that. This is how you would do it. If you want to do it right now on your laptops, you would just do this value, echo 1 into that value in procfs. And if you wanna do the RAM-based filesystem, then we can, you can use a command like this. This creates a 24GB temporary RAM-based filesystem. If you have the memory, you can do that. I mount it to RAM disk and you can write to that. Okay, let's get on to the next tool. So bpfc, this is a Berkeley Packet Filter compiler. And it supports Linux kernel extensions. This is very cool because Linux has a bunch of extensions that are really not documented. You can't really find them anywhere unless you read some of the code. And they're defined in filter.h, I believe. I don't know if I have that in my footnotes here. No, I don't. Not on that one. But anyways, I think it's filter.h, and if you look in the Linux source tree, there's a bunch of them. And we can take advantage of this. libpcap does not support many of these filters, so we can do things that we couldn't do with the normal BPF. One example is you can filter on CPU. You can filter on your RX hash if you have an RSS system using receive size scaling. Hashes are used to distribute packets based on some tuples. You can actually use the RX hash if you know the value. You could probably, I don't know, but you might be able to get it from etool or even set it by etool for some of the cards. And you can actually filter on that. You can filter on VLANs, you can filter on all kinds of things, which is pretty nice. So you don't get this kind of granular configurability with libpcap. So we can also use This is something interesting, I didn't know this. So there's actually security compilation BPF filters. Google Chrome uses this. I just found out this recently. So you can actually use BPF filters to filter on system calls. Have an application, you don't want, you know, some bad system call that could be bad, you know, vulnerable, blah blah blah, you can actually filter that. And Google Chrome on Linux, of course, only 'cause I think seccilters are only for Linux. And, um, OpenSSH does this, the sshd daemon, that will actually use some of those Linux BPF filters to filter out calls, which is really nice. So you can actually write those call, or you can write those filters from bpfc, which is really cool. Another thing is I found out recently that iptables, you can actually tell iptables to read in a BPF file, and now bpfc, you can use bpfc to create the file and have iptables IPTables write it, or use it. IPTables uses it and then does the things, whatever it does, to filter on the traffic. So here's an example. I have a file called bpfc-arp— take that back. I have a file called arp. I'm going to compile that with bpfc, output it to a file called arp.bpf. I then take netstifng and say, hey, read in file with a -f arp.bpf. The BPF filter is then applied to the socket of netstifng, and then you're filtering by the kernel. So what is this useful for? Well, for one, pedagogy, teaching. If you wanna learn or get good at doing BPF, write it in assembler-like language. That's the way to do it. So also BPF debugging and JIT debugging. So these tools, I should mention again, since they're written by kernel developers, that is their primary concern is using them for debugging and development. So these aid them in in these kind of tasks. And, well, I guess I mentioned the bottom one already is to use it to learn to read, write, and debug. So here's some of the extensions I mentioned. The Linux kernel supports these extensions, so you can take advantage of them. And actually I do have that right, I do have the footnote for this at the bottom, filter.h. This is in the Linux kernel source tree, if you read this file these are defined in there. So these are extra extensions that are not documented that you can use via BPF-C. So we have packet length, prototype, poff, which is the one I mentioned in the beginning, that new one that truncates the payload, just writes the headers, the interface index, netlink attributes, mark, queue, you can pack a queue, you can write CPUs, rxhash, filter, all that. It's pretty cool stuff. So here's an example of a high-level BPF filter using bpfc. So we create a file, just a text file, right? So we say load at the 8th byte offset of the frame and this is the source address. So I'm gonna break from that real quick. At the top we see the libpcap equivalent. So this is how you would do it in libpcap. You wanna filter on the source address. I wanna filter on the Ethernet MAC address, AABBCCDDEEFFF. That's what I would do. This is what you do in, or in bpfc. You would load the value of 8-byte offset. This is loading a word, 4 bytes. What actually do, that will give us CCDDEEFF. So in the next instruction it'll say jump if not equal those values, it'll go to the next line. If it's not equal, it goes to the drop. There's a label there, drop. So at the very bottom, look at the bottom of the example, drop, it says return 0. So that means return nothing. That is, you do not capture the packet. Just, you know, it's gone. So if it does equal CCDDEEFF, then we load a half-word, 2 bytes, at byte offset 6, which is the other AABB part of the frame, source MAC. And then if that does not equal AA, BB, then we go to drop. If it does equal, we go to the next instruction, and the next instruction is return 1514. So that is return a frame size of 1514. That can be whatever you want. So like in TCP/IP, you have the snap length, -s, you wanna write 96 bytes, you can use that. This is the equivalent. So you just say return x number of bytes. You can use -0 if you wanna return the full thing no matter what. That counts jumbo frames, so if you have larger frames than 1514, -0 will count whatever it has in the buffer, it will turn it loose to you and write that. And this is what happens after you compile it. So it becomes assembler-like opcodes, or, well, actually instructions. So what we do is— well, actually, let me go ahead, I got a little ahead of myself. So this is an example of using one of those new kernel extensions. So what have we got? We have this one that filters on CPU. An example of this is receipt size scaling, or, excuse me, receipt packet steering, where in Linux kernel The packets come in on the NIC, they are distributed among different cur— or CPUs, queues, the actual backlogs on the CPU. 10 packets go here, 10 packets go here, 10 packets go here to distribute the load. So one CPU's not handling it all. This is one way you can actually filter for you, I wanna grab all the packets on CPU 0, which is pretty cool. So this is how you can do it. Load the value of CPU, so whatever that turns into sum instruction, so that's behind the scenes that gets translated to sum instruction by the old lex parser.. And we say jump if not equal CPU0. So basically what we're saying is, or jump if equal CPU0. So if it's CPU0, jump to L1, which is return I have -1. And that is return the entire thing. I think that's the same as -0. And then, yeah, that's right. And then L2, if it is not equal, that is jump if not, if it is equal, or not equal to CPU0, then go to L2. Go to the L2 label, that is return 0, that is return nothing.— which is pretty cool. So this is how we compile it, pipe it out to a new file called cpu.vpf, tell diffng to read it in. So some notable examples. So a few things that were actually used from this toolkit in the kernel world is, uh, traphjam was used to find and then produce a bug fix for a UDP fragmentation denial of service attack. You can read about it here, this stuff is very technical. So once it was tested, he created a traffic configuration of the data that would cause the fragmentation and cause the load on the kernel. And that was able to reproduce it, and once they were able to reproduce it, they created a patch to fix that in the kernel. BPF-C was then used to fix a bug in the JIT, in the just-in-time compiler. So Marcus Collars, a kernel dev, and he wrote one where they found an off-by-one bug using BPF-C. In the JIT compile. So if you want more information on that, just follow the links. So these are real-world examples of sfng being used in high-profile cases, at least I would call them anything in the kernel call log, but that's just me. So, alright, so ifpps. So ifpps is a tool that just reads in traffic stats, and what it does is read from procfs, so your proc file system, the Linux kernel stores all its stats, right? All the information, all your network card settings, kernel settings, socket settings, all that stuff. It's good, it's there. An example is if you wanna read from procfs you can use this command right here. So this would actually read your procnetdev file which is where your NIC, or where the network stack stores network information. This gives you your packet incoming count, the RX count, TX count, drop count, so on and so forth. And then we can pipe it out to column -t to make it tap-separated columns, make it look nice. So why did I give that example? Well, what ifpps does, it actually reads from procfs where a lot of the other tools don't. So anything based on libpcap like iptraff or tcpstat, for example, they use libpcap. And because they use libpcap, and libpcap is a higher level, it's a library at a higher level, that introduces more processing time. So the results generally will not be the same as reading directly from the kernel. And if you can read from the kernel directly, why not? If the kernel provides the facilities to read from it, why not use them, right? So an example one of our developers did a test with iptraff which is a common packet analysis tool, it gives you stats, flows. He's, on his system he generated a bunch of traffic. iptraff which is libpcap reported 246,000 packets per second coming in. What the system saw by reading directly from the kernel statistics was 1,378,000 packets per second. That is pretty much line rate. Line rate's 1.4. Yes, that is correct. So the idea, what this shows is that at a higher level this introduces some more latency and more code, right? So if we can get it directly from the kernel, our statistics will be more accurate. Now that is to say, I will make a notion here that for tcpstat, since the kernel does not provide, like netdev does not provide TCP, like this many packets for UDP, this many packets for TCP, you can't do that from there. So if you wanna get that kind of information, that kind of data, then you would use tcpstat which actually can apply the filters and filter on those values. You know, I want this number, count me how many TCP segments are coming right here, you know. We can't do that with this lower level stuff 'cause we're reading from the network card values, the kernel values for this stuff. So, and we can also use ipps to replace vmstat and another, ifstat number tools if you need to. Usually I would have two windows open. I would use vmstat to get system information, interrupts, context switches, kernel load, all that stuff. And then have IPPS in another window. Or not IPPS, I have whatever other tool I was using to read from /proc/netdev. I wrote a script to do it too. But anyways, you can just use IPPS which actually includes pretty much all those values in vmstat and your network statistics. You get it in one window, which is kind of nice. If you wanna do network stuff and you wanna see the load at the same time, who's IPPS or IPPS, so it's pretty cool. And a new feature that was recently added is -P, capital P, that actually shows you the percentage of line rate of traffic hitting your network card. And what it does is it actually goes, reads from the proc filesystem, it finds out what the speed of your NIC is by reading from the class files. So let's say, you know, there's like sys/class/net/ethernet and they're about eth0, eth1, eth2, how many sys are Ethernet cards, and then there's an actual file in there that specifies the speed. Called speed. And you read from that and it gives you the speed. So if you're gigabit internet, it'd be 1,000. If you're 10 gigabits per second, it'd be 10,000. So you read from that and then you do the math from the number coming in per second to show you a percentage of the traffic hitting your machine, which is pretty cool. And that's how I got those values earlier as you saw in my traffic gen test where I said, you know, 64 packets I got, you know, whatever percentage I had on there. Or 1,514 bytes, all the frames that are bytes 1,514, I was hitting 98%. That's where I got those percentages from. And we can also pipe the gnuplot. Use comma or CSV, but actually it is whitespace delimited format, so you can output to a file and then you can read that in. So here's an example of ifpps in a virtual machine, so I don't have many CPUs. This machine's not really doing anything. 360 packets per second, so I didn't have a really good example of all the stuff, but this is basically what it looks like. So you have the CPUs listed, so for every CPU we have a new column. A new line all the way down, you get the drops, the translation from bits to bytes, megabytes, blah blah blah, errors, CPU, context switches, interrupts, all that. So here's an example of the CSV. So if you write to CSV using the -c option, what we can do is write to a file and then parse it in some way. I use awk 'cause I like awk. Awk is awesome. So this is an example. I say awk, we're gonna skip the header, so any line that matches a regular expression, caret, pound, skip the header, and then what we wanna do is print the third column and put packets per second and then the third column from the ifpps.csv file and I print the top 3, 'cause there's a lot. And this just gives you the packets per second for every interval. And by default, ifpps uses a 1-second interval, but you can change it to whatever you want. So for every second, this is how many packets were coming in on my system.. You can do the same and you can do a time conversion because Gawk actually has a string to time function. Awk does not, so you have to use Gawk. And you can actually take that— the timestamp is in Unix Epoch format, right? It's that ugly number that nobody likes. So what we do is we convert that with the string function and then we say I want to find every time— at every time interval in the drop column a value greater than 0. That means we dropped some amount of packets that that were not zero. And I want to find any in the error column, my network card, any number of errors. And then it returns it. So here I found that at this particular time of the day I dropped 900 packets, 100, and there were 3 errors. And with this, because it is whitespace separated even though it says CSV, we can pipe it, we can use gnuplot to read it. So here's an example using gnuplot. So we just graphed a run I did and we're about 650,000 packets per second hitting an interface and at the bottom is the drop count, the little red line. Again, we actually key in on what I just did and you can see just by reading those drop values, we key in on it and we can just see, hey, here about a little less than 40,000 packets at certain intervals, well, were dropped there. So whatever the interval was, we see some loss. We can key on those specific values. Flowtop, Flowtop's the next tool. This is a pretty cool tool. So Flowtop is a connection tracker. And what's neat about Flowtop is it hooks into iptables or actually the netfilter code. So to run it you would enable iptables and if you don't, if you want actually Flowtop to be able to access all the value or all the traffic you say iptables -j allow for everything, you know, allow all UDP, TCP, whatever. So with that, anything that is allowed to pass through the iptables code, the netfilter code, will then— Flowtop will pick up. And it does uip_location as you can see, process_id is for the process that will receive the packet, which is really cool, and the name. So in this example I did a test where I used wget to make a web request to, I imagine it was Google, and looks like an FTP up there too. So anyways, I made a request and it shows you the TCP states, I got established, time wait, so on and so forth. The wget, the wget process, the IPv4, you know, IPv6, whether it was that, and then the geo IP location for each one. So this is cool for incident response. You know, if you're on a machine that's owned and you wanna see what processes are coming, or what packets are coming to what processes, you could use this. Alright, so we're wrapping it up here. So at the end, we have an example of installation. So this is generally how you could do, install, SFNG on an Ubuntu-like system. Ubuntu and Debian are particularly popular systems, so this is an example. So basically you should be able to copy and paste this. There may have been some changes. If not, I have in my references, I documented some stuff. I did some installation docs for this, so you can find those or you can email me. If you need help, or the list. So anyway, so just install all those packages, clone the NetSniffNG from the repository, compile it, and you have it. So a few things in the future. What could be next? Well, there's some really interesting things going on. First, more dissectors. There's talk of a Netlink dissector, so if you're into dissecting the kernel to user space messages that pass for process communication, there's gonna be one of those in the future. Compressed on-the-fly bitmax indexing is something that a lot of people are looking forward to. So I hope that comes out sometime soon. And this allows you to search through large pcaps much quicker. Another thing is the packet fanout. Linux kernel has this new thing called the packet fanout. And that is you can distribute packets among multiple sockets. So this is kinda like what pf_ring does in a sense, except pf_ring is not native, right? It's not included in the Linux kernel source tree, third-party module. I like pfRing, it's really cool. But development— or now the Linux kernel provides facilities to take advantage of this. So NISTFNG, or the developers, they're thinking about finding a way to do multi-threaded packet fanout. So we can take packets and distribute them on multiple sockets so that one does not become overwhelmed and have them all writing to disk or whatever. This will be probably really nice for 10 gigabit per second situations in that probably. And then another thing is optimize performance, so hacking on af_packet, so hacking on the kernel packet facilities to find out ways to optimize. That's something I'm excited about in the future, and performance benchmarks on 10 gigabits per second on modern machines, some beefy machines would be really nice to see what it can do. So there's a few other things up there, don't need to go through all of them. Here's my notes. So a few documents I've written. If you want to find configuration files, you may be able to find— use those Google dorks at the bottom I came up with to maybe find some people— VPF files or Traefgen configuration people have out in their directories on their web interface or whatever. And I have a detailed Traefgen expression language article, so if you want to see a lot of the nuances of Traefgen expressions, go to that link. All right. Any questions? All right. Well, hey, no questions. That's all right. I'm not going to say more than I pass packets, but yes, I do. There's a lot to cover in this presentation. Well, I appreciate it, guys. If you have any questions, feel free to email me or email the list, the Google Groups mailing list. There's always someone ready to respond. And I guess that would be all. You can come talk to me. Thank you, guys. Appreciate it.
More from Jon


What No One Knows the Podcast / Vodcast featuring The Tampa Bay Wave and Jon Schipp

Meeting the Exposure Management Challenge: Key Use Cases for Success | @OfficialRapid7 #SolutionSpotlight

Spot Security Control Gaps and Non-Compliant Resources Across Your Attack Surface






