An Introduction to Traffic Analysis A Pragmatic Approach - Jon Schipp
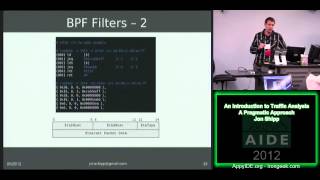
In this 15‑minute presentation Jon Schipp expands on his previous HackerCon talk about packet sensing and provides a practical, hands‑on overview of traffic analysis for small‑to‑medium networks. He begins by explaining why packet capture is essential for troubleshooting, compliance, and intrusion detection, then walks through the various ways to obtain copies of traffic (SPAN/RSPAN, TAPs, IP forwarding, firewall tee/dup2 rules) and the hardware requirements (high‑performance NICs, DMA, NAPI, interrupt mitigation). Schipp details the kernel processing pipeline on BSD (mbuf) and Linux (skbuff), illustrating how packets move from the NIC to user‑space and why packet loss occurs at the NIC, kernel, or BPF/libpcap buffers. He demonstrates how to monitor drop counts using netstat, /proc/net/dev, and ethtool, and introduces lightweight monitoring tools (tcpstat, ifpps, sar) to establish a baseline of packets‑per‑second and interrupt load. For high‑speed capture he reviews shared‑memory solutions (pfRing, netmap) and the NetSniffNG tool, explaining its use of the pf_packet RX ring buffer. The talk then dives into constructing BPF filters, showing the assembler‑like syntax for common filters (ARP, SYN flood, IP options, HTTP GET) and how to compile them with tcpdump –dd. He presents traffic‑generation utilities (iperf, hping, trapgen) and discusses measuring packets‑per‑second limits for various Ethernet frame sizes. Finally, Schipp surveys a suite of analysis tools—ntop, Snort, iftop, tcpflow, tcpick, speedometer, ngrep—highlighting their strengths, typical use‑cases, and practical tips (disable DNS resolution, use shared memory, rotate PCAP files). The talk ends with a brief Q&A and a reminder to capture traffic before incidents occur.
Chapters
Are you not prepared for anything interesting? Alright, let's go ahead. Signal please. Good? Cool. We're ready to get started here. Jon Schipp, first met him at HackerCon 1. He came down and basically VDAV, or BUD/S, and Network King of the Hill. That's how I got to know Jon. Jon did a talk at last year's HackerCon about packet analysis. He's going to expand on that talk today. So, Jon Schipp. Thank you. G'day. Yeah, so like Bill said, I gave a talk at HackerCon last year, and it was on sensing, so we collect all the data on the network and make copies of the packets and forward it to another machine for analysis. And that talk was primarily on the implementation of the sensing system. This time I'm going to go into the userland tools and get anybody that needs to be up to speed, up to par on traffic analysis tools. So it's going to be a quick introduction. We will talk about some advanced topics, or somewhat of advanced topics here too. So you won't be too bored. So I guess we'll get started there. I should point out another thing is I set this up, there's many slides in here, so if you wanted to just cop— since you have copies of the slides, or you can print them off or whatever, you can just take them home and just use the examples in there to get you on your feet. So this is kind of like a tutorial of the entire course in some manner. Okay, so my name is Jon Schipp. I'm a Unix administrator for a small business in southern Indiana.. And I do some PCI compliance. That's my little security things I do. I also run the Linux and— or the Dubois County Linux and Unix User Group. And I do a little security project with some guys called the Southern Indiana Computer Club. And so to get started, why do we capture packets? So one of the things is for detecting network issues in a business or especially if you're messing with firewall rules, it's really important to be able to see responses from servers, such as using Nmap. And sometimes you can't always receive responses because of maybe there's a firewall in front of that firewall. And if we have a system that's set up on the network that can receive packets from all segments or networks in your environment, then you can do— you can have a very comprehensive view of what's flowing through your system. And from here we can use this to detect network issues and to debug tools and code and other things. And the primary concern is usually attack detection. So most of this stuff will be used for intrusion detection. And so one important thing to mention as far as attacks is that you need to have a copy of all the data ex ante. So before an event actually occurs, because it's kind of not very useful if an incident occurs and you don't have the data to report. So it's important to do full content packet capturing, where you take all the packets and you store them someplace. You write them to a disk and load them offsite or have a, you know, some hard drives in your building where you can go back to this data and look through it in case of a potential incident or something that occurred. And that goes back to the next point of record keeping. So we have— we can keep a record of everything that happened on the network. And this is a way to solve some compliance issues with recording emails and stuff like that. If you have the actual conversations, the packets that comprise the emails, and we have all the emails or what have you, whatever else you're using on your systems. And it's kind of fun. I kind of like doing this. It's also— it's pretty interesting. You learn a lot about networks by looking at packets. It's kind of like a pedagogical thing. So it's really helpful in understanding networks. Okay, so we can obtain packets from— in different manners. One is you can run sniffing tools on routers and firewalls and other intermediate devices, or we can use our switches and set Cisco has something that's called SPAN or RSPAN for Rapid Spanning. What we can do is we can copy packets from all the ports on a switch and send them out some other port so copies make it to a system. So we're just making copies, duplicates of the packets to send somewhere else so we have it. And another term for that is port mirroring, which I believe is a non-Cisco term. We also have TAPs. These are just devices specifically for this. You plug a machine in a network into a TAP and the tap would take all the packets and forward it to the machine, and then you'd also have it branched off to your normal network so the packets still route just fine. And if you don't have these devices, you can do some simple stuff with IP forwarding, relaying, and tunneling. So if you have any of your basic utilities like ncat or netcat or socat and so on, you can take packets and forward them to another machine for analysis there and have tcpdump listening for it. And I would— iptables and pf— OpenBSD's pf, which are packet filters, firewalls basically. They have rules you can set to take things that match a firewall rule and forward them to another machine. So you can forward it to your sensor as well as, you know, forward it to the server that the packets need to go to to answer the request from some host. And in OpenBSD, I think it's called dup2 for duplicate to. So you write the rule and you have you know, if this matches, dump to this host, and it sends it to that host. And iptables, the rule's called tee, T-E-E, and it just, I guess it's kind of like the Unix command tee where you pipe standard output and you write to another file. So you can send it that way too. One important thing for this is quality network cards. You need to have a card that can keep up. That's really important. Also, you have to have a computer that can keep up, which is probably more important, but You need to have a decent card. One thing to think about is NAPI. It's basically a new packet processing interface for Linux, and it allows faster processing of packets, which I'll talk about here in the next few slides. Direct memory access is something that's probably necessary if you're taking in a lot of content. So typically what happens is your CPU, after a packet will come and hit your network card, your CPU has to intervene, use cycles to copy it to system memory. And with DMA, it can do that without CPU intervention. So just direct memory access. And I was at Hamvention earlier this month, and I found these Intel Pro MT cards I have listed up there. They're actually really good. And they're, I mean, they can be kind of pricey. I found, you know, two models of the gigabit Pro MT in their quads. They got 4 network ports on there for $20. I was pretty happy with that. So I'm going to stick that in my machine so I can get some more going here. But, uh, when I get a chance. So anyways, this is typically how a frame is processed. So a frame comes into the NIC and then the Ethernet preamble is removed. And then if your NIC network card is set into promiscuous mode, that means it grabs all packets even if they're not destined to your MAC address.. And what actually happens after that, the packets are stored in the local ring— or local buffer, physical RAM on the network card itself. And then they're copied over to your system memory on your operating system. Once it hits your operating system, the NIC generates an interrupt, and then the OS takes the frames, the packets,, and then passes it up and they'll run through your IP modules and your TCP modules and so forth to make it to your user space application. So this is just a little, down below is a little Ethernet header. It shows you just, these just flow into the network card and just keep on going basically, just like that. Here's a more graphical display of a specific vendor's card. Just looking at this kind of gives you an idea of how this works. So if you look at number 1, we can see that there's the network and it says receive. So the frame hits that and goes into the buffer on the NIC, on the right side, or your left, I believe. It says frame, little blue box. And that's the physical memory on the NIC. And it's passed to, using DMA if your card supports it, to the buffer on the operating system. And then above it you see the buffer descriptor. Which is step 3, DMA-BD. So it is Direct Memory Access Buffer Descriptor to the host memory on your operating system. And that actually, that buffer descriptor describes the frame, the packet in memory. Just kind of says this is its address space, here it is, and so on and so forth, the size probably. And then what happens after that, the step 4 at the top, it says notify the driver. So that's where the interrupt is sent. And the operating system takes that into account. In the FreeBSD operating system, this is kind of— this is a quick visualization of how this is usually done. So packets come in at the bottom in the green bar, they hit the kernel driver for the NIC, and then they're copied to the host stack, the network stack, which does the normal processing, which will then deliver to your application that's listening. And then also, if you're using a sniffing application, another pathway is opened up and transferred to that— the big blue box that says BPF. And so the copy— that's where they actually cap— the packet is duplicated to that box and then makes its way to your packet sniffing programs like Wireshark or tcpdump and so on and so forth. And these are just some technical details about processing. We don't really need that. We just need to get an idea of how this works so we can understand things a little bit more, especially when it comes to determining why I'm losing packets. So you can— this isn't really that important. You can go through it later. So here is a— in FreeBSD we use what's called an mbuf. It's a memory buffer. It's just a way to store data. And if we look at the top one, it says mbuf usage. It says, um, we use netstat -m to list the amount of mbufs. And your system will preallocate a number of mbufs at all times, so packets when they come in, they're already stored, they'll be copied to these allocated memory buffers. That's just where your packets are stored. And then below you can see where it says man mbuf, the total size of mbuf, and msize. So I'm looking at a kernel source here.. And it defines M_SIZE as 256 bytes. So if you have a packet that gets larger than 256 bytes, you need to ask, well, what's going to happen? Because we do have packets— if you're copying an image on the network, it's going to be larger than 256 bytes. So if you look down at my little picture at the bottom right, it's from Richard Stevens' book on TCP/IP, you can see that we have a few different end buffers. 3, actually. Multiple mbufs and put them together, and that's called an mbuf chain. It's a chain of mbufs. They just link them to each other, and then the header— packet headers could be stored in one, and the data in the next two, for instance. Below that is— we use sysctl to just find out what is called an mbuf cluster, which is basically if you have jumbo frames or packets that are very large, higher than, you know, larger than the 1514— make our bytes allowed for a standard frame, you can copy— they'll need to be copied into a cluster. It's just basically a different pool of memory to store them. And we can see that the limit is below in the bottom picture, that size, and I did a rectangle on it so you can see. 2048, so that's how many bytes that can hold, and you can chain those together too if you have large packets like jumbo frames and super jumbo frames. In Linux, it's a little different. We don't use BPF, that's strictly a BSD thing. We actually use LSF, which is the Linux socket filter. And so you can see how it's quite— I mean, in concept it's quite similar. We are taking packets and we're copying them to the host stack, and then we're also making a copy for the sniffing program on the other side. Just making copies is kind of the idea we're trying to understand here. And here we can take a look at some details which aren't really important right now. And Linux, we talked, we showed a picture of what Sbuf, or excuse me, Mbufs look like. Linux has what they call the SKbufs, they're kernel structure buffers, and that's just the same concept. You can see on the one on the left that it shows the packet and then it shows the headers and where the bits would be filled out. Okay, so the problem is we have to keep up with all the traffic if we're handling a lot. And on systems that don't have NAPI, older systems, you'll need to use a method called device polling. And one of the problems is if every time a packet comes into your NIC, an interrupt has to be generated, and if thousands of packets are coming in per second, thousands of interrupts have to be generated. And this stars your user space applications or programs from even being able to access the CPU time. Because it'll just be spending so much time trying to tackle all the packets coming in, and your user space applications, such as Wireshark, will not be able to actually have time to read and analyze the packets. And this is real— will come up with drops. It'll drop tons of packets. So device polling is a mechanism where instead of every package entering an interrupt, your system will poll— it'll ask the device if it has packets. And you can set some cycles I think usually it's around 100 Hz. Every 100 Hz your machine will ask the network card if it has some packets. And this is a way to reduce the amount of interrupts and be able to capture more. But NAPI has this built in, this new application programming framework for network cards. And in it is interrupt mitigation built in and packet throttling. So with the— we just talked about having too many interrupts generated from so many packets coming in, which will generate an interrupt, what they call an interrupt storm. And when it comes to— there's another idea of packet throttling where if so many packets are coming in, the NIC keeps trying to take it even though it can't handle what's up in the system already. So we throttle the packets. We just start saying, hey NIC, don't accept any more packets. And it'll just start dropping them until it can actually handle some more. So that's a built-in mechanism to help alleviate the pain from these things. One thing that's really important is userspace applications need to have something to keep up with heavy data nowadays is shared memory. And these are just kind of similar ideas that all refer to the same thing. So one thing is every time a packet comes in, it has to go through the kernel and make it to userspace for your application to run, user memory, right? So every time this happens, a context switch, a switch from kernel space to user space and vice versa, user space to kernel space, has to happen. And these, these take up valuable time. So with the shared memory approach, we map the same address space in the kernel and the user space so we can access the same memory, and they can both reach from that same pool without having to do all these extra context switches. And there's two systems that are pretty popular for doing high-speed packet capture, which you'll probably need if you're handling things above 100 megabit line rate, and that is pfRing and netmap. Now I talked about pfRing in detail in my HackerCon talk, so you can check that out, but this talk is not focused on that, it's focused on the tools. But it's a system that does all the shared memory stuff for you. Okay, and you have to insert a kernel module as well so that you can take advantage of it, or recompile your kernel. Or whichever. So a few things. These mechanisms for capturing these packets, we talked about Berkeley Packet Filter and then the Linux socket filter. So there's two ways of getting the packets, getting copies of the packets. We mentioned pfRing. And a little history here, if you go down to the bottom where it says others, CSPF, I believe that was the first filtering system, or the packet capturing system created a Cambridge Stanford— well, it stands for Cambridge Stanford Packet Filter. So the problem with that one though, and the reason BPF came about, was that it actually filtered packets in user space. The packets have to make it through the kernel and then they're in user space, and then from user space they're filtered. Which rather nowadays they save CPU time by filtering directly in the kernel so you don't have to have the extra processing actually copied into userspace. Okay, everybody, most of the InfoSec guys are familiar with tcpdump and Wireshark and libpcap. So libpcap is the C library that allows us to have a link layer access to most of the packets. And most tools, if not just about all the packet sniffing tools, use libpcap. And when you install those tools, it will be installed. They're easy on Linux, it's already there. And same with BSD. So you just install your applications, your applications will interface with that library to get a copy of the packets. Here's some simple tests I did using tcpdump, and I used iperf to generate 6 million packets in 60 seconds. And I used a Dell PowerEdge machine, quad-core and 4 gigabytes of RAM. And I used FreeBSD and Linux, and here's a simple test. I was able to show it in my test, however this might— this will be different for every system, so this isn't conclusive, but in my tests FreeBSD outperformed Linux without any— with just normal packet capturing without any shared memory system. So I first— I see at the second line from the top down Linux dropped 8% of all packets when writing only 96 bytes to disk. They both dropped zero when piping output to /dev/null, which means that the hard disk wasn't used, so we were just writing them to the bit bucket, so we weren't actually using space. They can tell us that there's a bottleneck on the hardware, on the hard drive, or any of the disks. So that's important too. You should get fast RPM drives or SSD, but that's probably not good now for copying lots of packets because it takes a lot of disk space. And then if we use larger sizes, we can see that Linux dropped 22% in one of those., and when using the large sizes and piping to /dev/null, Linux dropped 0.02% and FreeBSD did just fine. Okay, so libpcap_buffer, so there's a buffer in libpcap, we saw it whenever we looked at the graph on that one side where packets get copied to, there's a buffer in there in the user space that libpcap creates, and it's initialized on FreeBSD to 32 kilobytes, and there's a little C code, line right there that says if it's greater than— if your system's BPF set into my sysctl variable is greater than 32 kilobytes, then set it to that value. But if it's not set greater than 32, which is set by default, then it's going to set it to 32 kilobytes. So you may have to increase the buffer size. On the very bottom line, we use -B512. I just gave an example where I've increased the buffer size so I can handle more packets and users space. So dropping packets, let's see here. This is on FreeBSD, so we can use netstat to get the drop count that— those are the packets that cannot fit into memory anymore. And I— on the top one where it says ipackets, I dropped 427,000, which is not a good number. Or excuse me, that was the input packets, sorry, that's the number I got in. I dropped 0 there. And that was just fine. And then below we can see the BPF. So BPF has its own mechanism for reporting loss. And in this case, using netstat -B for BPF on FreeBSD, we can see what applications dropped from the BPF buffer. And I dropped 537 here with tcpdump just to show you. And it shows that tcpdump is listening with the command, and it shows below that ntop is listening. Listening. And top didn't drop any though. And then below that we can actually query the drivers and get the actual drops from the drivers. So we have 3 different things, different ways that we can see drop counts. Whether the drops are higher in user space, whether it's in the NIC itself, or if your NIC supports the recording of that, or, which many of them don't as far as I know. And then, or we can see that in your system memory of the operating system, we can drop packets there. So those are 3 things you have to consider when dropping packets. Where are they being dropped? And we use these numbers to try to get an idea. Okay, so in Linux, we use the drop count for the system, Linux operating system, are pulled from /proc/netdev, which is the proc file system which stores all the kernel information, running system information. I'm just using awk to print the first and fifth fields. And we see that eth0 dropped quite a bit. 4 million roughly there in this example. And then we can go down to the bottom picture which is ifconfig. And here it reflects the same value. So we can see, and then I put the little code snippet off to the side where it shows that that's from Netstat code. It looks like it gets the values from /proc/netdev. So it'll report the same thing. That's where Netstat pulls its its value. And if you want to get some— if your NIC supports it, you can use ethtool to request the drop count from a network card, if it supports it. Many of them don't, as far as I know. Mine doesn't, unfortunately, so I didn't have a picture of it. Okay, so here's an important thing to take care of, or to mention, is tcpdump and libpcap drops. So whenever you run tcpdump, or most of your tools, they'll report the number of packets captured packets received by the filter and the packets dropped by the kernel. And actually, when they say dropped by kernel, it's actually using the Linux socket filters pf_packet_stats. It's just a variable that stores the number of packets that is dropped by pf_packet socket, which is what's set up with libpcap to listen for packets. So we have to understand that that's what it is. Dropped by kernel does not mean your NIC's dropping them. Just means that packets are being dropped from the count in BPF's, uh, or libpcap's pf packets packet statistics. And one thing I noticed was kind of funny was I've never seen this on any other system, but on Ubuntu, they have, they report a different line. At the very bottom of the screen, the last line, it says dropped by interface. I haven't seen this on any of the Linux distros that I've encountered, but Ubuntu reports this. So they actually patched or sent an addendum to the code that reports the drop by interface and which actually pulls it from /proc/netdev. So this report, this number will be the value of what netstat reports. So it's the same thing. You can compare and you'll see the numbers will all be the same. And remember, you can recall that netstat reported from /proc/netdev, a file that just keeps a counter of all the packets. It has a number in it for the drop field. And so we can see that it pulls from there. Okay, here we're going to start getting into tools now. Okay, so we got covered a little theory. So one thing to point out, we need to understand where our network is at and how to measure data coming into our network and the amount of packets we can receive. And here are a few tools we can do that with. There's many others. I talked about 3. TCPstat, IPPS, which is kind of a new tool from the NetSniffNG suite. It's a new collection of tools that I really like a lot. And there's atsar or SAR. System Activity Report. It's a tool that comes with a lot of the Linux distributions. And the cool thing about SAR would be that it runs as a cron job, and so it actually takes— it polls the systems, all the stats it has, which is a lot, not just network stats, I mean CPU memory, and writes to a file so that you can go back and see how your systems have done previously. If you had a hiccup last night at the server room, you can go back on that system and see, looking at that little files and looking to see what happened. My CPU spiked at this time, this period of time and stuff like that. You can further determine maybe an application caused this or something else. TCPstat, here's an example. So I'm using screen right here. I have it on 4 different interfaces at the moment. Here at the top we just have a long string. The -o is output and we're looking for, we're printing the time in Unix Epoch or since Unix Epoch, and they're picking packet count and packets per second and then network load. And then you can see here, if you look at PPS on the first box at the top, it shows that I'm— at this point in time, I am— I have 55,000 packets coming in per second. So you can see how your systems handle the load. You can look at the load, which is the next column over, and see at what rate that jumps up with how how many packets are coming in just to get an idea of how you're doing. Um, ifpps is kind of cool. This, um, to get its data, it actually pulls the proc filesystem, so it pulls the kernel directly. And since we know that drop counts can be reported from proc/netdev from the system Linux, um, we can use— ifpps pulls that data from proc/netdev. I have it listed up there. And I pointed to the values that it's pulling. So here where it says the drop count, it's getting that value from procnetdev, which would also show into Netstat. And you can see this is interactive. This is, uh, T is per unit of time because it says drop/T. So a unit of time by default is 1 second. So every second it prints out the value that it pulled from those files. And this is important. Another thing that's important too is at the bottom I have software interrupts. We talked about interrupt loads— or interrupt storms, excuse me— and how many— how you can flood your system with interrupts and starve the application listening in user space. Well, here you can watch the amount of interrupts for receiving packets. And it's called— I have it listed, I wrote down— current RX software interrupts. And I have the highest one I have on there at that second, that sampling second, is 3,357. And usually you know you have a problem if you get Probably 10,000, maybe even a little less than that. Usually that's a problem where you need to take a look and see what— I mean, I might need a new system. I might need to do some mitigation of interrupts with shared memory or something like that. And right now I'm not using PFRing in its fastest mode. Now I usually get all these packets just fine whenever I up my card to transparent mode 2 with PFRing, but here I just wanted to show you examples of drops and what they look like. So here's SAR. This is probably hard to see. You can use SAR using the -L, capital L. I pull for 5-second samples and 5 of them each, 5 samples of 5 seconds each, and I highlight the numbers, the drop count for the interface, and it shows you. And you can go back using SAR since it writes to a binary file by cron all day and all night long. You can see what period of time that this I had a jump in Network Traffic. I had a spike at midnight. What is that? Where did that come from? Why is that there? So, something important. You can also use many other options in SAR to get just about any statistic you want from your system. It's very versatile. So, we can also use— this is something that I haven't really had a chance to deal with because I'm not very good with gnuplot, but I took these two. These are from the TCPstat guys. They have two example graphs on their website, which I listed, if you can see at the bottom the URLs there. So you can take these outputs from ifpps. They have a CSV. You can copy it to a CSV file and then run analysis on it. So you can pipe it through gnuplot to generate these pretty reports. And you can also do this with tcpstat. You can probably do it with SAR too if you just use a— pipe the standard out right to a file and you maybe use some sed, noc, grep to get the variables you want. And you can use gnuplot to print pretty things, which is which is helpful for visualizing your data. Stress testing. So another important thing is— so we got a baseline now. We at least understand where we're at in our network with these reporting tools and spent some time looking at them. We need to test what our network is capable of handling. And I guess the good question is, if you have gigabit, can you write 1 gigabit line rate to disk, which is kind of a task. It's not too feasible depending on your systems. You'll need probably PFring or NetMap or some of those high-performance shared memory systems. HPing is a tool that most of the InfoSec guys probably know. It's a packet crafting tool, so we generate packets to get responses from hosts and we can determine more information about them. We use that in this flood mode here in a second. TrapGen is a part of the NetSniffNG suite. It's a new tool that's high-performance, zero-copying of data, so you'll get probably one of the really good speeds without using like a kernel generator like PacketGen from Linux. I think it's a module you can generate, you can put it in your kernel and generate packets at the kernel level, so it's much faster. But Traefik is very quick. And then iperf, which is the one I used in my test earlier. OK, so one thing to take into consideration is packets per second. So this is a good measurement of determining how many packets your system can handle. Mostly people just think about, oh, I can handle this many packets, the number of coming in. The total at a period of time, not how many per second. Now, another thing to considerate— or to be considerate of is the fact that a lot of people put emphasis on bits per second and bytes, but the real important thing for processing packets is how many packets can my system handle. So PPS, or I think it's used interchangeably with FPS, which is frames per second. Now here we can take a look in just a little graph of How many packets per second for what type of Ethernet speed. So at a gigabit, the black line, we can see it's anywhere between 100,000, a little above there, to 1.4 million packets per second. We'll show a better number of that here in a second. And that is determined on the size. If you have a frame, the lowest amount of the size of a frame that can be possibly sent on your network and the largest size, you'll have different packets per second that your machine will be able to handle with those sizes. And we'll talk about those in a little bit. This is a nice, very, very nice visualization of gigabit line— or the gigabit frame and all the information on how many units of data, the octets, and the packets per second that generate for the size of the frame. This is— you can get this graph off of the Network Security Toolkit, which is a nice network monitoring system. You can just download it. ISO, burn it, plug it in, copy it to a machine. You can— just like Doug Burk's Security Onion, which is also very good. These are systems that are— they are already built for you. You don't have to do it. You can just download the ISO and copy it to a machine and run the operating system. It does all this stuff for you. So those are some things to look at. Security Onion and the Network Security Toolkit. So here, I got this from the Network Security Toolkit's website. And they have this nice chart. If you look down at the bottom, I'm not sure if it's easy to see, but there's an option on the left-hand side, your left, that says max frame rate. And we can see that for gigabit it's 1.4 million frames per second, or packets per second. Most people use these interchangeably. So a system at the size of 84 bytes frame, 84-byte frames is the minimum size. Now you might say, oh, I thought a frame was 14 bytes plus the the 20 bytes for the IP header and then 8 for UDP, for instance. And that's not 84. But what we're forgetting is, if you look at the diagram on your right, it shows that we're forgetting the MAC preamble, the frame checksum sequence, and the start frame delimiter. So these extra fields that your network card strips off, but they're not copied to your operating system, but those are still counted as times, bit times that come across the network. So you've got to count those too. And here Hping I'm using at the top. I'm using Hping to basically flood a bunch of packets. I'm sending a bunch of them right here. I think the number is about 4 million, roughly 4 million to a machine. At the bottom I'm running— this is actually this little laptop I believe when I did these tests. I show the picture below that. I used TCPstat to get the— to get how many packets I'm sending from the sender. And it shows I'm sending about 57,000. At the high point it was 74,000 roughly. And below that I use ifpps, the other tool I demonstrated. And here at this point in time that I measured, I got 103,000, which is not, not too bad for this little guy. Hping3 again. Here we start a UDP flood, except we're gonna— we want to make a bigger packet, so we're going to use the -e option. To say send the data from a file. And if you look at the bottom, put a square around it, it says howdy packets, packets, packets, mm. I mean, so we're basically copying that flat text file and we're saying with the D option, does data, to capture 44 bytes, which is the size of the text file. So just capture, or take all the, excuse me, take all the bytes from that text file and forward it across the network so the packets are larger. So this is a way if you want to create larger frames, you can just make a text file, copy a JPEG or something you can just send it. Uh, Traefgen, this is part of the NetSniffNG toolkit. This is a really nice toolkit and it's fairly new, like I said, so I suggest everybody interested in this thing check it out. I really like it. So it's a zero-copy traffic generator. It uses that shared memory technique. Maps kernel memory and user space to the same address, and we can use that to reduce context switches. So it uses a pfpackets TX ring buffer. As far as I know, it's the only at least at the time of the writing that I read, this was the only one that uses the pfpackets Extended TX Ring Buffer, which is just a faster way of storing packets in a buffer. And we can see here, let's see here, this one was on— I was able to get with my other laptop, this one's pretty poor performance, this network I'm using right here on the network, I was able to get 100 megabit line rate with TrapGen with another machine I have, just with a laptop. So it outperformed HPing, which would only do about half that. Something to take into consideration. One problem with, uh, Traefik Gen is you have to generate these config files. It's not real easy to create packets. So what I actually had to do was I had to use HPing to generate a packet. I would create a UDP packet and I just picked a port and I sent it to a machine. I actually had to use tcpdump at the bottom and capture that packet and then copy the hex values. Now I mean, that's kind of tedious, especially if you want to create many different examples, and then you put those into TrapGen and you say, here's my configuration file with these hex values, and you forward it out. Now on the— I wrote all those hex values, I put a nice little format, I was going to see if they would include it, but it turns out they actually just developed a better way to do this. But we'll get to that in just a second. So here, here's a way that you would use this complementary tool NetSniffNG, so you capture the packet you want with tcpdump. And here I set my filter. I look for only packets addressed to 1.3 and a destination port of 80. I write one of those to disk. When I generate the— we use hping to generate that packet and capture it. And then I take NetSniffNG and use that packet capture, pcap, and use that as input. So I write NetSniffNG --in packet the packet file and --out and I can specify a .txf file which is the TrapGen configuration file. And that will actually take that and convert it to the TrapGen format. So all you have to do is capture one packet or a bunch of packets really and then you can just use TrapGen, load it in there and send them out. Here I use TrapGen to generate a bunch of packets here. I can see, you can see that I have a the --comp, so I'm suggesting a configuration file, and I'm binding. One cool thing about Traefik is you can bind to a specific CPU. So you have multiple cores, you can bind to a specific one, maybe one that's not being used by your instance of Snort or Suricata or something. So you can be, uh, it's pretty liberal in its ability to do things. You can also set the size of the TX ring buffer, and then you specify, like here I set 1 million frames, and I used tcpdump, excuse me, not tcpdump, I use TCPstat at the bottom, a tool we talked about where we can determine some basic information. I boxed it and it says packets per second so we can see the values. And I use another tool called, with a little bar graph, which is really nice. I'll talk about that at the end. Easy visualization of the amount of traffic coming into your system. All right, so capturing. So like I said before, it's important to have packets before, or all the data on your network before an incident occurs. We need to store these things.. And we're going to need some tools to do that. If you have— if you're on big networks, tcpdump by itself probably won't be able to do it. NetSniffNG by itself will probably do better than tcpdump, but it probably won't be able to do it if you're using gigabit and stuff like that. So you'll need to invest in time to install pfRing or NetMap or some high-performance commercial system. But you can— most of this can be done with open-source software. So we need to collect the data, we need to write to disk. So one thing about collecting the data is we need to understand BPF filters. I really won't get into this, but these are some examples of basic filters. So we can filter on hosts, ports, protocols, and entire networks. So we can say this tcpdump capture all packets that are on network 192.168.1.whatever. And we can do this and capture all those. So we can do source net, destination net. That's just a lot of ways to capture the packets. And on this one side, which is advanced filters, we can capture on specific bits and nibbles and stuff like that. These are more advanced. We won't really get into these. But one really important thing to talk about is how these filters are constructed. So we're going to do like a little pseudo-assembler here. So BPF uses an assembler-like language to create the filters and compile them and stick them in the socket filters, like the netsocketfilter or whatever, to do the filtering. And if you use tcpdump -d, you can dump the assembly language of, or the assembly-like language of the filters. And here, this example, I use -d arp, so what I'm doing is I'm capturing all arp packets. So if we look at the first instruction, 000, and it says LDH, so we're loading a half-word word into the 12th byte offset of the beginning of the Ethernet frame. Which happens to be, if you look at the bottom, the picture of the Ethernet header I have at the bottom, you look at the number 12, that begins at the EtherType field. And the EtherType field specifies what comes above. So it's going to say ARP is going to come above. So the next instruction, 001, jump equal, or just equal, it says if the value that was loaded in that, from the 12th byte, if the ethertype field is equal to 0x806, then jump to instruction 2. And then if it jumps to instruction 2, we return 65,535 bytes, which is the maximum you can capture. And that's just with— I set tcpdump as -s0 for the snap length, which lets you capture everything. It's infinite. So anyways, if it's false, if that if the eth_type variable does not equal, or the value in that field does not equal 806, then you return, you're gonna jump instruction 3, which is the last one in that area, and it says return 0, which means you don't capture anything. That's how it matches these things. We got 2 more examples. And this is important to do because if you're, you'll find out that some instructions, what you think, or some filters you set up on the command line, you think will work might not work, especially when you do VLANs and stuff like that. It's important to understand the ordering. Just gives you an idea of how to get this or accomplish this. So here, this example, we're using a snap length of 1514, so the standard Ethernet frame size, MTU. And I use a source address. My filter is ether source, look for this MAC address and only capture packets that match this MAC address. This one's a little more complicated. So we load LD in this instance means load a 32-bit word, so 4 bytes, and if you can remember that a MAC address is 6 bytes, so the maximum value we can load is 4 bytes. So we actually have to do this in 2 steps. We load 4 bytes, which if you look at the next instruction, it says JEEK, so jump equal. So if we have CCDDEEFF, so it matches— if you go down the header, you see where the number 6 is, 2 over would be 8, so we match those 4 bytes first. And if those 4 bytes exist in that EtherSource field, then we jump to the next instruction, number 2, and then we load the value at 6. And 6 is the beginning of the Ethernet source frame, which is the other 2 bytes, which is AA and BB, because I set the MAC address to filter for AA, BB, CC, DD, EE, FF. So that's kind of how that's built. And then you can see that the snap length, since I set it in this example to, you know, the top, you look at tcpdump -s 1514, if you look at the jump true to instruction 4, where it says return 1514, that's where it gets that value. It returns only 1514 bytes. So if you only want to capture 96 bytes, which is typically the default, it would only return 96. It cuts off, it truncates the rest, it doesn't need it. OK, this is a little more, this one's kind of, this took me a little bit to work out, but, so this one's 574, I have to write notes on this. I won't remember. So 574 bytes we're going to capture for the snap length. And here we're setting— look for IPv4, so just IP. If it was IPv6, you have to specify IPv6. But we're looking for only 4 and UDP destination port 53. So in this one, we look at the 12th byte, which is the EtherType again, and we And 800 equals IP. It means IP's going to be carried there. So that means if IP is in that field, then we can go on to the next instruction. And the next instruction, we load a single byte from offset 23. So we take Ethernet frame, jump over 23 bytes, which passes the Ethernet frame and actually gets into the IP header. And so whatever that number is over, it actually represents the field, the protocol field in the IP header. The protocol field in the IP header is a value that's set sets the upper layer protocol. So it would be 11 if it's UDP and 17 if it's TCP. It says I carry this number. This is how the system knows to take it up to the next input module in the operating system. So, and we see it do an equals, a jump equals. If it's 11, the value is 11, which is the value of UDP, then we can continue. And then we jump to the next instruction, number 4. And here again we load a half word. And here's where it gets kind of tricky. So this half word is from the IP ID field. And what this is doing is checking for fragmentation. Because if you can recall from the InfoSec guys that whenever, you know, if you're trying to defeat or bypass or evade an intrusion detection system, many of our older ones are more vulnerable to fragmentation attacks. I'm sure some still are. So the IP ID field, the val— if packets are chopped into fragments, the IP ID field would have the same value for each fragment. So that whenever the receiving machine gets it, it knows that these all belong to one big thing, puts them together, right? One big pack. So what we're actually doing is we're checking for the fragments, and if we don't want the fragments, because if we have fragments, that's going to cause a miscalculation in where the UDP port's going to be, because it's going to be different. Yes? Does that hold true on IPv6 as well? Did you experiment with that? No, I haven't even looked at that yet. I'm behind on that. That's something I need to get into. I think we all are. Me too. Yeah, everybody. Most people anyway. But yeah, that's definitely something to look into, yep. But so we check for the fragments, and if there's no fragments, then we can go to the next instruction. The next instruction is a bitwise AND of that half word, which does the— which basically does a calculation that says if the fragments are here or they're not. And we'll go on to the next one. Sorry, I skipped that step. Okay, so we're at 006 now, which is— what we do is we calculate the IP header length. And this little equation, you can see the 4 multiplied by these in the parentheses. What we actually do is we load the 14th byte off of the frame and do a bitwise AND with the hexadecimal F, which is 15. And we do this because this is actually the header length field, and it's actually 1 byte, and it's separated by— so there's 2 nibbles. The first one represents IPv4, there's a value of 4 in there, and the second nibble will be the size of the entire header— or excuse me, the entire packet, the entire header length. And that value is what we're looking for, so that's why we're only doing a bitwise AND to that 15 because we don't need the whole 256, we just want half that. So bit values, possible combinations. We just want that 15, excuse me, 16, 0 through 15. We just want that. So if we do, that's why we do that bitwise AND on there. And since the normal IP size without, or the minimum size is 20 bytes without IP options. And IP options are record routes, loose source record routes, Strict Source Record Routes and timestamps. So if any of that stuff is showing up, which makes the IP packet longer, we don't want it because it's going to screw up our calculation. That means the HTTP— or UDP, excuse me, the UDP port 53 is going to be that much farther down the road, and we have a filter set for a specific thing. So we get those values and we multiply it by 4, and 5 times 4 is 20. So that means that the— if you do the bitwise AND, like I talked about, against the value in the 14, 16, you'll get 5. And 5 times 4 is 20 bytes, so that means there's 20 bytes there. OK, and then we take that 20 bytes plus 16 in the next instruction. It says x plus 16, so this x loads the value— or has the value in the— it loads that 5 from the index register. And so we then have that— the offset of that plus the 16 is actually from the beginning of the frame actually ends up being the UDP port 53, which is hexadecimal 35. I mean, all this stuff is kind of complicated, but once you kind of get this in your mind, it's easier to create filters. But that's enough of that. I think. Alright, so here we're going to do TCPdump examples actually using the filters that we were looking at the last couple of weeks. So we're going to use, we're going to capture SYNs here, or any SYN bit set and anything else. So we can see that if you look at the top where it's in red, over where we have -c3, we capture 3 bytes, or excuse me, 3 packets, and I have TCP in the 13th, the brackets, the 13th byte offset of the TCP header happens to be the TCP flags field. And we do a binary AND on the, on the the 2, which is the SYN bit. And if that value equals 2, then it'll capture anything that has the SYN bit set and anything else. So we would do equals 2 without the AND 2 if we just wanted the SYN bit. If you were detecting a SYN flood, for instance, you could use that field to see, you know, tons of SYN packets, you know, being flooded across the screen. You can see maybe that we're under attack. We can— if you look at the very bottom, I did also the BPF filter dump of that. And I highlighted the 2 in red. It says AND 0x2, which is the hex value 2. So we do an AND on that value. So whatever that value is that was in that 13th byte offset field of the TCP header, if it's 2 and anything else, it would always be an equal to 2. So anything could be that— you can have all the flags set in that byte and it would still return true. So you'd still bring about all the packets that you want. So it captures the SYN plus anything. Okay, so IP options, which we— this is something that we're going to use an example for. Record route. So some people— I'm not really sure how often this is used anymore, but most firewalls drop packets that have record route IP options in them. And what they do, people, attackers will use the record route, strict source record route, to try to bypass certain routers to enter our network from a different direction than would otherwise have been entered. So they kind of just predetermined their own destination. So you'd map the network out and then you specify each hop that you want it to go to. But most firewalls and routers nowadays drop those by default. But here is an example of us using that. We're using the ping program to generate a simple record route. This is not a strict source, not a loose source, just a regular record route. Let's use the -r. And specify one machine. I'm just going to go to my router and then back. Because the original route counts each hop and then even back. But you have a limit on the size of the IP datagram, so you can only get about 9 IPs in there. So we just send one of those out. I use my filter in tcpdump at the bottom. IP, I look for the first, the zeroth byte of the IP header, so the first one basically. And here we do a binary AND on that to determine the size. If you recall from that one long example— the VPF filters— that, that 0-byte was the byte that determined the header length. So if you're going to use an IP option, the header length is going to be longer. So that's how we determine whether the header length is going to be above 5. And we take 5 times 4 for bytes, and that equals 20. So anything above 20 bytes has an IP option set. That's why I use that greater than sign. And this will determine whether we have a record route. And we can look at the example. I highlighted it at the bottom. Says options RR and it goes to the next line and it just shows the routes or the packet or the hops traversed from— for every machine that the record route packet hit. They actually record their address inside the packet and send it back. So it shows my machine in there, 192.168.1.1 and so on and so forth. So, and the rest are zeroed out because we don't have any other in there, any others in there. Okay, here's a cool thing. This is tedious. There's better tools for this, which I'll get into, but you can do user application layer data with tcpdump. Here I'm actually capturing an HTTP GET method. So we're looking for that GET. So every time you go to use your web browser and you go to google.com, above all the protocol stuff, you're sending an application layer data that actually says, has the values GET in it, in ASCII, G-E-T. And it gets the google.com and returns the webpage to you. So this is how you can copy or get a copy of all people's web requests, all their websites they've visited that used the GET method. But if they used POST or what have you, they'll be a little different. You have to use a different filter. But here, we just look up at the top. I'm actually using a 32— the 32nd byte offset of the frame. And then we do the colon 4 means measure 4 bytes because GET is 4 bytes, 3 bytes, 1 byte for G, 1 byte for E, 1 byte for T, and then the space that separates it from the URL or the next parameter or whatever, the protocol. We use 4 bytes. So I have the hex values up there. It says equals 0x and then 47455420. If you look at the bottom, I use printf and I print those values out and tie it up to hexdump, and it actually shows you that those values equals capital G, capital E, capital T, and then I put a space right there. I put a newline character in there so you could see the space represented, the blank space in between there. Alright, so NetSniffNG. So here's our high-performance packet capturing tool that you can just download and use. It is included in Security Onion, but they have an older version. I talked to Doug, he was going to update it because the version they have is missing some features, such as writing pcap files to disk, which is really unfortunate. So that's something to take into mind, into consideration. You might want to go ahead and download it and compile the code and then just see if you have the full functional latest from the GitHub version. So one thing is this uses pfpackets rx_ring_buffer. So we talked about in the OS we have pfpacket, the socket system, and this uses a new, a recent feature called the rx_ring. It's a high-performance ring buffer. Kernel space and the user space are addressed so we can reference them from the same address space instead of doing all those context switches. We can reduce the amount of the context switches by doing shared memory and memory-mapped applications. So one thing to take into consideration is basically what I do, which I feel is good until someone tells me it's not good, but I write all packets to disk. And then, like I said before, it's important to have all this data ex ante, before an incident occurs, and then we can analyze them later with other tools. So you can have NetSniffNG set up to do, create new pcaps over time. There's an option here, which I'll get to in just a second. But one thing to mention, there is a fault, a disadvantage in NetSniffNG right now is is that writing BPF filters for it is tedious. Since it doesn't use libpcap library, it doesn't use that full-fledged BPF filter, the compiler, it actually— they have their own system called bpfc, but they're going to redevelop it. I talked to one of the guys that are working on it, so— but it's a part-time project. So something to take into consideration. BPF filters, you have to actually use tcpdump and you dump the assembler-like pseudocode— or excuse me, the opcodes, the assembler-like opcodes for it into a file, and then we'll input it into NetStiff NG. So what we looked at, we went through those similar like BPF filters earlier. So here I'm actually using netshfng and actually made a mistake, I just noticed that --dev should be an interface after that. So eth0, for instance, fill that in with your mind. So we capture one packet with the number and we set a ring buffer of size 50. By default it's 23, so you may— you'll have some variance on how much your system can handle, so increasing it might, you might outperform what you could if you wouldn't have increased it otherwise. Something to take into consideration. I've had good results with 50 and 75 on my system being better than the default. And you can also bind to a specific CPU with -v. And you can see how this output, I mean, it's quite large, it's all there, it's real condensed. I don't like that, that's one of the reasons I use tcpdump, but What— a good thing to do is dump all this data to disk with NetSniffNG and then use TCPdump to analyze it. Because TCPdump typically gives you one per line if you're not taking— or you're not showing all the application layer data. So here I— here's a good example of something you can use on your own or at work or whatever. You can use NetSniffNG, use an interface, and then output your PCAPs to a directory. And we can use the -f option to set an interval in seconds. So I have it at 60 seconds. So every 60 seconds we're going to generate a new pcap and writes it out in the time since Unix epoch. So one thing to do would be if you want a capture of every day, you would set that to how many seconds are in a day, which is 86,400, I believe. So we can do that. And if you look at the bottom, we can show that pcaps are written to disk in Unix epoch time I have listed against the date command. Convert that to the date and time. So you can do this. This is a simple way to capture all data to disk on your own. This is an example of what you can use at work, and I do this. So something to take into consideration. So creating filters. So at the top picture, I have tcpdump -dd, so we're dumping the assembler-like opcodes to a file. I'm piping a line to our stderr because it's an extra line that shows up that doesn't need to be there. It just says I'm reading this. And I pipe the output, this stdout, to arp.bpf, just a file that has those codes. And we take those and we load those into net-sniff-ng in the bottom picture, number 2, using the -f option. So we load a filter, f for filter. And so I specify arp.bpf and then it takes that into account and runs that filter. You can see it shows the BPF language below, like when we set it up. Load half-word at the 12-byte offset of the beginning of that frame and do a jump compare and stuff like that. So that's how all that works. Here's a quick view look at TCPdump. So right here we're using TCPdump to dump packets to disk. But one thing is, like I said, on performance is that TCPdump by itself, if you're having gigabit line rate speeds, you probably won't be able to handle it. You'll have to use a shared memory system like pfRing or netmap.. Now NetSniffNG will do a better— have better performance. Now I do know that since Linux kernel 2.4 up, they do— they have— it's compiled with packetconfig mmap, so libpcap library will take advantage of the memorymap configuration in the kernel, but it's still not quite up to par, in my tests anyway, of NetSniffNG. And here I'm just— I'm writing hex to disk, I am also dumping their values to the hex and ASCII so you can see what it looks like. And one thing is libpcap is ubiquitous, just about on every system you can imagine, from 264 Unix to AIX, BSDs, whatever. And it runs, was included with just about every Linux distribution. tcpdump will be there most likely. And here's where I talked about the kernel will need to be compiled with config, packet in that, but that shouldn't be a problem nowadays. In any case, anything, most distributions will have that included. And on FreeBSD, you'll need to take advantage of the shared memory. You'll actually have to use sysctl to increase or to turn on the value of the variable bpf_zero_copy_buffers. You just enable it to 1, and then we can take advantage of shared memory in libpcap. Okay, now for analysis. So here's a bunch of tools. That I, that I, I had to be discriminating on this because I couldn't really talk about everything. I just figured stuff that was easy to present on, so we'll get into these a few. There's a large list of tools out there that are really common and popular, but these will get you on your feet, I believe. And most of these tools are focused on the command line minus the, with the exception of ntop. I do not talk about Wireshark. I typically don't use TCPdump, but it's just a personal thing. Wireshark is very advanced. You can do a lot of stuff with, take 3 of these tools and do all that with Wireshark that you would have to have 3 different tools for parsing and piping and all that. So ntop is a nice web interface for looking at traffic that comes in on your interfaces. One thing I really like about it is we have, I have 6 NICs and ntop can detect those NICs and have a page for each one of those network cards and the traffic coming off. So I can have a, so I So I can just click switch NIC in the menu and switch, you know, I want to go to NIC 1, NIC 2, NIC 3 and see the differences for each one. And it's— they have really nice bar graphs using RRD tool. So you can get a nice look at what traffic looks like in a— from a visualization perspective. I have a long— here's a long query that I've used at work for using multiple networks and stuff like that. It's changed a little bit but. That's something to get you an idea of how things are, how things work. Snort. So we talked about having data beforehand. So we can use captures, you know, from an incident that occurred last week or a few days ago. We can actually take this information, these PCAPs that we've written to disk, and we can pipe them through Snort or have Snort read the file, the PCAP file, and perform analysis on it. So then all we have to do is specify our Snort configuration file. And here, just an example at the second, this was happening. I had two, looks like, inbound frequent emails, too many, and then a known Russian business network address that it flagged. So you can see how we can use these to generate alerts. And once we have these alerts, assuming that the data is valuable, we can then further analyze these with other tools by focusing in on the specific alert. That's usually a good baseline on how to know what to look for, assuming that your IDS picked it up, but that is not always the case. Okay, so next one. IFTop's a really nice tool for not even security, but even for network management. As a Unix administrator, I do a lot with seeing who's hogging a lot of traffic, if the network's slow or stuff like that on certain segments, and IFTop's been a real key in getting information quickly. So it has a really nice display. You can run it from the command line in curses. We use iftop, we specify interface, and we can see— I drew the little statistics on there, what they show. It shows like for a host, each flow has one direction. It's a line. And you can see it has this logarithmic graph. And you can see how as farther as it goes to your left,— you're right, excuse me. You can see that's how much more bandwidth they've had from everybody else. So we can see, we can keep a list of hogs if you wanted to quickly and pretty easily. And it has a lot of other features. You can see the cumulative total on the interface or on a specific set of hosts. So if you're having a lot of traffic to, say, a specific server or destined to a specific server, you can use a filter and grab all and filter for, you know, IPs destined to that server. And you can see, you know, how much traffic they're using for your whole— that whole segment or that whole network that they're listening on that you can see. You can all— it has a nice interactive feel to it, so you can use like common keys like H to cycle through different views. Here we can actually have a single— that single line view was separated into two lines. Then we have receive and transmit, each direction. So that's pretty nice. You can see how the flows are going. And we can actually specify an external network to separate it from an internal network. So in this test network right here, I have a bunch of hosts here on your left side, and I can specify an external network to separate those two, so everything on the right side will be hosts out of my network. So we can see what people are going to on— through the NAT or the DMZ or whatever, however you're sniffing from. And here we're just using, like we talked about, BPF filters. We're setting filters here, so you can set them on the command line, which is pretty easy to do it. And you can key in on certain hosts. One thing I like, you can use regular expressions just to do quick screen filters. And here I use a regular expression to grab all hosts 1 through 256, or 0 through 256. So that's something you can do so you can key in on specific hosts and I highlighted the results. And this is done interactively so you don't have to set up new filters. And then there's a configuration file that I use that you if you want to play with this, you can just use this. I think it's really good. It turns off DNS resolution by default. Speaking of that, one thing is when you're capturing packets, you don't want to resolve names. First of all, it really slows down your time, but as an attacker, if I'm at some point on the network where I can see traffic, and assuming there's lots of traffic, and— or maybe I compromised a router or something, I don't know. One thing you might be able to tell from a network monitoring perspective is if there's a— if there's a— one machine is sending out thousands upon thousands of DNS requests. You might have some— you can— might be kind of insightful to say maybe this is a network monitoring system. So that's something to keep in mind too. So always turn those off, but more importantly is that you will drop many more packets if you can't keep up with the resolution of names. Usually in most of your tools you use dash and to turn it off. Okay, so getting to the end here. TCPflow. This is a nice session tool so we can track flows. Here's just an example in a network where we— I dump traffic from eth2 and we can see the flows for, in this case, these are mail servers. And I can show both directions. I get— like here it shows the MAIL QUIT command, so it's telling the— the client's telling the server I'm going to give up connection no more, we're going to close it out. And then the server responds with BYE. And you can see at the bottom there's more examples of this where you can see that the servers are negotiating. So this way you can keep flows of the actual TCP data, the actual session layer data, which is really nice to have, especially if you're looking at— if you want to see sessions of what people are doing and stuff like that in case you need to investigate something. It's nice to know all the commands and the methods of everything being sent across the wire in that session. TCP flow again, this example we're using, we're capturing headers from HTTP servers and we're just dumping the headers. We're actually seeing, you know, the referrers and the content, the agents and all that stuff. So nice to know. We can also, what TCP flow does by default is it writes these flows to disk, these flow files, and you can go through there, each one. I did a file at the very bottom. I did a file in that entire directory and show what they— it shows ASCII text and data. So it can capture data too. It actually captures session data. So you can use a tool like foremost for the forensic people and/or TCP extract and other tools to actually extract actual binaries in the files that were transmitted.. So that's something that's interesting too. Of course you can do that with Wireshark as well, I believe, but you can follow a session too and save the data as well. Alright, so TCPick is a newer one. Well, it's at least newer than TCPflow, which I think is deprecated at the moment. I don't think they work on it anymore, but it's still a really nice tool. And this one, the display is a little bit easier to see on this picture. It's got really colorful— it's really colorful. So we're doing basically the same thing. And here, I like the fact that it points out the TCP flags, so we can see the AS for the SYN, SYN-SENT, SYN-RECEIVED, the AS, the acknowledgement in the SYN, and then the pushes and all that and so on and so forth. And here, this is actually an FTP session, so we can see what people are doing on their session. So, "Welcome to this FTP server," it says, and it says the user, I blanked it out. So this is logging in on, this is the password logging in on, and then they're authenticated, so the server then reports, hey, welcome to my server and then puts them into a directory. That's an easy way to visualize exactly what's going on. Here's another example of TCPICP. This time we're writing it to disk so we can write these flows just like we did in TCPflow. At the bottom I show that they're— they're just called— they're different files, dat and lck. One thing you can do is you can specify options to specify only a server flow, so you can only capture traffic from the server or from the client. So you can, like, say if you're copying a file from a server, you might only want the server flow if you're going to do forensics on it and get the file out of it. So that's something to take into consideration. And this, this tool is a really nice one. It has an ASCII mode as well. But if you don't want to have the GUI, you don't have any cursors or anything like that. Speedometer is a simple bandwidth utilization tool. It's kind of like iftop except not so granular in that it can pick out specific connections or flows or sessions. This one just takes a look at interface and a quick way to see how many bytes are throughput of the interface getting in. So at this point, 11 megabits per— megabytes per second here on this interface. And one thing that's nice about it is that you can specify multiple interfaces and have each one in different rows, or you can use columns. So you can keep— I usually keep this on my desktop so I can see over time at what period of time in the day this traffic goes up or spikes. Spikes or comes down. And then the last one here is Networkgrep. So most people are familiar with the Unix grep tool. Networkgrep allows us to use those regular expressions to, in pattern matching, to the network. So we can apply this to packets as they come in. And I use a line here to look for those GET requests like we talked about before, how we can use tcpdump and a more of an advanced filter to grab those 4 bytes that GET in the space with the hex values. And here we can just do it with ngrep and just by saying quotations GET quotations and then you specify port 80 so you only get that GET from a web server or a traffic running through that port. So it's an easy way. Here I'm looking for JPEGs, you set up a regular expression to look for anything that matches .jpeg. And then go to the next one. Here's— so assume that I have a bad user. This is kind of chaotic here. It's kind of ugly too. So assume that a bad user, we copy their data to a pcap. I can further analyze it here. I do a head and I print out the first 60 lines and I use a bunch of sed and awk commands to grab the field I want. And this way I can print out a report of all traffic that this bad user has been engaging in, all HTTP traffic that they're using, that they've used in the past, all the requests they've made, all the GET methods and stuff like that. And I can use this to print out a report in case I need to investigate something further. So this is a quick way to do it. Well, that's not really quick, but you could— you don't really need all— I cut a lot of it out because there's some things like Facebook at the moment I really didn't care about, and all these advertisements, companies that do advertising like DoubleClick and stuff, that wasn't really necessary. But that's just a quick way to do it, and then you can just print it out on your printer and you can show your boss if they suspect something something that needs to be investigated further. Okay, that is all for my talk. Questions, suggestions, comments, you can talk to me after or you can ask questions now. I'll ask a quick question. What's that? Have you ever had an issue with any of these tools causing even even more strange problems on your network? No, I have not. One thing to take into account is that these are only receive interfaces. I shut off the there's no transmit on them. So since I'm using SPAN ports, port mirroring and taps, or excuse me, hubs, I am able to only receive, so they won't send anything out. So there shouldn't be any problem with traffic leaving the sensor to the network. So it's receive only. Yes. One, you probably don't make enough money. And two, do you read people's email? No, I do not. Only if I, only if I, we haven't had an incident yet, but if one occurs, then I'll have to. But, you know, something I look so forward to. Anyways, all right, thank you. We will have handouts of Jon's talk. They're not back from being printed yet. We'll have them in the back for you, or contact me and we'll give you copies. Thanks, Jon. Thank you. We're running 15 minutes late. We're not going to take a break. If you need to go to the little boys' room, please do.
More from Jon


What No One Knows the Podcast / Vodcast featuring The Tampa Bay Wave and Jon Schipp

Meeting the Exposure Management Challenge: Key Use Cases for Success | @OfficialRapid7 #SolutionSpotlight

Spot Security Control Gaps and Non-Compliant Resources Across Your Attack Surface






