Bro Integrations by Jon Schipp
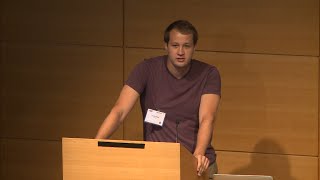
Jon Schipp presents Docker-based Bro training environments that start in milliseconds and support 140 concurrent users, plus tools like maldns2bro for threat intelligence and Sagan for log analysis. He demonstrates custom detection rules for VPN usage, DNS anomalies, and proxy activity using Bro logs.
Chapters
Anyway, so I'm Jon Schipp. I work at the NCSA. I'm on the security operations team. I'm also partially funded on the Bro project doing miscellaneous things. So, ooh, that didn't go well. Okay, I'll just slide it. So the agenda is talk about a few things I've worked on over the past year or so. Mostly small, we got a few that I think are really cool, and then we'll wrap up. So the first thing is this thing I've been working on called ILLiTE. It stands for the Isolated Scalable and Lightweight Environment for Training. And if you were here for BroCon 14— well, raise your hands if you were here for BroCon 14. Awesome, excellent. So at 14, we released, if you remember, a demo or a beta version of what I called Bro Live. If you actually had the executable or the script, it would actually have been Bro Sandbox. Well, that has been developed and has made its way to this new project called Eyelet. And this was funded under an NSF grant for Bro to enhance the environments for the project. And it essentially allows you to do some sort of really quick containerized training. So it doesn't— a container has user's environment, Bro's installed with all the Unix command line tools that they need to work with for the logs, etc. And it makes things really easy. Startup time is in the milliseconds. We measured it and that's very fast, especially when compared to virtual machine usage. A problem with virtual machines is that distribution tends to take a long time. There's large files, slow networks, you have to transfer on USB sticks, is how we did it at BroCon '14 and '13, I believe, and that slowed things down. It ended up putting us back a little bit. So we tried to find a solution for this, and this is where this came from. So the Linux kernel has namespaces and cgroups now, they've had for like 7 years. And now we're taking advantage of these using some sort of a Docker or some sort of container runtime implementation. In this case I use Docker, but I'm about ready to support LXC and a few other things. I'm trying to port it to FreeBSD using jails and ZFS, but that's not quite done yet. So let's move along to the next slide. So whenever you're in an environment like this, it looks and feels like a virtual machine. You have a shell, et cetera. It's your, you know, it's your hands are at the terminal, you can do whatever you need to do. So for the user's perspective, or from the user's perspective, you actually only need an SSH client. It's very simple, doesn't take a lot of, a lot of resources, and you know, you don't worry about actually running your own hypervisor, then have compatibility issues and so on and so forth. And from the administration perspective, I try to make it easy as I possibly could to deploy your own Bro training environments. So you can get it at the GitHub page there for the NCSA/iLIT, and you can type make bro-training, and then in a few minutes you'll have the same training environment image set up that we actually have running for the conference today. Also, we actually extended this and published a paper on it comparing costs and substantiating some claims and doing some performance evaluations using Bro in this environment. We have here is a simple benchmark simulating a number of users. So we had to define or pick out a metric that made sense for us, a metric that was suitable toward a user environment. We came up to be, or we came to be, is a response time or execution time of a program. Like, when does the user say enough is enough and I'm tired of waiting? They get bored, they just want to go home from the training environment. Event. So we use the response time. And for Bro running through a particular pcap that was used at BroCon 14, the exercise traffic pcap, which is a few megabytes, the point— or the execution time for that was 2.13 seconds. So we decided, hey, let's multiply by 3. If it takes 3 times as long, then that— we're saying that's too much. Now most people can wait more than 6 seconds. I feel most of us are patient enough, but I feel like that was a pretty good metric. For this. And if you look at the, the blue line that's going across, that is the cutoff point. That represents that time, that 6 seconds. The red line, everything above it, when you get to about the 140 mark, so we have 140 simulated users before that, they're not affected by that cutoff point. So once they reach that, that's the time we say, "Hey, we need to acquire more resources to this hardware, to this training environment." So what this actually means and translates for you, you can do run Bro, and across the way we simulated was multiple Bro sessions for every user that was on there. There was Bro running in a loop across different PCAP files, so more work than a user would ever do in a training simulation. And this ran 30 times, and we simulated some shell commands, some output parsing, etc., from the Bro logs that were generated. And you can see that you can do up to 140 users on a pretty small— or a a very standard box in EC2. So that ends up being cost savings for anybody that wants to do some sort of training. And it's not just limited to Bro, you can run pretty much any tool that you can in a GNU/Linux system in these Docker containers and train for them as well. Oh no. Okay. I was worried that Adam was gonna have a password on there. I'm gonna have to come to the front. Okay, the next tool I have is maldnssearch. This basically pulls in a bunch of intel feeds and there's tons of other intel tools out there. You have SIFT, Critical Stack has one now, etc. There's a few others. Well, at the time before we were using SIFT at the NCSA, I wrote Maldnssearch and then I wrote an extender tool called Maldns2bro that actually just takes any feed and then as long as the indicator's in the right column, it generates the appropriate output for your Bro instance. And while I was working on the Bro, or Bro Intelligence Data article on the Bro blog, we used that as a few examples so that you could quickly use intelligence data without actually having to set up a complicated system like SIFT. However, nowadays, like I said, Critical Stack has a very easy way to handle that. Few examples, here you can see that you pull down a list from Snort's website. We pipe it to Maldini StuBro and give it some information to fill out the various columns in the intelligence framework, the actual format that it wants. In the next example, we can see that we're pulling down the Mandiant APT1 list. That was ages ago, but just a good example of some things I had built into it. And of course, you can generate your own custom feed. And here I pull in a bunch of MD5 hashes at the bottom one. And then say, hey, it's from my organization. That just fills out the various parts of the intelligence feed information. Moving along, we have Sagan. So this is something I've been working on recently. So has anybody heard of Sagan? Okay, so yeah, it's a multi-threaded log analysis tool. It's kind of cool, and I've been working with Champ a little bit on it. 'Cause the reason I chose Sagan to do log analysis was, well for one I should say that I'm not aware of many people that actually run Bro logs through log analysis systems. Systems. I know many people use SIEMs and such, Splunk and ELK Stack, etc., but I'm not sure anybody's running signatures on the Bro logs that are generated, so I thought this might be a little fun thing to play with. So you have OSSEC and you have Sagan, but I chose Sagan because they already have an interest, the developers already have an interest in Bro. They have a number of rules already generated, and when you pull down the upstream Sagan rules, you actually have some for Bro. They also now have support for Bro's intel framework, so you can, there's a preprocessor, what they call it, just like in the Snort world, and so you can actually take those formatted Bro intelligence feeds, throw it to Sagan, and then have him do stuff. Or you match on the logs. So like, okay, cool. You know, we already have a well-known, and I hate to be this guy also that's talking about some Snort language rule stuff at the Bro Conference, but we already have this well-defined set of signature-based, or the signature language that most people have probably started with, or many of us probably started with Snort or Suricata prior to learning about Bro. I know I did. But, so we have this, and we can use this common language and, you know, just kind of work on some roadblocks. So, and the other big benefit of this is that it uses the Unified 2 output, so you can use any other tool that is used to integrate with Snort or Suricata, such as Dustin Snorby and Paul Squirt and Squeal. So, that makes it really easy to integrate. So now what we're going to do is we're going to take a look at a few detections I wrote. This one's very simple. I'm sure everybody understands this one. So we had some problems with a number of users on our network using the Hola VPN service. So we look for on the HTTP log a method of POST and content client.hola.org, which that's what they're going to use to start connecting through the VPN tunnel to initiate that transfer. So fairly simple, and we've caught some people already with it. Also, second detection for NX domain matches. So you may have a, may be interesting to find misconfigured DNS servers or people, you know, domain generation algorithm stuff. So here we're actually taking a look at for in the dns.log content NX domain, and we're tracking it So after 10,000 events of NXDOMAIN across a particular source IP address, this may be worth alerting somebody. You can change these numbers up to however you want to for your environment. It's a quick way to actually find excessive NXDOMAIN responses from the DNS. Also, we take a look at the one below, which is using the Bro intel preprocessor, and we're just actually matching on excessive bad domains So actually in this case, Sagan's pulling in an intelligence feed from a Bro-based format intelligence feed and we're matching every time that a host, and we're tracking by source, matches against a known bad one in that feed, then we count it and then once we get to the point where we hit the threshold on that count on the after modifier, then it will alert. So you can find people making, essentially what that means, I probably made that really complicated, But essentially what that means is a user making a lot of requests to known bad domains. Wah-wah, you get an alert. So. Moving along. Just a little bit more complicated, but not too bad. So proxy detection. You can do, so in http.log you can look for the connect method. And match the Roxy-Connection. And that's actually intentional. There was some differences between different ones I saw in the log. And then what we do is we set a flow bit there. So once we see a client make, use the HTTP connect method, we set a flow bit. And then we actually have this other rule at the bottom which kind of tries to validate our detection. I tried to come up with this way to use files.log whenever we see a file transferred after. There might be a better way to do it, but it seems to work. I haven't had any false positives yet. It's been running for a couple weeks now. Whenever I do find out open proxies on the net and try to pass data through it, it does detect it. So, and then the big thing here is content:0.00. So we don't want to find it where it matches. We want it to be more than .00 of a second in the duration field of files.log. So if it takes longer, it's more likely that it's, they're transferring a file or a webpage that's worth looking at. That's just kind of how I validate the false positives on this. And then I also did it for the GET and POST method. And it's basically, it's the same thing, except we then use a pro-reg expression to match GET or POST at the top. And then, you know, when you're using the GET or POST method, the actual argument in the HTTP header is that we have the URI prefix to it, and that's how we match that. So it's just a different way of detecting detecting proxies across those two HTTP methods. And so what plans are, so I'm going to write more of these and I'm going to get them upstream in the Sagan rules. And I know Josh was talking about the RDP success thing, which I've experienced that as well. I'm going to try to write a rule for that too to detect that across the endpoint logs. So just FYI. I'm actually working on Bro log normalization with liblognorm, so you can actually, if you don't want to use it for Sagan, use it for something else. I have like 20 or something logs done now, and I need to rework them and then go through another testing phase. We'll hopefully have those done too, so email me if you'd like to have those when I'm finished. And I'm gonna continue to work with Champ on improving Sagan. And finally, the last one, the minor one, is that I do a lot of stuff in the Auggie OS anymore, but I wrote a plugin to do a lot of stuff with Bro, and it does worker statuses, packet loss across MiraCom cards using the driver, netstats, and hopefully stats.log here soon. And then do capture loss. Basically, you can take a look at the examples in the next one, which is really the meat of it. You can just kind of see how it works. So if you're looking at the third one down, the capture loss, you say, hey, I want to use the capture loss check, and then if it's greater than 10% loss, then hey, alert me. Etc. So some pretty basic Nagios stuff, but trying to make a decent plugin for everybody. I'm gonna add pfRing and etc., maybe some netmap steps in the future, so. And then when Bro Control-D comes out, I'll work on the new API for that. I'm excited about that, as you all should be as well. And if you wanna get that, you can get it at that GitHub link there. Alright, and that concludes my talk. Hopefully I made it on time. I know I spent 10 minutes working with the computer trying to get it up and running, but that is all. If you have any questions, let me know and come talk to me after. Thank you.
More from Jon


What No One Knows the Podcast / Vodcast featuring The Tampa Bay Wave and Jon Schipp

Meeting the Exposure Management Challenge: Key Use Cases for Success | @OfficialRapid7 #SolutionSpotlight

Spot Security Control Gaps and Non-Compliant Resources Across Your Attack Surface






