Hack3rcon 3 03 Intro to Network Traffic Analysis Part 1 Jon Schipp
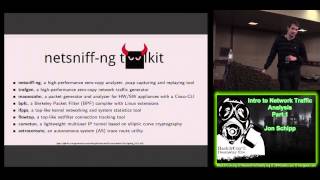
In this live workshop, Jon Schipp introduces participants to Linux network traffic capture and analysis. He begins with his background in Unix administration, PCI compliance, and open‑source community work, then walks through the packet path from NIC to kernel memory, contrasting the legacy interrupt‑driven receive API (pre‑2.4 kernels) with the modern NAPI polling model and its interrupt‑mitigation benefits. Schipp explains how to monitor NIC statistics using /proc/net/dev, ethtool, and the NetSniffNG‑derived tool ifpps, and demonstrates extracting drop and interrupt data with command‑line pipelines (awk, grep, watch). He covers Berkeley Packet Filter (BPF) basics, showing both mnemonic and opcode examples, and introduces the NetSniffNG toolkit (netsniff‑ng, bpfc, traffgen, ntop, iftop, etc.) with usage patterns for high‑performance capture, filtering, and traffic generation. The talk also delves into driver‑level tuning via ethtool (RX/TX ring sizes, offload features, pause frames, interrupt coalescence) and kernel sysctl settings (netdevmaxbacklog, JIT BPF compilation). Finally, he outlines how to persist driver options via /etc/modprobe.d and modinfo, and provides a roadmap for hands‑on labs that will follow after lunch.
Chapters
Okay. Alright.
Hello everyone. I'm doing a PCAP analysis network traffic workshop here at HackerCon this year. It's gonna be in two parts. The first part we'll do some slides and the second part we'll actually get some hands-on work. And we do have a lot to go through. I'm not quite sure we'll get it all done. I was planning to set up an environment and do analysis of actual exploits and stuff like that, but unfortunately I have not had enough time. However, we do have PCAPs, or malicious PCAPs, so at the end we can also spend some time, if we have enough, to play with them. You guys can dig and see what you can find. So I am a Unix administrator. I also do some PCI compliance, minor defense stuff. I have an interest in Linux and open source, free and open source software. So I run the DuBois County Linux User Group, and I also have another project. I work with a bunch of guys where we play around with security tools and write articles and such called the Southern Indiana Computer Club. This is our website here. I'm gonna give a plug here because a lot of the stuff I've been working on, I've written articles on. So there's a lot of really technical articles on various aspects of packet capture, and especially on the NetSniffNG suite, which I'm one of the few that have material out now for that. And it's a brand new suite of tools, high performance packet capture tools, which we'll talk about momentarily. Okay, so a little theory. So this is a diagram of how packets come into a NIC and make it to the host operating system's memory. And basically down toward the bottom where it shows the blue boxes that say frame, A packet will reach the NIC over the Ethernet cable, right? They'll be copied in a FIFO buffer, first in first out queue on the network card. It's actually internal physical RAM on the NIC. From there a buffer descriptor is then passed to the host operating system describing that packet. That packet then gets transferred to the host machine's system memory, and then if you're using Linux or FreeBSD makes its way into the kernel and all that. So it's basically being physically addressed in the host operating system. That's one thing we need to know. Okay, so in the Linux kernel, there has been historically two ways. The one on the left, the receiver old API at the top, that is the old one. I think that's 2.4 kernels and below. They had a, mechanism where after the packet hits the network card, an IRQ, hardware interrupt is generated. The packet then makes its way after either using DMA, direct memory access to copy to the host operating system's memory, or it uses the CPU intervention if you're using older systems. The packet eventually makes its way up to the backlog queue in the red at the top. And then it gets passed passed to the IP stack where you see the IP receive function and then, you know, makes its way up to UDP, TCP, or what have you until eventually it reaches the socket that the application is listening. And on the right side we have the new application programming interface, which uses a polling mechanism. So all, pretty much every kernel you're running nowadays is using this new application programming interface. This new way of getting packets from the NIC into the kernel. And the advantages of this are there's built-in interrupt mitigation. 'Cause the problem with the old mechanisms, you have to generate an IRQ every time a NIC, a packet hits the NIC, and then if you have a large packet per second rate, you'll actually, the CPU will not be able to respond to the actual applications listening because there'll be an interrupt storm which takes up all the time processing the packets and it can't keep up with any of the applications that are listening. For the packets. And a way to do this is to fill the ring, and every couple microseconds we actually have the CPU pull the buffer that actually contains the packets. So then you have extra microseconds that are used for actual processing of your normal operating system data. Here is a diagram of the packet path, the ingress direction, the packets coming into the NIC. So we see at the bottom, an interrupt is, the very bottom it says network card hardware. To the left we see an interrupt is generated, then on modern systems it uses direct memory access to the ring buffer into the operating system. And then over to the right in the dotted line you'll see the NAPI, if the app, excuse me, if the new application program interface is on your system, you're using that, then you'll pass the backlog queue toward the top where it says enqueue backlog.— which if you guys ever did operating system tuning, when you use sysctl netdev max backlog or something similar to that and you increase the value so you can hold more packets and reduce your number of losses for a packet capture. Well, if you're using the new application programming interface, you're actually not, you're bypassing that enqueue backlog and that really doesn't help. However, if you do use receive packet steering, it's a newer technology, I'm not completely familiar with it. But the idea is that you can distribute more packets and have them backlogged onto multiple interfaces if you're using symmetric multiprocessing. You have multiple cores in your CPU. You can have them queue up on different ones so it disperses or distributes the packets across multiple cores, which can aid in performance. Okay, so in Linux, you're actually, whenever you use netstat to get, network information statistics. You're actually reading from proc/netdev. And you can use, there's another tool called ethtool which actually asks for more lower level information such as drops from your network card buffers. Like the first in first out, we talked about that FIFO buffer. So you can use ethtool -S for instance and then the name of the network card. If your card's supported obviously, 'cause Ethtool only works on certain cards, which is quite a few of the common ones. And it'll request information directly from the driver. And we'll get into all that. I'll have, in the materials we'll go through it. So you can see how that works and actually query it. Let's see here, let's skip this one. So one thing to notice, like I mentioned about Ethtool, is if you use Ethtool you can grep for a, parameter RX missed or no buffer at the top I have. And this is a clip from the Linux kernel mailing list where a guy asked about basically what are these parameters, what do the values hold, what does that mean? And if you, the RX missed errors, if you can look up there it says it indicates that the frames were dropped due to the adapter's FIFO getting full and overflowing. So if you have those numbers there, there's values greater than 0, that means you lost some data. You lost some packets coming into your dick. Now below, there's another number, RX no buffer count. That basically indicates that the driver, it tried to request buffers, but the actual bus on your machine was unable to allocate those buffers for the packets. So it'll try and try and try, and eventually if it cannot get those packets, or those buffers requested to fill the packets in because there's too many coming in at once, then you'll have an RX missed. This is lower-level drops on the network card driver. Here's a tool called ifpps. It's from the NetSniffNG project. Here it basically pulls the kernel. It's different from tools like tcpstat which use libpcap, makes calls to libpcap to pull information on how many packets, the packet rate in the, the bytes and all that. But here we're actually pulling the kernel directly. So the statistics will be slightly more accurate. And we'll get into all that. Here's some stuff from my, some articles I've written. I got some screenshots where you can take IFPPS and write data into CSV files or you can print to the screen. Here we just use some command line kung fu. We use awk and we're able to grep, or excuse me, grab fields that we want and print them to the screen. Screen. And here, an example, here's this Gawk statement I wrote that prints out the, takes the Unix timestamp and transfers it to your local time or the time that you specify. And we use some other Gawk print statements to grab the fields that we want and this is the way we can determine where, what second in our machine had the high amounts of interrupts. And we see that down there in the CPRX columns,— or any of those really that we have. See, we have one that's at 20,000 hardware interrupts per second and so on. Now here I did the same thing except I made an OR statement basically grabbing two fields and what the RX drops and the RX errors and if they are greater than zero that means we got those errors. So we'll look for every timestamp I have in my files of that dump of if— PPS data and grab and look for where we had an error at a particular time or a drop in frames. And we'll get into all that again. We'll have hands-on material for that. So go to the next one. The most ubiquitous BPF compiler is with the libpcap suite. Now the netsniff-ng project is working on their own. It's actually, it's pretty well done. It's a low-level compiler though. It's called bpfc. And I know Emmanuel, excuse me, Daniel is working on a high-level language for that right now so that you can use simple BPF buffers like arp and destination port, you know, 23, whatever. But for now you have to use assembly-like mnemonics. And here's an example of some BPF filters. So BPF is the Berkeley Packet Filter. Packet Filter Expression Language. And this is basically where we parse data coming into our machine and look for specific fields like, you know, we're a host, we want to say capture all traffic from a particular host or a particular network and destined to a particular machine with a specific port. So we can watch connections come and go. There's a bunch of different ones. We got basic filters on the left and advanced on the right. We'll get into these. Here is actually the mnemonic version at the top, and in the picture below is the opcode version of BPF filters, and we'll just go through one of these. I have these in my other talks explained thoroughly, but here we first load, look at this, instruction 000, we load the half-word of the frame into the accumulator. And it's the 12th byte. And if you look down at the bottom of the Ethernet header, that's the Ethernet type field. And the next instruction, 001, is a just equal. So if that value is equal, if you can, I should have turned my syntax off in Vim, but it says 0x, or excuse me, 0x806, and that basically says that the ARP bits are set in that frame. And then if that's set, then return the full packet. And we have the value of 65535. And then below it, if false, then jump to a 0 or that instruction 3 and return nothing. Basically got more technical, we don't need to go through those.
Let's see here.
Here is an example of an advanced BPF filter. And I use grep here just so you can see the red. You could use color code or, syntax so you could see what I was talking about. But here we're actually grabbing for SYN and SYN-ACK packets from the TCP segments. They have those 2 bits set and you know those are common in every initiated connection you make with TCP that you'll send a SYN, a SYN-ACK will come back and then you'll complete it with the final ACK. So this is just a simple way to see how you can drill down specific bits. Here we use, I use a ping with a record route option. It's a, I don't know if you guys know what that is. It's an old IP version 4 option that you can, that's basically a predated traceroute style where you can record the paths. And we, I send a record route out and you can only have so many bytes, I believe it's 9, that you can fit. So you can only fit 9 IP addresses in the resulting frame because of the max size. And we basically split the byte and mask the 0 bits and then a 15 if it's greater than 5, then we'll return those, looking for those specific packets. But this, you don't really need to know all this. This is really technical and you have to drill down on it. But just to get an idea of how granular you can be in picking out and specifying your data is what's important, the concept to get that. So another one is we actually captured a GET method. So HTTP GET request. And we basically look for the hex values of GET and then the space or the newline. But in this case it would be the space. At the T, where the TCP header starts, where it says 32, so we get 32 bytes over, we start from there and count the next 4 bytes, which would be those 4 characters, GET and then the space. And if those match, then we can dump that. But there's more, there's tools that are much better for this. NGREP where you can actually grab ASCII strings, ASCII characters and the such. So here's the NetSniffNG toolkit I was talking about and it's a high performance, well at least the NetSniffNG portion of the toolkit is one of my favorites. High performance packet sniffer. It doesn't use libpcap, it uses libc so it actually takes advantage, the first sniffer that actually takes advantage of the the pf packet socket structure in the kernel that uses the newer additions of the RX and TX rings. So you get better packet performance over at tcpdump or daemonlogger. And there's also a few other tools like the traffic generator, traffgen. A guy, this is a newer one, Mauzan. Actually, I'm not really sure how you pronounce that. Mauzan. This is brand new. The guy that wrote this originally authored it died last year and they've taken that up. So they're gonna get it to become, basically I'm assuming a kind of replacement for HPING but much, much greater speeds and performance on sending packets. You got the bpfc packet filter and then ifpps which I talked about briefly. The rest we won't go into. So I'm actually now a minor contributor to the NetStiffNG project. I'm doing a little documentation on it, writing I work on new man pages and I'm gonna write new code for IFPPS here soon to be able to pull multiple interfaces at once. And I have a few other ideas, maybe querying the ethtool information I talked about earlier so you can pull those RX miss, no buffer count information in there. So expect maybe some new things from me in the future. Here's a quick look at NetSniffNG. By default it produces a lot of information. One packet will fill your screen. But you can narrow down easily. I usually don't use NetSniffNG. If you're doing analysis, I recommend writing packets to disk with NetSysNG, NetSniffNG, and in the background or later on when you need to actually analyze them, use tcpdump or something that has a high-level BPF expression language. So it's much easier to narrow down. You don't really want to mess with the filters I'm going to show you here in a moment. It's really easy to use. The only two really options you really need to know is in and out. So --in, you can specify a pcap file, an interface, any sort of those common things. And then you specify out. You can specify another pcap file if you want to write a pcap to a pcap and put a filter on it. You can specify in from eth0, out from eth1. So you can copy packets from one interface out the other. It's got a lot of functionality, but not as granular as TCP Replay. And I basically use it in my production environment to write packets to disk, and then later I can revert back if I need to, if we detect a breach or something like that, or there's some suspicious traffic that I need to know about. 'Cause this is the only thing I can really get to keep up with it if I'm not using pfread, which is now in the security industry. So here's an example of writing a BPF filter. So we basically have that same mnemonic assembly-like language, and you would just actually put that text in a file and pass it to bpfc, and then it would write another file that takes the opcodes, and then you take netsniff-ng and pass the -f filter option, and it'll read that file and then you can add that filter, the filter's put in the kernel, so. You can also do the same thing with TCPmap. We'll get into all that though.
Let's see here.
So let me ask a quick question. Does everybody have the material they need now? Do we have anybody that wants a copy of the materials?
Okay, cool.
So we'll get started in just a second. So here I'm using NetSniffNG. And it actually outputs for every time interval you can set. I want to record for every 60 seconds, generate a new pcap for every hour or every day. And I do daily pcaps, so I specify it's in seconds, so 86,400 seconds. And every time you write a new one, that little rectangle I put up there, it specifies how many packets were received and dropped. And I wrote some awk scripts to go through there and find out times where I drop packets, which is definitely needed to know. And here, back to Traefik Gen. There's a Linux kernel packet generator called pktgen. It's the fastest one out there right now that I'm aware of. But if you look at this graph, Traefik Gen is slowly, or it's pretty much, it's getting up there. Not quite as fast, but I know they're gonna do a lot of performance techniques and mechanisms where their goal is to get it as fast as pktgen. So that's something to look at as well. If you need to replay network traffic or test IDS devices or firewalls, just hammer it.
Okay.
Here's a number of tools that we will touch on a little bit. Like here's ntop, gives you graphical representation of PCAP data, it'll plot it using rrdtool. Iftop is a good way. It's a session connection management tool where you can— it takes, looks for streams, just coordinates, an IP source destination, source and destination, and it will show you on a graph and it will apply, apply a linear logarithmic style bars across the screen left to right. You can see like the guy at the very top has— is generating the most traffic at that period of time. You can apply filters. Here we can do TCP flow, which we'll touch on. You can reassemble data from a TCP connection. Same with TCP-PIX. Speedometer, another graphical tool. Network grep, where you can, here's a very ugly, very ugly, way to grab the data I needed. Just kept adding more regular expressions on it. Okay, so if everybody's got what they need, we can— everybody see that?
Okay, so.
Alright, so we're first gonna go through the, open up the PCAP worksheet, this file. And you can just open it in VI or any text editor if you'd like. And I got it, it's quite long, I don't think we'll get through all this today. But, let's see here, okay, so first we'll start off with just basic things like ifconfig and netstat. So I'll open a new terminal window here. Whoops, keyboard's small. Okay, so if you're on a Linux machine, you can use ifconfig, or you can do it on a BSD or OS X, and we'll specify the interface. If you're on OS X, you would use en0 probably, that'd probably be your first interface. And here we actually get some data about our, the first network card on the bus. And this, things to pay attention to are the amount of packets we can receive, the errors, The dropped number. You can see this is not really, I don't have an Ethernet connection at the moment so we don't have anything flowing through here. So we need to pay attention to these. And then the total RX bytes and trend mini bytes, the TX values. So if you wanted to list all your network cards you can do -a, everything that's detected on the bus. Here we have my Wi-Fi card at the very bottom, wlan0. And see we got a, we had a very small amount of packets that were received and sent.
Okay, so.
So that's where you first, that's where you get your first stats from, those RX values. You wanna know the values that dropped on ifconfig, ifconfig if you're doing IDS and stuff like that or packet capturing all day long. You have a dedicated box, you need to know how much you're missing. The goal is to not, lose any data that may be valuable in the future. So those values in ifconfig are actually read and, and netstat, if we do a, sorry here, netstat -i, here we go, here's some more, here's basically the same values. So these are read from /proc/netdev, which is a virtual file system in the Linux kernel, And we can pipe that to columns -t. Made it a little better. But here you can get those values too if you just want to see all at once. You don't want to go through just the normal list every interface is ifconfig. It's a little more concise. Or we can do cat /proc/net/dev. Get the values here. That's really ugly. Let's do column again, -t. Well, my terminal's so small right now it's not going to display well. But if you have a larger terminal it will put them in columns.
Columns.
It'll be easier to read. So the important point to know is that these values are read from the kernel file proc/netdev. So you basically just pull that file, like if you're in C you'd write like an open, fopen the file or something. And then you'd pull it for a certain amount of time, then you'd subtract the value from that second to the prior one, and then it shows you how many, what the value is for that period of time. So you just read that. You can also watch it. Here we use the watch tool, watch every second, cat /proc/netdev. And this, you can see at the top, the seconds, these are actually, it's catting it over and over and over. However, there's nothing coming in unfortunately, so you won't see values change.
Okay.
And here if you want to, you can use quick awk script here. We're gonna print the first column of that data, which is the interface name, and then we're gonna print the fifth column, which is the drop count. Print—
oh, my bad. There we go.
And obviously since we have no packet rate coming in, I'm not dropping any. Anything. So it's a quick way to do, using command line tools to get what you want. Another thing that we talked about is interrupts. So if we use vmstat -m 1, it will just display data in megabytes and print every second. We talked about high interrupt usage. Well, if you wanna see what it looks like when interrupts go really high, we can use, if you print anything to a terminal, your terminal's, there's gonna be an interrupt triggered so the CPU can write data to the terminal, and if you use a program called yes, which just prints y's to the screen, over and over and over, should see our interrupt rate go way up here.
610 now, usually it's in the thousands, hold on here, not sure why it's doing that.
Context switch rate, if you notice that, every time an interrupt's generated you gotta switch from user space to kernel space. We can see that we're in the thousands right there, really high numbers. I'll point that out right here. That's due to the cs command. That's another way, these are just admin tools that you'll need to know just for anything in particular, normal administration work, these are valuable. And now we'll use ifpps. You may not have this installed if you did not compile the NetStiffNG toolkit, which I recommend compiling it. The package in the Debian repositories is very old. You will not get any of the new features, and you, trust me, you can't even write to a pcap if I remember correctly. So here's, let's do my wireless interface. Okay, so we don't have anything coming in, but terminal's small as well, so it's a little mixed up here and jumbled, but if you do wireless, you can also get line noise and signal and all that, so that's useful too. And this basically just reads /proc/net/dev in the background. It also reads /proc/net/interrupts. Oops, I apologize, that's not /proc/net, it's /proc/interrupts, which basically is all your interrupt information, what devices are assigned to which interrupt and which CPUs. So CPU 0 and CPU 1 And here you can also see the amount of interrupts accumulated over time by catting this if you don't wanna use vmstat or another tool. There's also, it reads values from /proc/net/software/interrupt, which is another form of interrupt that's higher level. You read those values too. Okay, so let's get down to ethtool. Okay, so let's just grab information. So this gives us link information about our card. This is low-level information. This is a very, very useful tool to have in your tool belt. If you know all the ins and outs of it, you can really debunk or fix a lot of problems. So here we're going to use ethtool -s No stats, this may be my card.
Let's try 0.
Yeah, okay, so that doesn't work on my card, the drivers for this card. But if you do -s, it will give you a large list of values. There's quite a bit, you'll have to use command line filtering to get what you want probably, but you can get those RX miss values and those no buffer count values. On some cards there'll actually be an RX drop count, but I know on the E1000 driver for the NICs I use at work, that is not present. Those cards don't use that, don't read anything from there, 'cause the NICs aren't built to write information about drop counts like that. They have to use, they use the RX buffer count and the RX missed. Okay, a few other things. So we showed how, these are in the slides too, and we can use egrep and grab the RX missed values and no buffer. We can actually increase the amount of FIFO buffer descriptors, the number of packets we can address in the first-in-first-out buffer queue on the physical NIC by using the G. Oops, I still got that going, that's not good.
Okay.
And I'm not supported again, so I guess none of these will work at the moment. But if you use -G you can query it. And then if you use capital -G you can actually set it. So I would specify eth0, I wanna increase my buffer count to 4096, which is the max on the E1000 cards that use that driver. And I increase the max of the transmit values to 4096. The default, I think off the top of my head, is 256. So that's quite a bit of difference. And you can notice, if your CPU can catch up, you would notice that your machine or your card will be able to handle more packets. You'll have less drops. Potentially at that layer. Another thing is this -k. We use these to view. You see this column up here, show. These are all show commands to show information. These are— and then the uppercase is the set. So these ones right here. The -k will actually show offloading features in the card so that maybe the NIC can do the checksum, calculate the checksum values, or it can actually bundle packets up and make them bigger so that the they can just pass one large packet to the kernel, such when it comes to receive offloading and segmentation offloading. And here, here's a generic receive offloading on, I have it turned on in this instance. Generic segmentation offloading turned on. RX checksumming turned on. You have to play around with these. They're having lots of, if your card is slow, you may turn all these off. Rely on the CPU to actually do more of the processing. I've had that happen, especially one of my boxes where I would lose a lot of packets in the NIC and I actually— these were all set on, I turned them off and I got much better performance. I still had some losses but significantly improved on how much— on the amount of data that I could now handle or that NIC card could now handle by actually allowing the CPU to take over some of the work. So I would just turn all these off, on, switched to off, and the RX value's off, so then the CPU would actually do the, when it went up the stack, would do the actual RX checksumming function. Here's another thing that's really important, especially if you're a passive device, is this -A. This is for pause frames, so Ethernet, in the specification, it's a flow control mechanism where a frame is sent, and if a machine is, getting bombarded with packets, it cannot keep up. It can send a pause frame to the receiving device or the switch. Some switches take advantage of it and they'll say, oh, well, let me queue some of the packets in the actual switch and let this guy catch up and then we'll send the rest there. So if you turn off pause frames and it's a receive-only network card where you don't have it assigned to an IP address, then you'll be able to handle more data. But you could also have more losses. But you may encounter even more greater losses if all the other machines on your network are buffering that data. Okay, so another thing is interrupt coalescence. This is basically setting interrupt mitigation techniques on the driver. And here basically we wanna pull every, on the receive, every 100 microseconds here. You're gonna set the values. Or excuse me, view the values. I think mine, one of my machines, you can do etool -c, the network card name. I think the default was 3 microseconds. So here you can increase it if you want to or you can lower the value. Basically all this, there's no guarantees on what is going to improve the performance of your system in regards to packet capture. You basically need to check all these things, test, turn them on, turn them off, And while you're doing all that, flood it with network traffic and then use tools like npsstat and vmstat and all those and watch performance statistics. And then whenever you're using sniffing tools, watch the drop rates. And you can kind of gauge how much or how little each additional increase in these settings will have upon the system. So here's more OS configurables.
Sorry.
We got proc net softstats. Okay, so when we talked earlier about that backlog queue, when we looked at that graph, if the new NAPI systems don't use the backlog queue, then there's a drop stats for machines that use the older API. And these values can be read from proc net softstats stat. And it's the second column. If I do recall, of the drops values. We're not using that right now, and of course I don't have any flood of packets coming in. So you would just, you could just print the second column, suppose. And each row is a CPU. So I have 2 cores, so therefore I have 2 rows. So we can just print second one. We got the zeros right there. And you could, Let's grab, let's go back real quick, I'll show you. Over here I have an example where those are in hex, you know, hex, eh. You can convert them to decimal and get the actual values or human readable values anyway, or easier. So we use the printf and we give it a character format code of decimal and we print the value out there so we can, so like grab this right here, printf, Oops, what about here?
Lost my buffer. 0, 0, oh, I gotta do my 0x, sorry.
Sorry, it's really hard typing like this.
Yes. Okay.
Yeah, so I got 2,672. Those are the received packets, the received field. Then we can do a newline character and then it'll print out. Because over here it actually printed on the same line because we didn't tell the terminal to print on a new line. So we just add the backslash n. So I may, something I would like to do is add this in ethtool to have maybe use, if the machine has, or excuse me, ifpps, if the machine has ethtool on board, call that, have it query the network card and see if it's using NAPI or not, and then maybe print those values in case they're of use to anybody. So I'd read a proc, softstats, net softnet stats, and then print print those values out. That's something on my to-do list. Okay, so another thing is most modern kernels, sorry, have the just-in-time compiler in it, which is a BPF compiler in the kernel. Just-in-time compilation speeds up the process of applying BPF filters to packets. And NetSniffNG, when you run that automatically, does operating system performance tuning. And one of the things it turns on is this, and you can just turn it on yourself by echoing a value of 1 into that proc file. And I know a lot of machines I've encountered, I don't think that's on by default, so you would wanna turn that on. You can maybe able to get, take advantage of having that on with some machines that will use the just-in-time compiler such as libpcap. Of style programs. Are you guys ready for lunch? Some of you? Want to take a break? For those that want to go to lunch, you guys can, and then I'll stay in here with some people that want to do labs and continue and ask questions. Because it's about lunchtime.
All right.
Well, I'll keep on rolling. Alright, so here's some other values. We talked about that, let's see here, that backlog. Here's the syscontrol value for it. We can, actually I'm just gonna copy and paste this. If you're on Linux, you can do Shift+Insert to actually paste it. And here it's actually set as 1000, so if you're on an older NAPI system, You could increase the value by specifying the option to write it. So -w and I want to make it 100,000, say. Now it's 100,000. So we can query it again. We can see that the value has changed. So we can store that many more packets in the backlog queue. We also have a few other values that I'm gonna skip over. These are memory values for socket and the like. If you want to echo, if you want to use the backlog and have it set up on boot, you can actually echo that syscontrol value into your syscontrol.conf file, so that which is read after all the init scripts are done, and it'll set those values on boot. Okay, another thing is, As far as device configuration for drivers, you can do, I don't know if I have one on my system at the moment. No, I do not.
Okay, okay.
Anyway, this is a, I created a file in /etc/modprobe.d and basically you can specify driver options. Options, specific ones. And here, this is just a kernel file. You would use this in any— if you had to configure any driver module in the machine, when it boots up it would read this— the modprobe command would read this file and set the settings in the kernel and then load the module. Here I set, um, you can turn off checksumming in the driver. Before we used ethtool to do that, but you can actually specify in a configuration file. You can set the values of the RX TX descriptors like we talked about, like before we set, we talked about how there were 256 by default, you can increase them with Ethtool. Here I did the same with an RX descriptors option with the driver itself. You can do flow control, this would be the pause frames right here. 0 means turn them off, 1 means turn them on. Interrupt throttle rate, this is the rate when the interrupts reach this, 5,000 interrupts per second, start the throttle. Debugging mode on, but I haven't actually seen it print anything. I'm not sure if it does anything. And here is fuse mod info on a specific module. And I'll do questions here in just a second, 'cause we're almost done with the first half or so. Mod info -p, which is the parameters, and we do the name of the driver. Let's see, hold on.
Modinfo, I'm sorry.
So basically this is the information I copied and pasted down there, if you see it toward the, right here, all this stuff. This basically gives you the options that you can set whenever you insert the driver into the kernel, and that basically was that file I was using, so you can just get an idea. Some of this stuff may not make sense to you. It didn't make sense to me, so I'd have to go back to the actual driver documentation on the internet and then I would have to read what it means and then set the values in my .conf file. So that's modinfo -p. And you guys have all these notes, you have everything on, in that tar archive I gave you. Okay, when we come back we'll start with this, the actual traffic analysis stuff. Does anybody have any questions? I covered a lot of stuff. I probably didn't explain it the best because I'm trying to fly through this. There's literally so much. Do I need to be more clear on anything? Doing good? Not too bad? Am I boring?
All right, cool.
All right, well then I'm going to go to lunch myself.
Stop right now. Yeah, yeah. All right.
More from Jon


What No One Knows the Podcast / Vodcast featuring The Tampa Bay Wave and Jon Schipp

Meeting the Exposure Management Challenge: Key Use Cases for Success | @OfficialRapid7 #SolutionSpotlight

Spot Security Control Gaps and Non-Compliant Resources Across Your Attack Surface






