Hack3rcon II 3-3 Jon Schipp Knowing What's Under Your Hood Implementing a Network Monitoring System
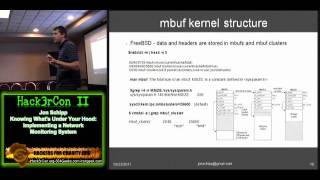
In this talk Jon Schipp, a Unix administrator, walks through the design and implementation of a network monitoring system built on commodity hardware for small‑business environments. He begins by explaining why network monitoring is valuable—for troubleshooting, firewall rule validation, attack detection, and forensic record‑keeping. He then surveys inexpensive traffic‑capture methods (cheap hubs, SPAN/port mirroring, network taps, and IP forwarding) and discusses how to place sensors in the network. The presentation dives deep into the hardware and OS layers that affect capture performance: NIC selection, PCI/PCIe bus limits, DMA and NAPI, kernel buffering structures (FreeBSD mbufs, Linux skbuffs), and the Berkeley Packet Filter (BPF) versus Linux Socket Filter (LSF). Schipp explains the problems of interrupt storms and context‑switch overhead, and shows how device polling, NAPI, and zero‑copy mmap can mitigate them. He details practical tuning steps—raising BPF/rmem buffer sizes, increasing receive descriptor counts, and adjusting kernel parameters—to achieve near‑zero packet loss even at gigabit speeds. High‑performance capture frameworks such as pfRing (Linux) and netmap (FreeBSD) are introduced, along with shared‑memory and direct‑NIC access techniques. The talk includes benchmark results comparing FreeBSD and Linux, highlighting disk I/O as a common bottleneck, and demonstrates how different snap‑length settings affect loss rates. Finally, Schipp lists a suite of analysis tools (tcpdump, ngrep, snort, ntop, netsniff-ng, daemonlogger, etherape, iftop, iptraps, trafshow, TCPick, TCPstat, bmon, etc.), configuration tips (rc.conf, interface bonding, multicast handling), and resources for further reading, including Richard Bejtlich’s The Tao of Network Monitoring and a collection of academic papers.
Chapters
Hello everyone. This talk is going to be about implementing a network monitoring system. So basically, I'm focusing mostly on implementation. We'll go into a few different things in operating systems and buffers and blah, blah, blah to learn about tuning. It's a focus on the small business. Rather than spending hundreds of dollars on specific high-performance NICs, we'll do it on commodity hardware and see what we can come up with on passively capturing traffic. Alright, who am I? My name is Jon Schipp. I am a Unix administrator for a small company in southern Indiana. I also do PCI compliance, but don't dog on me. I try not to be a checkbox guy. Checkbox guy? Checkbox guy, yep. Breaking shit. So I also run a local Unix and Linux user group, and I do the Southern Indiana Computer Club. Basically it's a little security thing I do with me and some friends, try to write code and play with stuff. Yeah, I like computers a lot. So what's network monitoring? So the idea is we want to monitor a network and we do this by collecting traffic or collecting data. And with this data, what we have to do with it, we have to make it useful. So we have to have a method of interpreting the data, right? So we, once we have data, we run tools on the data to get valuable information, right? We turn data into information into knowledge, you know, typical framework. And why would you want a network monitoring system? Well, one reason is network issues. Aside from security, which is usually mostly what it's used for, I find it very helpful in my day-to-day activities. Whenever there's a problem, I can't figure out why one machine can't communicate with the next machine, you know, I just open up tcpdump and let it rip and usually solve the problem. I've solved many common network problems, especially when I'm writing firewall rules. You know, why is, uh, My remote mail server reporting TCP segment with RST bit set, and I found out, oh, last night I wrote a rule and I screwed it up. So, you know, it's resetting the connection. So I can see that with TCPDump and having these sensors around my network, and I can see how machines are responding. I can make decisions and see if I screwed something up in the past. And another thing, well, the most important usually is attack detection. Everybody uses network monitoring for detecting attacks, right? Getting there's a foundation where we can run tools like Snort and have alerts that let us know what's going on in our network. Another thing is record keeping. If you want to have full content capture, packet capturing, maybe there's an incident in the future, or you know, you don't know that's going to happen, but it's there, it might, it's possible, a possibility, you can record the data and then later on you can analyze it for causal relations and you can see maybe what happened here or why it happened. And that's really good to have too. It's also fun. I could look at traffic all day long. I kind of like it. Whatever. Or fetish. So like I said, this is a focus on small geeks and stuff. Shh. Send me that sinned knowledge. I originally started this in my basement playing around with stuff. There's a really good book by Richard Baitlich. I'm sure many of you guys have heard of him. He speaks at Black Hat and a lot of the big conferences. Called The Tao of Network Monitoring. Its focus is largely on the tools that you're going to use. Which we won't go into that, but if you haven't used ngrep and snort and tcpdump and tcpstat and there's a whole slew of them, but if you haven't used those tools, then that's usually a really good book to get involved and try a few things out because it goes into a lot of detail basically. We're working with cheap goods and what we have. So this is my basement. This is where it started out. This machine over here is an OpenBSD router and Basically, it's running pfSense. It does my filtering, and I have 3 different networks on there, and it also runs all my censoring tools. So I just run my tools on the machine. I can see what traffic is flowing between which interfaces. So that's how I got started with this, and now I've implemented it in the business I work for. We've had pretty good results with it too. So, how do we get the data, right? So the cheapest thing to do is have a hub. You know, you can get them for $10 off eBay, probably Walmart, whatever. I'd probably get a higher-end hub with a better CPU and blah, blah, blah. But you can also use what's called SPAN ports. That's what Cisco calls them, but there's other devices that have them. There's switches, port mirroring. So basically you take a few interfaces or all the interfaces if your switch can handle it, and we copy the data from these interfaces out to a port, and you'll have this data go into a remote sensor listening. That's one thing we can do. We can also do it with taps. Taps are expensive, or typically I think they run anywhere between $200 and A couple thousand dollars. Basically just another device that sits on your network and regenerates traffic, makes copies and sends it to us. I'll send you all a picture of one in the next slide. And if you want to be— well, here's IP forwarding. We can also do this too. So if you have some machines on a specific network segment and you don't want to deploy a hub or you don't want to have spanning turned on or anything like that, you could just— if it's just maybe like 2 machines you want to monitor, you can just have it forward over IP to a remote machine and do it that way too. So you don't have to capture everything. You can only get what you— you can only grab what you need. And that's a method that might be useful in certain environments. So here's an example of a regeneration tap. This device is probably about $400. So it comes in on the switch, regenerates out to the end of the other switch it's going to, and then it copies the data to the analyzing hardware down below, the passive monitoring stuff. And back to forwarding. So here's a few things we can do. Wireshark has a remote feature, so you can copy traffic to a remote process, a remote Wireshark process on a machine. And NetMonitor Pro has the ability to do that. They call it PCAP over IP. You can also do it TCP dump in your socket-based tools like Socat, S-Cat, SSH, Scriptcatting, all that stuff. And NetF— iptables has a way to do it with an action called T, so you can just jump to T action, you can forward traffic out and make copies. And OpenBSD's pf has a cool way to do it with dup2, it's a duplicate action, so it duplicates a certain amount of traffic, or, well, based on the rules you set, out to a specific interface, and then you can have your monitoring device listening on that interface. That works pretty cool. Here's some basic architecture. So, in the top left-hand corner, Firewall Inline 5. I just grabbed these from Google. We see this is basically what I had in my basement. You have a router, firewall, inline sensor all in one device. All traffic's flowing through it and you're just collecting data that way. And we have, say, the bottom left, we have a— you can do it with a hub or switch, basically what we talked about with spanning and port mirroring. And then the top— the two on the right-hand side are just different ways to set the sensor after the firewall before. Okay, so problems here. High-end equipment is expensive. Packet capture is hard to do, especially when you get into gigabit speeds. So to manage that with commodity hardware, basically we're doing all the do-it-yourself type stuff, learning about OS tweaking with buffers and probably adding certain new sockets, putting in kernel modules like pfRing, or in FreeBSD they have a new implementation called netmap. And, you know, the big thing is hardware is not the problem usually, it's the software. A good example of this is the Berkeley Packet Filter. The original paper was written in '92 by Van Jacobson and another guy, his name is escaping me, but that's over 20— that's about 20 years ago. And we're using that same design today in the BSD family of operating systems. And then Linux, we take that Berkeley filter and we use that as a foundation. You know, they rewrote it to what's called LSF, the Linux Socket Filter. It's its own implementation. Alright, so network interface cards. So a good thing to do is get a quality card. That will help out a lot. NAPI is very good. So NAPI is the New Application Programming Interface. It's a way to get your NIC to transfer data to the system memory, like DMA data and using kernel ring buffers. So DMA is really good so we can avoid CPU intervention. We can directly copy data from the NIC to system memory, and that's much quicker. And usually these cards are what I'm using right now, and they whoop. They're excellent, and they're $30 on eBay. Can't beat it. Buy 15 of them and stick them in your PCI slots and go. So PCI buses. So PCI by itself can actually copy data, or get data speeds of 128 megabytes a second. So it can do a gigabit. Gigabit Ethernet. But you gotta remember that there's other devices listening on your PCI bus. So for every device you have to divide it by how many devices there are, because they'll all be using the same bus, right?, right? So what I'm doing, I'm using PCIe-X. We had a spare server lying around. That was basically what I developed on or implemented this on. So you basically, you probably want at least 1000 megabits of transfer rate. You gotta put in 20% or so overhead depending on the bus. But usually that's good. And with, you can see that PCIe, if you go down the higher end bus speeds, we can get 10 gigabit Ethernet, so that's pretty nice. So that's something to keep in mind. You probably want to have at least PCI-X if you're going to be capturing gigabit speeds. Alright, other things, using a commodity CPU, if you have a choice between the Opteron and the Xeon, definitely go with the Opteron. It's much quicker. There's some academic papers I've encountered on packet capture that these guys were testing between these two CPUs, and the Opteron whooped on all operating systems. Well, they tested FreeBSD and Linux, but In all tests, the Opteron outperformed the Xeon. So symmetric multiprocessing is good. You definitely want that if you don't have it. So we have multiple cores, right? We can put threads on different cores. And if you plan on writing to disk, that will be the bottleneck. We'll see with my test. I'll show you that. SSD might be the best way if you're going to do full content packet capturing, but it doesn't have to be. I'm doing it with SATA right now. And I'm not doing too bad. I'm almost zero loss. Okay, typical frame processing. So here's some things that you need to know about. So when a frame reaches a NIC, the Ethernet preamble is removed, and then the frame checksum sequence is calculated, right? If most NIC cards do not pass— if the checksum sequence is invalid, will not pass the card— or excuse me, the frame through the NIC into the internal memory and then to the the operating system. It gets dropped. There are some cards that do that, so you will not typically— if you're using libpcap and you're tapping into an interface, you will not see bad frame checksum sequence on frames. But however, you will see checksum sequence for TCP and IP. But it's just something to keep in mind, and we all know promiscuous mode will capture everything, and otherwise it only captures the unicast destination address and the MAC address. You can also set your card to promiscuous.. And we also have— what we do after all that's done, we do a first-in, first-out to a kernel ring buffer. And that's usually— if we have DMA, it's directly transferred to memory, system memory on the host operating system. If you don't have a system that uses DMA and your NIC doesn't, then the CPU will have to intervene and you'll have to use CPU cycles to copy that to the host memory, which greatly reduces the amount of traffic you can capture. And then what happens after that is the NIC generates an interrupt. Interrupt handler for the device driver is then called and it's passed into memory to the IP stack and then to the TCP modules and so on, eventually to the user space. So frame processing. This is basically how it's done. It's probably not true for all cards, but generally this is how it's done. So what happens is a frame will come in to the NIC, right, be stored in internal memory on the NIC in this buffer, The buffer is then DMA'd to another buffer in the host operating system. And then we have a buffer descriptor in the NIC that's transferred to the host operating system system memory. And this descriptor describes the frame in memory so we can address it and do things with it. So for instance, whenever I send data out my NIC, what's going to happen is that descriptor is going to be passed to the NIC card. The NIC card is going to look in memory for the the packet or the frame that's going to be sent out and it's going to describe it. It's going to be, hey, this points to this address in memory. It's going to pull it out and just send it out on the network. So descriptors are used to describe the data. And in my tests, I'm doing FreeBSD and Ubuntu partly because FreeBSD is the most popular operating system of the BSD family in Linux. Ubuntu is the largest, most widely used distribution. So some people relate to. Out of curiosity, does anybody in here use FreeBSD? A few hands, alright, cool. So we're going to talk about kernel structures a little bit just to get an idea. So in FreeBSD, what we do is a packet is stored into an mbuf, a memory buffer. And what we have here is, if you look at the bottom right-hand corner of the screen, we have 3 mbufs, and these 3 combine to be an mbuf chain. So if you look at the bottom, the leftmost mbuf, you can see at the bottom it says 28 bytes for the IP header and UDP header. So the UDP header is 20 bytes and the IP header is 8 bytes. So we're actually storing the packets just like that into these mbufs. And it's where it says m_next at the top, it points to the next mbuf in the chain. And if you look over here where that grep command is, I'm grepping for msize in param.h. And that's a header file that describes the size of the mbuf, and it's 256 bytes. So we're basically putting— since one mbuf is 256 bytes, if our data is larger than that, we'll have to put it in more than one mbuf. And that's basically what the chain's for. So you copy packets in many mbufs as you need. And there's a thing called an mbuf cluster, which is an mbuf that's external storage. It's for packets that did not fit into chains efficiently, so you store it in a larger buffer called a cluster. And we see that a cluster is 2 megs in size. And an example of this, on my OpenBSD system, if I would transfer large media files from one interface out to another interface, what would happen is I'd run out of inbuf clusters and my session would die. So I'd have to actually go in the kernel and— or use sysctl and increase the amount of inbuf clusters. I increased it about 20,000. That allowed me to transfer, basically transfer the session without problems.. So you might have to, depending on how much data there is, you might have to increase the number of mbufs. And that is only for host stack processing, though. Which we'll get into for high-speed packet capture, we'll need to bypass the host stack probably all the way to get, uh, become efficient in packet capture. And you can also, if you're out of curiosity, if you're interested in mbufs, you can view it by looking at netstat -m. It gives you the amount of mbufs in use and the total.— that you can use. And Linux, we actually use what's called an skbuf. And I don't go into the details with it. I still gotta look it up. I haven't had time. But this is basically the model. So we have these different skbuf structures, and they still point— you can see how they have next and previous, and they point to each one where the packets will be stored. And that's described in skbuf.h. Problems. So traditionally what the biggest problem is, packets— every packet that goes through a NIC generates an interrupt. And this is a huge problem because this causes interrupt storms. Or receive live locks, so basically starve the user space application from actually having CPU cycles to process the data. So if tcpdump's running, it won't actually be able to process anything because the computer's so busy handling interrupts, it's going to starve it. And there's a few things we can do now. Most cars, most modern cars, you shouldn't have this problem because a lot of modern cars have NAPI, but there's also a thing called device polling which we'll get into that can help relieve this. Issue. Another thing is context switches. So in kernel— or excuse me, your packet capturing software typically listens in user space. So an issue is you have to copy data from kernel space to user space back and forth all day long, and that takes more processes out of the CPU, more CPU time. Another thing is system calls. So each system call is pretty heavy for— usually you have to call a read for each packet or something like that. So to read it, and that typically takes a lot of CPU time. Solutions, what can we do? Device polling is a method that we can use to poll the devices rather than have each one generate an interrupt. And I'll show you how to do that. In Linux, that is by default, that's already there, if your card supports it, so you probably won't have any trouble with FreeBSD. If you have an older card, you'll have to turn on device polling. And it's just simply, it's just recompiling the kernel with an option. It's not too bad. And then of course, Navi is probably the best solution. Like those MT cards I talked about, those are Navi cards. So they built in those interrupt mitigation techniques built into the card, so you won't have an issue. And what else we can do is shared memory. Zero copying, so we call this mmap function. Basically what we do is we copy data into a buffer in kernel, in the kernel, and have the user space application be allowed to actually access that buffer in kernel rather than copying from this in kernel to another buffer to another buffer, then to finally the user space. They can actually access the same memory addresses in the kernel. So that definitely cuts down on copies and that will help out a lot. We can also just bypass the host stack altogether. With this comes your applications will not work anymore. Well, if you're going to use, like, open a web browser and you're bypassing the host stack, you won't be able to access any device, or excuse me, any packets out to the internet or anything like that because you're actually bypassing IP and the TCP modules in the kernel. So it's only for listening, only for packet capture. That's something to be aware of. But that's usually how you get the best speeds. Here's some other solutions. These really aren't that big of a deal, but I just threw them in there. Checksum offloading. Most NICs can actually calculate the checksums by themselves rather than have the CPU do it. Larger receive offloads where the NIC starts dividing up packets puts them in a large pool of buffers and sends a stream out to the host operating system. So the NIC does more work basically. Larger onboard memory size is one thing you can do, and you can also have more data descriptors so you can address more packets at one time.
Curious, what percentage of utilization do you see improved by using the checksum offloads?
I actually haven't tested that. I haven't had a problem, but I did put that in there because I know that can help a little bit, but I'm going to say out of just intuition, I'm going to say it's not very much.
Because the very early Broadcom chipsets actually, if you utilize that, that could starve your card because their checksum wasn't fast enough to keep up with the rest of the card.
Right.
So you ended up with a death effect.
Yeah, it's going to be mostly experimentation. I couldn't tell you. One thing you got to think about too though, if your NIC card is really slow, then you might— if your CPU is faster, you might want to have your CPU go ahead and do the checks on, right?
That's what was happening with the older Broadcoms when they started introducing this feature. Right. If you turn this on, you basically throttle traffic down because the silicon in the NIC wasn't fast enough to keep checks on. So offload actually slowed you down.
Right. That makes sense. So basically you got to do some experimenting based on whether it's your CPU is the issue or the offloading that did it, right? Yeah.
I was just curious what the state of the affairs is today.
Yeah, I'm not sure. 10 years ago. Right. Okay, so anyways, we go back to packet capturing mechanisms. So we have— well, the first one was the CSPF down at the very bottom versus others. That's the Cambridge Stanford Packet Filter. That was the first packet filter that was ever designed. And the problem with this was the filtering was actually done in user space rather than kernel space. So you Basically the packets got to kernel and you went ahead and copied them to user space and filtered them there rather than just filtering at the kernel, because those extra CPU cycles are just wasted. Why would you do that? And that's what— that's how BPF came about, and that's how the popularity for BPF increased. And BPF's the packet filtering mechanism on FreeBSD, and Linux uses LSF, Linux Socket Filter, which is kind of like an extended BPF. It uses the same filtering language, the ruling language. And then later on— this isn't really a packet capture mechanism subsystem like pfRing, but that's what I'm going to be talking about for Linux is one way we can really greatly increase the speed of our packet capture and processing. So libpcap, everybody's familiar with libpcap, it's a C library for packet capture and gives us access to link layer information and it runs on almost all the modern Unixes and it's ported to Windows. And data is actually stored in the libpcap buffer., and the applications will read from it. And here's some FreeBSD frame processing. This is basically how it works. I'm not sure— some of this material is a little bit old. I had to do a lot of research on this, so I will say that I'm probably incorrect on a few things in here, or maybe a lot of things, but generally this is how— just to get an idea of the concepts. I'm not a developer, so I'm just learning C now. I'm going through some source code and trying to figure some things out on my own, just so you know. So FreeBSD frame process. What we do is once the frame comes into the NIC card, it gets copied to the host stack and it pointers past the BPF and is copied to a hold/store buffer. These are double buffers. And then from there, the packet is eventually copied to user space into libpcap. And the problem with this is there's actually 3 copies rather than in Linux there's 2 copies, which is interesting. But FreeBSD seems to to outperform in my test, and I know there's some studies, their results were FreeBSD in userspace always outperforms Linux, which is kind of interesting. But anyway, so BSD typically deals with smaller buffers, and we copy half of the double buffer to userspace, so since we have two in the double buffer being store buffer and hold buffer, what happens is once the hold buffer becomes depleted, the store buffer takes its place. The packets actually get copied to the store buffer first, and they'll move to the hold buffer where the libpcap will read from it. Packets are whenever you open up a tap on a device, you're actually calling like iocontrol, and there's a pseudo device called /dev/bpf, and that's where you'll listen for your data. Linux frame processing. So, This is how it's done in Linux. We have a queue of pointers and we're passing, we're actually making two copies, one in LSF and one in the user space, so on that ground it's more efficient. We only make two copies rather than three in FreeBSD. Something to keep in mind. Alright, and so we talked about interrupt usage and livelock and interrupt storms. Here's how we can do it in FreeBSD to turn on device polling if you have an older card that doesn't use napping. What we can do is edit the kernel file and we'll just add options_devicepolling, excuse me, _devicepolling, and we'll set the rate, the CPU rate, the frequency that we're going to poll. And right here we're using 1000 Hz, every 1000 Hz we'll poll the kernel, and we just do a make build kernel and make install kernel to rebuild the kernel. And then you enable it by just ifconfig devicepolling. You can set it in rc.conf if you want to have it on boot. Or you can just get a nappy card and not have to worry about this. They're cheap, $30. OK, so another thing to worry about is tuning. So if you're going to drop lots of data, which you probably are if you're using older hardware. I had problems. I was dropping probably 1,000, 2,000, 3,000 packets every half an hour, which is not too good. So eventually I was able to tune my buffers to 0% loss by default. So one thing we can do to increase the size of our kernel buffer is we can set BPF Buffett size. By default it's 4 kilobytes, and there's the max size, 512 kilobytes. And in Linux we have the equivalent, which is rmem, is the socket receive buffer, and we have a max size. You can't go over unless you increase the max size. And then the max backlog So basically backlog is how many outstanding packets that can be addressed in memory that aren't actually passed to the IP input modules for the host stack. And then if you get into exorbitant numbers, which you probably shouldn't, you can also increase the virtual memory size to increase the amount of the buffers for BPF or Armin. Which I don't think you'll ever have to worry about that. So NIC performance can be really bad. One thing you can do for slow slight tweaks, if you're just kind of on the margin, kind of on the edge, you might be able to do a few things. If you man your driver, like in FreeBSD, the drivers are named after— excuse me, the devices are named after the driver, rather than Linux where it's eth0, eth1. If you're using an em driver in FreeBSD, it'd be em0, em1 for each card. We can actually man it and take a look at the driver information. It can give you some tune— or things you can tune, some variables, and we can set it like here, For example, my number of receive descriptors allocated by the driver is the default 256. However, I don't have one of those other two adapters that are listed up there, so I can actually increase my amount to 4096. So I do that so I have more descriptors. One thing you can do is add to bootloader.conf. In Linux, we use etool typically to, uh, for certain cards that can handle it, because etool, if you look at the code, there's like each, there's driver information for each NIC, and basically if your NIC isn't supported, you won't be able to do these things, but they support a lot of the popular cards. So you can also look at the find the driver readme file, but you can set it, etool -g eth0 gives you information. I can also set the amount of receive descriptors in the same way by just setting the number 4096 RX. And here's some of my tests. I did probably each of these about 20 times and just kind of just looked at them and said, oh, here's a good number that seems to be consistent with the others. Not very scientific. But anyway, so I'm sending— I'm using iperf, so it's actually— data's actually going to the host stack because iperf listens on a socket and data is sent to it from another machine. We just send as much as we can. And on my Dell PowerEdge Xeon quad-core 4GB RAM machine— this machine's like probably about 10 years old, 2. So that's one thing to consider. So if I write with 96 bytes, which is the default in tcpdump, I'm dropping 0% at— by the way, I'm writing to disk. I'm dropping 0% in FreeBSD, and Linux I'm dropping 8%. And if I'm writing to /dev/null, I get 0 and 0 for both. That tells me that the disk— writing to disk is a bottleneck right there. So that's one thing you've got to consider. And if I'm using the snap length, the -s0, so I'm capturing the full snap length of the packets, so 65,000-something bytes by 35, and in FreeBSD I am dropping about 1.6% of that 6 or so million, and in Linux I'm dropping 22%. Now what I did was eventually after I did these tests, I talked about how I tweaked the buffers, I was able to drop 0%, 0% loss in FreeBSD, and in Linux I wasn't actually able to get it down to 0%, I got it down to 10%. By increasing the size of my buffers. And if you're writing to /dev/null using the full snap length in Linux, it was 0.02%.
Were you using 15,000 RPM drives in that Dell?
Yes, yes they are. I'm using a standard shitbox. Okay, so libpcap. So there's a few things I actually messed up here. Well, this might not be the slide, but over the weekend I was kind of going through some code, like last night and this morning, and I found out I made some mistakes. Mistakes. So like I said, be wary of some of the information here. You'll definitely get the concepts down, most likely. So anyways, libpcap initializes its buffer to 32 kilobytes on FreeBSD. If you use the top tree libpcap, it's actually 512, whereas if you're using the one in ports, so you compile it from ports, it's actually 32. What it does is it tries to read a value from bpf, bpf_bufsize value, and if it fails, or it's less than 32 kilobytes, then we go ahead and set it to 32 kilobyte buffer, right? And we can go down here and see if you increase the amount of the BPF buffers, your system's going to use those buffers globally. libpcap can then initialize at that buffer size. It's going to read that bigger value. It's bigger than 32 kilobytes, so we increase the value higher. By default it's 4,000 kilobytes. Or, wow, excuse me, 4 kilobytes. And then, uh, what would default out of that buffer? So you have a buffer size right away that's a large amount. And you'll usually want that because libpcap can— or you'll star VPF and it won't pass packets to libpcap because it's dropping. Now, another thing you can do is if you don't want to increase the system buffer size, because it does it for all applications, you can just increase libpcap size via tcpdump with -v and you can just set the buffer size in there in bytes. Okay, so one thing that's kind of confusing to me, I was like, where the heck are all these numbers coming from? So we have, in FreeBSD we use netstat to get our drop counts, rather than Linux, everybody uses ifconfig, you can see the drop count in ifconfig, right? So netstat -d gives us the drop mount, I specified it, oh God. Alright, so anyways, we specify the interface, and you can see those idrops, drop over there. I dropped 0. This is actually the amount of input drop. This number comes from the device driver itself. Where the drop to the far right, send size, I was like, what the heck is this? Well, it turns out this is actually for the alternate queuing system in FreeBSD, which I mean, it's pretty much packets going out, so you don't have to worry about this. And we can use netstat -B, capital B, to actually get your BPF buffers. So, like, I showed that tcpdump And top are both listening on my system, not dropping any. Now if tcpdump drops some stuff, it will record it here. Because whenever it says dropped by kernel in the tcpdump stdout error, it basically will tell me— that number is actually pulled from the same place that netstat -b is pulling from. And that's also the same place where you also get the number from dev. The interface and the drop count, you can pull that number from there as well. And those numbers will all be the same. So that's from the device driver. So, and I showed at the very bottom the actual variable that we use to increment the drop count, and that's what netstat calls. Okay, so in Linux, basically we use ifconfig to get our drop count, and ifconfig reads some procnetdev, it gets its number from there, and we can just awk the first field and the fifth field in procnetdev to get the drop counts from there. You can also use etool to query the device driver. Not all cards support the drop count in the device driver, though. It's one thing that was kind of interesting. Mine did, and there's many others that haven't, or have done, haven't implemented. So, in packets captured, basically this means the packets have made it to tcpdump and they're processed by tcpdump. Be done. So that's what we want. Now if they're received by the filter, they pass the BPF or LSF filter. And dropped by kernel, there's not enough space in the kernel buffer. So if you're in BPF and you're dropping, basically that's just telling you that your BPF buffer is overflowing. And the same with LSF. Except LSF does it a little different. libpcap gets its drop count from pf packets, which is actual— if you're using socket system call, you call pf_packet, And you'll call— you'll use packet_stats to actually get the drop count from there. And we can see pcap_stats calls from psdrop. And also, one thing that's interesting is Linux and True64 Unix, they can actually get the interface drop numbers from the device driver, which puts it into /proc/netdev. Okay, enough of the technical stuff. Now we're getting into some basic stuff that we can use to increase the speed of our packet capture. So pfRing for Linux, it's a kernel module that you build, you compile it, and with this we can actually bypass the host stack and we can get really good speed. This is what I'm using now. I'm using Ubuntu Linux in work and I have pfRing compiled and this allows me to get— I can get about gigabit speeds, full content capture packet capture to disk, which is pretty nice. So we basically implement a shared memory mechanism, so we use mmap and we'll map the kernel memory and user space so they both address the same amount of memory. And we bypass the host stack. It's only if you're going to use the high-speed— there's different modes, but if you use the fastest mode, you'll have to have a pf_ring-aware driver. That is included in the package when you download the tarball. You can, uh, the drivers are included. Included. And they only support E1000, iGBE, IXGBE device, but you get that MT card I was talking about and you'll be just fine. So here's how we do it. We can just compile pfRing, and then we also have to compile a pfRing libpcap and tcpdump application so they use the pfRing shared libraries. And then we'll just put it in the kernel, give it some options, and then we recompile all our userland applications.. So basically these userland applications will actually call the shared libraries that pfRing is using. And it has to be done to get the speeds. Also we can use— there's something called pfRing DNA. I'm not actually using that. Direct NIC access is basically what DNA is. So it's the fastest— I believe it's the fastest mechanism they have right now. So we go directly from the NIC to the application in user space. Which is kind of interesting, but there's a problem with it. You can only use one application at a time. There's also threaded nappy if you're interested in that. You can also have threaded RX queues. And this is for people that use VMs. If you're using virtualization, you might be interested in vpf-ring. So basically we just bypass the hypervisor and go directly to pf-ring. And we can get good speeds that way. And in FreeBSD, we have what is called netmap. Netmap is its own high-speed mechanism, so it creates a pseudo-device called /dev/netmap, and we can get up to gigabit speeds with this. I haven't actually used this. This is something I've been wanting to do for quite some time, but I don't have the resources at work right now. But right now I'm just using Linux with pfRing, and it's doing everything we need. But I'd like to get some devices and play with this at home or something. Give it a shot, because I'm pretty excited about this. Alright, so anyways, other things you can check out is Greenmap is another FreeBSD mechanism for high-speed packet capture. It uses shared memory. We also use zero-copy sockets, but you have to have special device drivers for that in FreeBSD. Linux does have zero-copy sockets that I think work for the most part with almost everything. And you can also download an nmap shared memory version of libpcap. And typically what we're going to do for interface configuration, FreeBSD we use rc.conf So you can just set up your interfaces there and give it— pass them the options on boot. I have 6 NICs in my machine. I'm sniffing pre-NAT, post-NAT, and my wireless segment, and a few LAN segments. And basically with almost no loss. I was pretty impressed with some of the stuff that came out with it. Especially when this machine is like 10 years old. So something to consider. We can use— in Linux we can start interfacing with the interface file. You set your options in there. I didn't post my whole file, but just some Things you might want to consider. If you want to capture multicast traffic, you want multicast on. And you shouldn't have on a passive interface, you're not sending anything out, you don't want ARP. Why the hell would you have ARP on? So just turn it off. Just some things like that. And you can also do, if you have two switches for instance, and you want to listen, say a switch is hooked to another switch, if you want to use a SPAN port out to the monitor, you have two cables, two NICs for this, what you can do is you can combine these two interfaces into a virtual interface. You can use bonding or bridging. And then so you can just listen on that one interface and get the data from both switches. Here's some useful applications. I got the ones on the top are the ones I actually got compiled working well with pfRing, Snort, ntop, you know, just your standard stuff. On the bottom are things I'm going to work on. I haven't had time yet though. So, ntop is a really good program if you haven't used that. So this is bringing on a few applications that you might consider that might be valuable to the organization. ntop is, I think most people are familiar with this. The ntop development team is actually the team that does pfRing, just so you guys know. So here's my configuration down at the bottom. The important thing on this is the -m, because by default it will aggregate all the data from all your interfaces. Interfaces into one collective entity in ntop where I actually want the statistics from each interface because I have different— say I want to know what packets are coming on and what rate on my wireless interface into my LAN. I want to know all these differences, right? So I pass a -m to stop aggregation and then I can just listen on each one. And then you can pass an option to switch NICs. NetSniff-ng. So this is a new tool that's out. I actually can write to disk just fine without pf-ring using netsniff-ng. So we just use the zero-copy mechanism, and basically as long as your kernel is compiled with config packet mmap, which it should be most— I think that was implemented in 2.4, so I think everybody should be— or most distributions include that right now, I believe. So you probably could do full-content packet capturing with just netsniff-ng. So something to consider. And it writes to libpcap files if you need to. And it can read from them, so that's really nice. So Marty from Sourcefire developed this Daemonlogger tool, which is another tool that basically can be daemonized and sits in the background and does full content packet capturing. Something that's pretty neat. Etherape. This is one of my favorite tools because you can actually get a visualization of what's going on. And I like the laser beams like Star Wars or some shit. So that's pretty cool too. IFTOP is for session collection. So we can see what sessions are on, HTTP sessions and blah blah blah, and see what kind of bandwidth they're pushing. It uses a little bar graph. That's pretty nice. You got a few options. You can actually do packets rather than speed and stuff like that. iptraps is another big session tool. It can do protocol distribution statistics and all kinds of cool stuff like that. And trafshow is just another session tool. That I like. This one I like specifically because you can— there's a session going on like an FTP transfer. I can just find it on there, press enter, and actually I can get the hex values, the ASCII values of the session and see the actual application data, which I think is kind of cool. TCPick is another one. So we can actually copy application data to disk. So if there's a— we're transferring a file out from our network to a remote system, I'm actually doing full content capturing, I can actually pull the binary out or whatever it is, whatever file type it is, and write it to disk for analysis when I need to. TCPstat is another one. So we can use a pcap file and actually run TCPstat on it and get statistics and nice little charts. Speedometer. I think this looks pretty. I just kind of include it. I don't really use it, but I don't know, it's kind of cool. So I put it up there. bmon is a bandwidth monitor. This is just like Speedometer except it gives you an ASCII chart graph on bandwidth usage and stuff like that. And it also has statistics down at the bottom on errors and the amount of frames and packets processed and stuff like that. And questions, comments, and criticism can be sent to my Gmail account. And I'll actually probably be writing all this up into a guide if you guys want to implement implement this. This will be probably just an article. I'll post it on one of these, probably both these websites. If anybody's interested in the academic papers I went through, I assume I got most of it correct. They're stored here on this Network Labs website in a directory. There's many, many documents there. You can also grab some of that. If you want the guide, I don't know when I'll have it written, but you can email me and I will let you know whenever I have it out. I'll email you back if you're interested in something like this. Just based off my knowledge. I'm not an expert though, so. That's about it. If you guys want to come talk to me later, we can talk about some stuff. Any questions? Are you interested in employment opportunities in Charleston, West Virginia? I don't know. I'm teasing you. Alright. We should talk later. Same. Thanks, Jon.
More from Jon


What No One Knows the Podcast / Vodcast featuring The Tampa Bay Wave and Jon Schipp

Meeting the Exposure Management Challenge: Key Use Cases for Success | @OfficialRapid7 #SolutionSpotlight

Spot Security Control Gaps and Non-Compliant Resources Across Your Attack Surface






