LUG Meeting (strace) 02-16-2015
Logan leads a Linux User Group meeting covering Docker 1.5, SSH hardening, and strace. The bulk focuses on strace: how ptrace works, common options like -f and -c, reading output to trace system calls in programs like sshd, and using it for security analysis. The group also demos Boot2Docker on macOS and discusses seccomp filters for containers.
Chapters
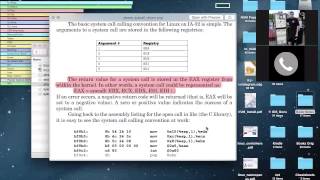
Alright, it's Logan again, Linux User Group at URUC. Group updates, I didn't list anything here, but there is one, and that is we are in touch with Calvin about our system that went down last week, and I think Wheeler and I might go visit them tomorrow, depending on how busy we are. It looks like I got a working Xen Xen cluster up now, and I'm going to integrate, I think, the system that I was going to use for OpenNSM to log so we can have redundant log cluster for our virtual machines. So hopefully that will be done in the next couple of weeks. Latest in the news, not really a whole lot here, but we got Docker 1.5 was released. It has some really interesting stuff. Most specifically, I want to point out with the read-only containers. And the stacks. Let's go ahead and take a look at that link here. So, uh, this IPv6 support, uh, but now aside from that, you have read-only containers. So you can pass this --read-only flag. That allows you to allow restrictions to the location that an application can write to in the container. So fine-grained controls for that. So if you have a data web app or some sort of application that's serving users, like web application, and you know that it only needs to write to the log directory and the directory maybe that users can upload data to, for example, then you would put that there because you only need write for those purposes. So that's a little bit of our improvement in security. Also, I'm really happy about, because it's always a pain in the ass to get stats on what's going on inside your containers. The new stats API endpoint is really neat. If you take a look at the screenshot, it's got per container CPU in this column, memory usage in this one, and it has a percentage as well as network input/output to the particular container. So that's actually really nice to have. Before, you had to query, I think it was a procfs or part of the cgroups inside procfs where the information is a pain in the ass. So now we have it nicely available to us. In the Docker command line. Also, this is a big one for a lot of guys who work with Dockerfiles is the ability to specify more than one file with Dockerbuild. So if you have files that rely on another Dockerfile, you can use -f and specify each file individually and build the container like that. So if you have separate Dockerfiles for testing or et cetera. So that was a big one right here. And then they're now doing an open image specification. I imagine this is kind of a response, probably just a guess, to the CoreOS Rocket and their image specification. And that's one of the complaints is there was no specification. In this case Docker says, "Oh, well, we're going to have to do that." Because that surprises a little, I imagine. Anyways, but that's that. And that is out now. So 1.5 is out. You can add their PPA, throw Ubuntu. And go ahead and use it. Moving on to education epoch, this is where we talk about educational resources, paid and non-paid. So Udemy has a lot of courses that are paid, but they're really low in price. So if you're interested, and your work provides maybe some staff development funds or such, these are really easy to obtain and for a low price, less than usually $100 for a lot of them. Command line basics, learning Linux Mint, learning cracking Wi-Fi passwords, keys, not exactly Linux related but they're probably Linux tools, learning Ubuntu, etc., etc. There's a lot of stuff on networking too. So if you're interested in improving your networking knowledge, there's some stuff like obtaining the CCNA test. They have, they also got masking and security, $49. They have a lot of good resources. And I know a guy at work has taken some and he's enjoying them so far. I think I'm actually— I was originally a network guy. I kind of got out of it and got more interested in security. But I had the goal many years ago when I was studying networking to get my CCNA because I wanted to work at an ISP or something. Well, all that changed. But I still kind of want to get my CCNA, CCNP, and eventually CCIE just because I want to keep up on that stuff. And Cisco is a major player in that world. So they got a lot of those for pretty low cost here too. $9 for this one, Virtual Private Networks. I mean, it depends what you need. But let's— are you done, Nate? This is a free one. This is a guide put together by a bunch of Linux networking guys. And this is the Guide to IP Layer Network Administration with Linux. So they have it— HTML and PDF and PostScript or whatever else. But I'm actually going to read this entire thing because I really like this. It's got a lot of detail inside Network Linux kernel and how to interface with all that. Covers all of the standard tools for network debugging like those listed right there, etc. But it really focuses on the iproute2 package. They got the IP tools, right? ip route, IP rules, tunnels and VPNs in Linux, VLAN management in Linux, all that good stuff. So I'm definitely going to read— go through this soon. So anything for prop period? Waylon's going to cover SSH section. Yeah, so I just included some pretty simple keywords that you can put in your SSHD config file. One is to display a banner when someone logs in. You might want to do this for a few different reasons. Some people like putting a friendly message. The more practical application is that you can also put a disclaimer of basically no privacy when you log in. A lot of— excuse me— as a method to, one, reinforce policy amongst our user base, as well as to reiterate the fact that systems are in fact private. So in the event that systems are ever breached, they can then enforce legal proceedings against that person in theory. Yeah, I used one of those for our controller in the research lab. I created a shortcut, an alias to run the command so they didn't have to search all around. I used that just like normally logged in, said, hey dummy, this is how you start the thing that you want to use. Yeah. Right. And so you just do that by saying, using the banner keyword, and then you follow that with the directory or the path to the file, the text file that you want to contain the text. Like I've got a couple of VPS hosts and I put some fancy ASCII art in mine whenever I SSH to them. So it's fun either way. So the common place that you can put that file is in /etc/ssh/sshd-banner. I'm pretty sure you can put that anywhere you wanted to, but that's sort of the common directory where you might The next one is the print last log keyword, and there are two options here. You can say yes or no. This basically just shows the last time a user logged in. So I recommend leaving this on. Once a user logs on, SSHD will print the time of the user's last logon and where they logged in from. If you want to turn this off, you can say no. Like I said, I recommend leaving this on. A lot of times if your users are logging in, they can alert you to something that's wrong or a potential compromise if they see some unknown location where someone SSH'd into that box. Are these just all bash variables or? No, this is in the SSH configuration file, sshd_config. It would be in /etc/ssh/sshd_config. And that should be the same on Debian-based systems. As well as Red Hat. To build on that example, I wrote— a former company I wrote a shell script that whenever they SSHed in, it would print the last login time and the IP address from which it logged— or which the user logged in from. But it would have a prompt before they can actually get a shell and say, "Did you do this? Is this the last one?" And if they type no, it would actually send an email to me, so I would know how these were notified immediately if there was somebody that did not— that was not logged in last. So just kind of a quick way to give it to the admin checkout kind of thing. So, great. Yeah, good option to have. So the next one is the max_authorize keyword, and you can put this in your configuration file to specify the maximum amount of time someone can try to authenticate to your SSH daemon. In a single connection. So the default is 6. After half of a user's permitted attempts in a single session have failed, the system will log further failures. After you meet the threshold which you've defined in the configuration file, it will just drop the connection. So this is also— this would have been a great place to put this. I guess I can talk about this next week. There's a tool you can use called Fail2Ban. Basically you can specify thresholds for how many times people can log in. You can set it really low, really high. The idea is that once they meet a— once a person or a bot or a piece of code meets some specific threshold trying to log into your SSH server, fail2ban will drop a connection and then create an iptables rule for that IP address, basically jailing them so they can't attempt further connections for a pre-specified amount of time. Oh, oh, WebSec is another tool as well. That's specifically on failed login attempts? Yes. How common is SSH as like an attack vector? Is it really like— It's very common. Oh yeah. Is it like the initial attack vector or is it like they already have login information from some other source and that's just how they use it and then you catch it then? Usually what you'll see is like scanners And it's just basically port knocking for— you're looking for open SSH daemons. And once they find one, basically they'll just brute force that daemon using variations of different usernames. Talk about that example you gave me earlier. Which one? You put that host up, turned off— instead of simple password. Oh, right. So one time I got curious because I see a lot of this at work and sometimes researchers will put Linux systems online for no fucking reason, sorry, for no reason, right? They don't know how to run them and they're like, oh, I don't know how I got compromised, and then come to find out they have some really weak root password, they're not using things like Telnet and IP tables, and not even behind a firewall. And so I got curious, I was like, well, if I set a really weak password and I just set a post out on the internet, exactly how long would it take for this thing to get compromised? And so I spun up a VPS on my DigitalOcean account. And I think I set the root password to something like "cat," and I left it open to, like, be accessible from the world. And then within, like, 10 minutes, it was already compromised. And I was using a utility called Sysdig to monitor what they were doing. And so within, like, 20 minutes, my host was already being recruited into some botnet. And, like, I could see them pulling across some toolset and using it and executing it against other hosts. And so it's really that simple. Basically, you're just recruiting computing power. They're basically like these low-skill, low-focus attacks that are just trying to get rid of the easiest things they can get a hold of. Yeah. So yeah, just to give you an idea of like how easy that is to get compromised in that way. It's pretty trivial. Here's an example up here. This is some of my systems I have online in EC2. I get these emails all the time. So someone attempted to connect by SSH. You can see the program here, the PID number, but using the username Hadoop or BinBig, Kenny, Kinley, Hay, and they do this over and over until they find out, you know, one that works and with the appropriate password for that account. So root tours keeps falling. So like the idea is not to like prevent attacks. I mean, you can, with things like two-factor authentication and TCP wrappers and things like that, you can You can make things really hard, but the idea is to slow them down enough that it's too costly and time-consuming to compromise you, so that they just move along. Even if you just set the default value to max auth tries 6 and just left it on the internet, that's still not really sufficient because they can just keep reestablishing connections. That's pretty trivial. So you'd still want to do things like use fail2ban. Fail2ban actually has a default timeout of something really ridiculous. So you can even set that up to a whole day. So if they hit your clipping level of like 3— so on my personal host, I set it to I think 2 attempts before it clips you out for a day. And then so if you sit there and bang against this thing and then 2 times, that one IP address is banned for a whole day. And so even if they did get a successful authentication try, they still have to have my second factor. So it's just practically impossible to do that. Sorry, that was kind of a long-winded response. That's what I was hoping for. Thanks. So the other keywords that I would call your attention to would allow you to restrict access by users or groups. And the practical application of this from an administrative standpoint is that sometimes you might have users— or you might have applications on your system that use accounts from the underlying operating system. But you don't necessarily want people who have accounts on your application from being able to access your platform. And so what you would do in this case is you would modify your SSH configuration to not allow those users SSH in. So you could use something like deny users and you could specify each individual username or you could use deny groups and you could do like a group-based permissioning scheme. On my host, since there's only a handful of people that use them usually, usually it's just me and then I have a couple at work where there's like 3 or 4 people that use them. I use the allow users directive. I don't even bother with the group. I just use allow users and then what I'll do is put each individual username in there that I want to be able to access that host. And so basically what that does is it creates a default deny of anything that's not one of those user IDs. So it's basically like this whitelist. One of the things you can do there for the allow users directive. So we talked about like not allowing root logons over SSH. One of the things that I'll do in my SSH configuration file is I'll say allow users and then I'll say root@127.0.0.1. So I'm basically saying you can only become root from localhost. I'm also saying— then I also give it my user ID and then I can restrict it to a specific IP address, right? You can even give it a CIDR notation as well. So if you have an entire net block, I guess /24, that you might have some dynamic IP address that comes out of, you could give it that entire CIDR notation and say this user ID can SSH in from this network. Or you can narrow it down to a couple of IP addresses. If you wanted to. And I haven't tried that with groups. I think you can do the same thing with groups. Like you could say allow group from this CIDR range. Can you? I actually don't know that. Yeah, you can. But let's just show you how. So the NAT directive will tell you, so everything below here tells you what's, what words can be used. You can see that deny groups is here and then allow groups is here. So it's only a subset, so not all options can be used with the match keyword, but the ones that are listed under here are the ones you'll want to use. So in that case, those two are. So yeah, that's all I had for this week. Okay. There was another thing to build with the issue file. That's actually different than the banner, but I can't remember what the option is. Oh, maybe, I thought there was another, maybe I'm wrong, but I thought there was a different one where you can read NC Issue, but you can also read a banner, but actually NC Issue presented the document before the banner would actually come, but I'm having trouble finding it. I might be wrong on that. Hello, buddy. Good to see you. See, Launch comes after you log in. It's from Etsy issues for legal warnings to establish the terms and conditions. Okay. But I thought there was a separate option in bulk reading that file. Let's see if there's a man page for that. Man, man kissue. No, that's not the way. No, let's do— That doesn't work on the BSD man, does it? Okay, well anyways, man 5 issue maybe. Okay, anyways, there's no good mic to pick up on that. I guess there's not. It is just banner. Moving on. Shell space. So I wish Lucian was here. I think he'd be excited about this. But there is a bunch of shell functions called— put together to make a shell library called Shellfire. And you can see the description of the repository of namespace composable bash, sh, and dash function libraries. So I'm going to try to play with this a lot. I write a lot of stuff in shell. We can see that it has a list of things that come with it. So the core comes with a bunch of Base64 decoding functions, full-fledged command line parser, dependency framework for document— or for finding the required binaries. A lot of the stuff you would do by hand, which kind of sucks, but this is nice to have a library for all these common things. Also terminal error color-coded messages, which is really interesting, and I actually might, may use that for Eyelet or some of the things for Eyelet. Validation and path testing, byte functions for setting and testing bits, compression, curl functions, CQ cutting functions, JSON readers, JSON writers, all the stuff written in shell. So it's designed to be portable as well. I think it's focused on POSIX. See if I'm right. Yeah, MIT license server for building modular applications and POSIX-compliant shell scripts. But that's excellent. So that is really cool. Hope I'll plug this in the future and be able to demo some of this stuff because otherwise it's a pain in the ass to do all these things. I've been writing my own functions and using them a lot in my scripts, but having something that's done has a lot more ease. So we got a new meeting section now called Container City. The corner was already taken, so that was the next best thing I could come up with. Um, save your country. Sounds worse in City. In the Corral. That's not bad. What was that one? I don't know. Container Cooter. Container Container. Container Container. That's kind of funny. Containerator. Container Corral is not bad. Um, but, uh, So in this one we're going to talk about a tool called Boot2Docker. And it's a way to allow you to run Docker on OS X or Windows. So you would have Docker command line client and it would talk to a Docker daemon running directly in the VM. And it's actually super simple to get started. I just have to download the package, next, next, install, and then I can use it. And we're going to go ahead and switch over. Speaking of which, I got this nice little terminal program. I have a plugin to Terminal OS X, so I can set hotkeys and bring down Terminal whenever I need it. Oops. So that's kind of nice. If anybody's interested in that, it's called— Talk to Graphene? Yep. So it's called Total Terminal. You can set it, your keys you want, and it's really nice for doing things without having to switch over. So we'll create a new one here. And boot2docker— let's go ahead and increase the font size a little bit. And type help. There's a big help here. And we're going to say, um, info. Show you what we have. So you can see I already have a VM, a boot2docker VM. Tells you where it's at. CPUs, memory, all that is already configured. And then I can do boot2docker up. What it's actually doing is bringing up a virtual machine that it maintains in VirtualBox. There we go. It's got the keys. These are some variables you can set to connect to the virtual machine. So we're going to go ahead and export these variables to our shell environment so that when we invoke the program next, it will be able to pick those up. Right? So then what we're going to do is we're going to do help again. Again, take a look at the options here. And at this point, the system is up and we can— there's a few things we can do. We can power it off. We can upgrade it. We can check the IP address. There. What we really want to do is we want to play with Docker. So docker ps actually gives me the information running inside that container. I don't have really anything there. If I do docker pull, I want to pull down, say, Ubuntu. It's actually letting me work with Docker directly from my shell inside the VM. So this is a— if you're on OS X, this is a great way to play with Docker. It's going to pull down that VM or that Docker image. And using this, you can also support MyProgramIslet on OS X if you wanted. You just have to find a way to get for the SSH connections coming into that program, and you can do that via the pf or changing the ports in sshdconfig, I imagine. So, but this is beneficial. You don't have to fire up a VM with Docker every single time, so it's quick quick access to it. Alright, it's up and running. So now I can— let's see, we can do docker it. We'll get interactive terminal. Run. I want to run Ubuntu image and I want to have it in shell. Oh, docker run. Whoops. Wrong order. It bash. And now I'm inside a Linux container inside that VM, right? So that's kind of cool. Alright, so I can do things, apt-get update, and directly interact with the system. Which this is a container running on that host system. So yeah, I'm going to quit out of that. You can see now that— we can do another one too. We can do, let's just run— sleep 20. You want to sleep for 20 seconds. And then we want to add it to the background, right? So now it's running on your docker ps. It tells you which container is running. You can see that this is the container that's running that has the sleep command. And as soon as the sleep is done, it will actually exit. So that's a nice little program if you run OS X, which is a great operating system, I think, especially if you're a Unix guy. Host is compliant. It's got all the 3 BSD userland tools. And there it's gone. All right. And then we're going to go back and we're actually just going to shut it down. So I think it was a boot2docker down. And then that's just going to shut down the virtual machine in VirtualBox. So that's the boot to Docker demonstration. And now we have— well, by the way, does anybody else have anything to talk about? Anything interesting? You got something? If you refresh it, yeah. Oh, let me check it out. I don't know if I'm going to follow along. All right, cool. Sounds good. Thank you. You're going to do multi-threading? Multi-threading. Go ahead and bust through Vim because it's only got one example right here. So there's a problem that people come across often with Vim is that whenever you highlight something or delete something, the contents are put inside the double quote register. And the cool thing about this— well, the bad thing about this, if you want to paste it over something else, if you want to highlight something else and paste it over top, that new thing is stored in the register, which— so you have to keep going back and forth between it. But if you use another register, you can store two pieces of text. By default, anything that's removed or yanked is stored in the double quotes register, but it's also stored in— and the empty part is stored in the zero register. So using this, we can then paste the other thing using this command right here. So then let's just open something up. What do I got here? I don't get any notes. Let's take a look at this. So I want to Take the static thing, right? So I'm gonna remove that word. Hey, DW to remove the word. P paste it, right? So I can paste it. But if I want to replace it with something, let's say, let's replace DW with this static, okay? It replaced it. But if I want to store it, if I want to replace something else also, I can use the other register to store something. Registers. It actually shows you the available registers in Vim and the default register is this one right here. And then you have all these other ones. And you can see how if I type colon registers, it actually tells you what's storing those registers at this particular moment. So which is really nice so you can go back and use these things so you know how to store them. So I just took the— we'll do this again and replace it. So I want to replace, I want to yank this, so I'm highlighting, I'm using V into the end of line, back in a space. So press Y now, it's yanked, and I can P to replace it. But I want to now highlight another one, go back one, and then I want to replace it from the zero register. So I do, there we go. So what I did was the I type this command, P, and that is— this is the register command. It tells you what register to pull it from, and this does paste. So using that, I'm able to paste different things. So I can have one thing in one buffer and then have my other yank text in the zero buffer because by default, as soon as you yank something— so if I type Y right here, YY, to yank the whole line, and I paste that, I got the whole line yanked. That is in the double quotes buffer and it is in the zero buffer. So register— you can see right there evidence of that fact. There it is in the double quotes buffer and there it is in the zero buffer. So this is a way that you can delete something and then paste it in between. Because if you deleted something, what would actually happen is as soon as you delete it, remember by default it goes into the double quotes buffer. So as soon as you delete something and paste something over top, that's now replaced whatever you yanked prior because anything that's yanked is also automatically put in the double register. So what you have to do is you can store it in the zero register and paste it right over top. So I guess we can try to illustrate that. So I want to remove this. I want to copy this line. I want— oh, I want just this end part here. So we're going to yank this word. Okay, so that's just the word YW, the copy of the word is what the ink is. Now I wanna paste it right over this. At this point in time, look at registers. You can see that when I copied it using the ink command, DRVD is set in here and DRVD is set in here. But what happens if I delete the auto? DW deleted. Now look at the reg— whoops. Now look at the registers and you can see DRVD is now in here and it's lost from the other one. So what I have to do though with the paste is I have to go recopy it. Or in this case, the trick is you can just use the zero register because it's copied there as well. And all these things that are yanked are by default put there. So now what I can do, I can just paste in there using Shift+V. And it's right there. So, oh, oops, that's not the right one. So zero, sorry. There we go. So zero, so that's how it went. So I had to paste it from the actual zero register. So I— when you're working with configuration files that are long and you need to change something, and a few things, just a few lines, and lines are different, it's easy to actually just copy it once and then delete it with your movement commands and then paste it with that from the zero register. And the other thing I wanted to recap on that we didn't really talk about— Musha mentioned briefly last week, but I've been using more now that he mentioned it. Is the ability to— when you're on a command, you can pull up the man page. So what you have to do is do Shift and K. So that pull— I did that on top of the echo word right there. Just Shift K, capital K, and it actually brings up the manual page for that or whatever you want. So it's really nice when you're working in a configuration file that references other configuration or other programs so you would know immediately how to work with it. So for Modprobe, that's not one for DSD, so you won't find that. That's not on BSD systems either. apt-get is not. wget is. So you can think of what wget may have changed right there. So that's really handy if you're working on a Linux terminal itself, a shell. All right. I'm going to go ahead and pass it over to Dave. Which will not be recorded. I apologize. And wait until we get to the good stuff. You get to see that look every day. The last talk we had,— is on strace. So we're going to talk on the syscall— system call tracer. Go ahead and get to a VM. Enter, bigger it up. Test VM here. Do you even know who this 4chan is? I just love that shit. It's like, who is this 4chan? Your pictures are out there in the ether. Yeah. But, um, I mean, they can't do 5 minutes of Googling it would require to understand. It's not a person. Or it's just an administrator. Okay. Today we're going to talk about Systrace, a system call tracer that I've been playing around with. And I'm going to be using some notes from a book I'm working on reading that we talked about before that I highly recommend for everybody that's interested in Linux debugging. But it's called Self-Service Linux and it now has an open source license. —go ahead and pull it up here. Do you think this also might have an application for looking at like what we were talking about with the side-channel attacks on containers? What's your question? Like side-channel attacks on containers, like could you use this to kind of see what containers are doing? Systrace, it gives you every system call. So if it's making a system call, you can see it.— other things I wouldn't be able to do. But there's other— there's all kinds of other tools like ltrace which traces functions and there's like profiles and stuff. But highly recommend this book. It's in our link notes from a couple other meetings actually. But it's very easy. It also goes through the stack, GDB, system call tracing, compiling, compiler optimizations. It also goes through all the kernel stuff and the proc files. There's a whole chapter on procfs. So if you read this, you can also use this for Proc Query. Sure, there's little things that you've learned. Highly recommended. But let's go ahead and get started. So I'm taking some notes from that book and this will help reinforce my memory of it by using it here. So let's go ahead and go to book notes and I'm going to pull up this particular book, Subsystem Linux. And first we're going to begin by talking about what a system call is.. It's a special type of function that is executed in the kernel. So your operating systems, or at least Linux, will have a number of system calls. And there's a table of them you can view online if you just look online. So you can do system call table. And there's different ones for different architecture and type of— so x86 versus 64-bit. So let's look at the system call table. You can see that they are numbered and this is because they are indexed by number so it's faster lookups. And you can see here that there is at least on this guide 190. I've seen other ones with lists of about 200, I think. And each of these invokes the kernel to do something. And a lot of these are used in your applications like reading into data, writing writing to disk, all right, if it is some memory segment, something like that. So these are what we use a lot when we interact with the operating system. We ask the operating system for resources and the kernel will grant it to us if we have the appropriate permission. So this is what system calls are. They're not too much about it. We can also look at the man page of a particular system call like read. You can see that it's in the programmer's manual, which is section 2 of the man page. And this reads from the file descriptor. And Devin gave a talk on using the Linux APIs and basic system calls in the past. So here's the man page for that. So what sys trace does is actually you give it a process to attach to and it then reads out all the system calls that it makes. So it gives you debugging information and it can also be used from a security standpoint for malware analysis We're just gonna figure out what the binary does. But it actually has to be— the information is only useful if it's within a system call, right? So we'll do a simple one. Let's just system call sleep2, right? So what actually happens here— actually, I'm gonna go ahead and less it here. Oh, hold on. One thing to note, you can see how ugly this is. It actually wrote to standard out standard error, not standard out. So you actually have to redirect that if you want to look at it in a pretty way. So redirect that to standard out and now we can sort through it. So here what actually happened was sleep, the bin/sleep program was executed using the execvp system call and then try to access some libraries. So you can see it tried to load this and try to grab the preload caching stuff, the SO.cache from the shared object. And then a bunch of other stuff. Eventually it closed that and then it started asking for more information. It also needed libc, right, so the libc library to get more calls that the actual program runs itself. Then it re-created some bytes. And you can see here, read right here is actually reading in the binary itself and this is the actual ELF header, the ELF format right here. Then what actually goes on is it's gonna continue to load until eventually it does what you want. And what actually sleep does, the most important part of it is the nano sleep command. Or nano sleep function. And you can see that it was passed these two parameters to the function and the value of null. So that's what you pass your programming command line. Let's see. And we can look at nano sleep here if we wanted to. So let's click nano sleep. You can see it's a high-resolution sleeper. Sleep function. And then you can pass those two parameters that it was passed, right? A struct to time spec and another struct to a pointer to rev, which rev, the value that is used to call nanoSleep again and complete the specified pause. So this is where we would have the actual number, it looks like, that's been inserted into the time spec structure that's read from. So That's Systrace in a nutshell. There's a number of command line options that a lot of people don't really know about or don't use. But a few things, we'll talk about a few of them real quick here. But one thing to note before is how Systrace works. So, anybody know how Systrace works? There's a special kernel facility that it calls that allows you to attach to the system call prior to exit and prior to entry. And that is what allows you to log it. That special kernel facility is called ptrace. So what actually happens is when you call strace, it does a check to see if ptrace was enabled, which strace, when you call the program, invoke the program strace, it enables ptrace. And we can take a look right here at this screenshot. You can actually see that on a system call entry, Here's where it detects for ptrace sys, right? So it tests for that and that is the result of whether it's going to have ptrace enabled in the kernel, which actually allows for every single syscall, the program will stop prior to the syscall and after the syscall and record that information. So you can see again, they have it highlighted here. Test B instruction test to see whether ptrace is turned on and this is in the kernel right here. And then what we can actually look at is a few more— not that one yet. Okay, so a little bit about calling conventions, or at least on the x86 platform. So the result of it, the actual error or the return code of a system call is stored in the eax register. And there is no limit on how— or there actually is a limit. I think it's 6. X86, 6 potential parameters from registers that you can pass into it to assist in calls. So in running an assembler, you actually push a bunch of stuff on the stack which are the parameters of the system call and then you actually call the interrupter that actually generates the system call or executes it. And in the x86 world, it's called int80, right? So hex 80, integer 80, that's what actually invokes this. And if the system call returns true, then you have a 0 or positive value inside the eax register. If it is false, you will not have that. You'll have a, I guess, -1 value. So you can actually take a look at the assembler at the bottom. We're actually moving some values into the edx register, then the ecx register, and the ebx register. What is actually happening is You're actually just passing the parameters to the system call inside the registers and then finally what you're doing is you call INT 80 which invokes the interrupt controller to actually execute the system call. Those items are available and then used to execute that system call. So that's in a nutshell how it works. There's some special return codes too like the value of -32 means ERR_NO or error no or E-N-O-E-N-T if you're looking at the programming manual. And that's just the ways of looking at— I've had debug programs run through an error code before where it actually meant inside the manual page for the function, and this actually tells you where it stores within the EAX when it returns. It might help you understand how the function itself or the system call itself failed. And then finally, just a little bit more about this int 80. So the int 80 instruction, as it says in the highlighted parts, traps into the kernel and invokes hex 80, or 80 in the interrupt descriptor table, which according to this particular file on hardware interrupts in the Linux kernel matches this syscall vector. So the value of this definition in C syscall vector is set to 80. So anytime syscall_entry_vector is used in a program, it's been replaced by the C preprocessor using the value 80. So that's how you know what the vector is for syscall. So in x86 systems, it is 80. If you're more interested, curious, you can take a look at /arch/i386/kernel/intro.s in the kernel source code for more information about this. So first things first, Devin talked about forks and by default whenever you attach to a process that is forking, SysTrace will not give you the system calls of the forks. You have to pass a specific option called -f to actually get the information from each fork, right? So by default it does not do that. So you can pass -f and it's always recommended, let us do almost always do that as a good have it so you never have to have a situation where you forget to pass it and you don't get the extra information from the fork processes. Let's take a look at another one. Xtrace. We'll do ls -l and remember it writes to standard error so we need to redirect it to standard out. And again we're executing it. We're then trying to access all the shared libraries so that we can— so the program can load the functions it needs to actually execute itself. And then maps itself to the memory with the mmap system call, etc., etc. There's more caching information, access to those shared objects, and then reads in again the binary, the ELF binary right here. And then we're gonna kind of jump to the end here and see how— what XLS is doing. You can see all these opens. So it actually tries to open the file. You can see that we actually get the return code in these cases, ENOENT, which we talked about, which actually translates in this case— SysTrace will actually look up what that means. In this case, it's no such file or directory. So what actually happened is ls tried to open up a bunch of locale information from your system. A lot of programs will do this. They want to read the locale variables in your environment to determine certain things such as An example is setting LC_— I think it was currency. So if you're terminal prompt and the program is taking actually just the dollar signs and all that, so there's things specific to your environment, languages, etc., like LC_LANG. Well, in this particular case, you can actually see that it's trying to open the locale databases right here, but it's failing because in this particular location they do not exist. In a lot of cases, you'll actually have this because what Linux— all these programs will do is they'll try to search for all the— where those standard locations are. Files and they may not always find them because they may not always be installed. Then what actually happens is the big thing here is fstat, I believe, and that's the function to actually get information on the file that we want to see or the ls command. So based on this, what we can do is make sure we understood how ls kind of works at a very high level, right? We don't need all the functions inside the program, but so we get the important syscall information. And then you can actually look here to write. So this is what actually is printed to your screen, right, 'cause we're writing. And it's actually written to the terminal. So this actually gives you the values that are written to the terminal right here. And then finally the program is closed, it's unmapped from memory, and then I guess that's the calling process or the caller that actually closes right there, I'm guessing. So in this particular case what we can do is Let's look at the fstat manual page. So get file status, that makes sense, right? You want to pass in a path as a constant character, right? For example, we're going to just do stat, so that would be path to the file, right? So you can store that in a character array, and since that's a pointer, you can just pass it that way. That gives you information. And the other one, which write, is a— well, we need to do that, the to write, because that's a syscall write. Writing to a file descriptor. In this case, it's printing to the terminal. But one thing you might notice that it actually didn't print everything we wanted. Let's go ahead and also point out an option strace has for writing to a file. So we can use the -o option called strace.log or let's do ls.log and then we do ls -l and it's gonna write to the file. So now we have ls.log here. And if you look at the bottom here, right, it doesn't look like we got the full system call. You see right here the dot dot dot. It didn't actually show you all the arguments passed. And that's by default. Systrace does not show you every single thing. You actually have to pass an option to allow you to see everything. And the cool thing is you can actually limit it on byte size. So -s is kind of like zap like the tcpdump. So if I only wanted to get the first 10 bytes of a system call, I can do this and now I can open strace or ls.log and you can see— that's not right. Let's go— I mean, it's the right option. -s. String size, specify the maximum string size to print. The default is 32. So it prints 32. File names are not considered strings. They're always printed— well, let's try this. I don't know why I've got strace. Let's do -s. Let's do 10 bytes. Let's do 5 bytes. And ls -l. 1 byte. And it's printing last. So actually the system call gets printed. It gets printed no matter what. What we want to do is we want to print more. So we want to do -100. And now if you look for write, you can actually see everything that was passed to us. Here's the string, right? It wrote to file descriptor 1, and then you can see the whole string all the way down with the newline in this case, and then parameters passed as well, and then finally the file name itself, ls1. And prior to that, we did not see the extra information because we said, hey, we want to add an additional number of bytes to print to the screen. So now let's talk about a program that forks. Well, you showed just strace. We have a— does anyone know anything off the top of their head that forks? Steve's mom. I was gonna say it. Oh, sshd forks, right? So let's attach to that process. So you attach to an existing process, right? So sshd is right there. You can attach to that. And the highest priority— well, let's say the parent. I don't think that's right. So we'll do strace -p -f and then we'll attach to 16. You can see that it's actually doing stuff. The daemon is actually running. It's reading data, writing out other data as long as it's customizable across the network as I'm connected over SSH, right? Stop doing that before you hack into the mainframe. But, um— Hacking with Gibson. So that's really interesting. And then finally, a few more things on static libraries. So statically built programs do not use shared libraries. Everything they need is built in statically and compiled that way. So one thing about this when you use strace is that it will not go through that whole process to try to open all those library files that it needs. It actually— the output will actually be cleaner. So that's just a little bit— that's just something to note as well. Another thing is— I think we covered all that. Let's go to my desktop here. There's a few other function things for debugging. Before we do that, I'm gonna try to catch your interest again. So we're gonna strace a program where we can actually read the password in from the system calls. So this is an example of using strace in a way referred to as security. So we're gonna call it password.log. And what we're going to do is we're going to— we're looking at the password command and we're going to reset my password. Okay, update successfully. Now let's take a look at the output here, the log file that generated. We want this read system call to see what it read in. And let's go to the very bottom because there's going to be a lot of stuff here. There it is right there. So first we're looking at the write system call and that's where the program— let's go up a little higher here, that's the verification. We want new Unix. So enter the Unix password it asks, right? So, and the parameter passed to that system call is the number of bytes, I imagine. For this. It was 25 bytes from start to finish. And then what happens is it calls read to actually get the password. The password I typed in was "vagrant," right? And then later on, again, we have to retype the password now, and now that has 26 bytes passed to it, and then again, "vagrant" as well. And as well, you can see what also it is, you can figure out how these programs work. It actually has a lock on the password file so no one else can edit the same time. So it sets that. But not only that, but opens the /etc/passwd file, opens the shadow file, opens /dev/urandom, and then it actually reads in the value of the shadow file. So the existing, by username, the hash of the password. So the first option is the algorithm or the cipher. And $6 in the Unix shadow file is— does anybody know? SHA-256. And then the shadow file, the next field, does anyone know what that is in the shadow file? Salt. Salt. And then the final field is the hash password. So these combined are— it's checking that. And then it will eventually write the new entry in there as well when we get the write command for it. For that. So here it is right there. So now it's actually writing the new password inside the password file. So that's a really cool way to show strace for the security things or debug malware, find out what files are it's opening, right? What other system calls it's making, what it's reading or writing over the network, etc. So you need root to be able to run that? No, you can run it— Standby. So if I were to do strace, so it depends on whether the process will allow you to run it as your normal user. So does it show you less information if you don't have full root? That's a good question. Let's take a look here. Run level. It will not let you read up. Let's actually count the number of lines and see if we can see if there's a difference, right? Yeah. So 98. And then if we do sudo strace ls2, that's not going to work because— well, actually it will. Nope, nope, sorry. Just to make sure there's no issue, iffy things with environment variables. ls2, redirect that to standard out because it writes to standard error. Oh, nope, so there's a small difference there in sudo with the environment variables. So not a whole lot, but there is a difference. But you cannot open processes that are running as root. For example, SSHD as a standard user. So SSHD, right, attached to that process. I don't think it will let us do that. 1606. Yes, could not attach. It says ptrain attach operation not permitted. So it looks like you might be able to set a scope, a proc file, I'll talk about this in the next proc period. But it looks like you actually specify a scope for that user, what it will allow it to attach to, which is kind of cool. Wasn't there also a proc file that let you read the memory of the process or something like that? Yeah, yeah, there is. It is called mem, I believe, just procmem. Proc process mem. So let's try to go proc 1606, which is the SSD process, and then— wait, 6— and mem should be— yep, right there. And that is it because it's a binary file. And if we try to cat it— Yeah, that's— I'm pretty sure that's the one. And then maps actually explains the process map of mem. I'd be interested to see if we could use this from inside a container. Yeah, we should try that and see if you can see what the other container did. Yeah, we should totally try that. That's actually— yeah. Don't act that surprised that I had a good idea. Nice. Yeah, so that's kind of— there's a few more options to talk about real quick. Timing. So if you're a developer and you want to figure out what system calls are taking longer than others or where the most time is spent in regards to system calls, there's a few options. The -t option displays a timestamp prior for each system call where it begins. You can see on the left-hand side you can use -2t for microsecond resolution, right? We're starting each one. But the interesting one is -r in my opinion, which is the time between system calls. So it shows you the time between the nmap and the last system call or the close in the previous system call. There's also another one called capital T and this actually shows you I don't remember this off my head. Provides the actual time spent in a system call instead of between system calls. And the other thing I wanted to show was the actual stats. -c, look at this. It actually gives you a percentage chart or a table actually on the output that shows you how much time was spent in each particular system call. So you can see that most time was spent trying to open file such as the shared libraries that it needed. And the least was time was spent on whatever this— whatever this system call is right here. So what happens if we do strace on yes? strace yes and we want to kill it at, you know, let's do 200. Exec cv. That's interesting. I wonder why that is. I would just guess, or is the fact that I used strips? ls. Why not? I don't know. Nope, right, because it was the fact that I piped it. That's why. We can see that since yes, all it does is print y's to the screen. Whatever you passed to it, the time spent the most in is clearly the write system call. So, alright, well that pretty well concludes the SysTrace talk which hopefully was helpful. Covered some detail. Thank you. There's plenty more options that are available that I would like to play with as well as. And the tools to enhance the debugging like Ltrace for functions. So, and gdb. Alrighty. Anything else for the meeting? I do highly recommend you pick up that book or it's available online for free. Download the PDF. It's really good. You'll get a lot better at Linux because of it. Um. The notes for like 3 different meetings. I can put it in this one. Just go to the repo actually. Just go to the repository and search for a file or just search for a PDF. There's grep for PDF through those and you'll find the answer. Actually, one more thing I want to talk about now that I brought that up with containers is that with LXC you can actually use— what's called sysbpf or seccomp, which is the official name for it. And that allows you to apply seccomp filters to your application that can actually filter out system calls from the application. So Google uses this in Google Chrome as well as SSHD uses this. So you can actually take this table And what you can do is get all the information you want, get the numbers, and you can pass it to the container, for example, in a file using LXC tools, have the configuration file. So anytime someone uses a— runs a program inside that container that executes that particular system call, it will filter it out. So it's a way to further limit potential attacks inside the container, or you can do it in the application itself. You don't need to do it just in containers.. And there is, if you're looking for a system call table, the best one to grab if you're on Linux using x86 is the one that is provided in strace, right? So strace actually has the code for this, it has the table built in. So you can find that online. And I actually did that when I was first playing with containers. I grabbed the table, pulled it down, parsed it out, and tried to make, use it with Docker. But unfortunately, by default Docker's backend, which is libcontainer, does not support port, that you actually have to revert back to the libc library for it. But strace syscall table. And hopefully— see that example in here. I think I looked for somewhere. Well, it's definitely the source code. So if you just grab the source code, you'll be able to find it. .h from— which is my header file. That's right. That's right. Ah, here it is. Those guys are very close to there. So here it is on SourceForge. So this is the actual syscall ent header file available with this trace program. It actually lists all the system calls, their module name and their programming name, along with some other information. I don't know what the tn, td, and all that stuff is, but that's a way to get the system calls for whatever version of strace is available on your system to pull those things. So one cool one might be if you're working with network applications is setsockopt. That's used to set options to your sockets, right? So you can set buffer size, for example, incoming packets, etc. That's our application data. You can use that kind of information. Also, ioctl, right? I think when you set promiscuous mode on a network interface, it invokes the ioctl system call. So you can get that information as well. So that's good for malware, look for those things, grep for those things from the strace tool. Alright, well, that concludes Lua. I appreciate everyone that came and this video will also be recorded and placed online and available on YouTube. Well, that's all until next time. Take care. Same bat time, same bat channel.
More from Jon


What No One Knows the Podcast / Vodcast featuring The Tampa Bay Wave and Jon Schipp

Meeting the Exposure Management Challenge: Key Use Cases for Success | @OfficialRapid7 #SolutionSpotlight

Spot Security Control Gaps and Non-Compliant Resources Across Your Attack Surface






