OpenNSM (Bro's Logging Framework - Vlad Grigorescu)
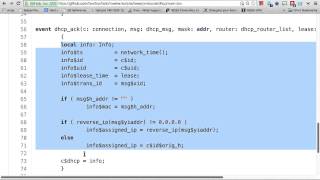
Vlad Grigorescu walks through Bro's logging framework, showing how it generates ASCII logs like conn.log and http.log from packet captures. He demonstrates the scripting language for defining record types, adding custom fields with redef and +=, and building new logs. The architecture supports multiple writers: ASCII, SQLite, Elasticsearch, and others.
Chapters
Okay, so this is our 7th meeting? Oh no, 8th, 8th meeting. Few things, we were at the Ohio Linux Fest over the weekend, so we were very busy with that. We actually didn't get a great deal of the news, and I had planned to read a paper using Bro and SDN to modify traffic flow with OpenFlow rules. However, I was unable to find time to do that. So receiving that, we also have anything for signature collection. But we're going to go ahead and get started. And this will be the first, hopefully successful, meeting recording this week. We tried last time. However, we had an issue with the client. And the copy of the video wasn't successful. So I'm going to go ahead and give it away to Vlad. Vlad works at Carnegie Mellon. And is one of the Bro developers, and he will be talking about the Bro's logging framework. So go ahead and give it up. And then, let's see here. I got that if you want to demo on there. Yeah, I figured between that and Bro Live, I don't know if you have any PCAPs or anything in there. I have the BroCon 14 PCAPs on that, so if that'll work for you. Yep. Okay, cool. I'm glad. I guess the best way to describe my current status, I'm just doing freelance pro work between development, sometimes regarding email, and I'm a consultant for the International Computer Science Institute, where pro is really— You also aspire to come work for campus again. Aspire is one word. This is, I guess, the first main talk that we've had on Bro, getting into some of the frameworks and some of the details. There's kind of a lot of confusion as to what Bro is because there's some overloading of terminology. It's a programming language, it's a tool, but one way that I think about it is just you have a bunch of network traffic that you're putting into this tool, and it's essentially structuring the data and giving you almost a database. View of what's going on in your network and is trying to extract the relevant bits and put them into the appropriate fields. So one of the— obviously whenever you want to work with that data, you need to deal with the logs that are being generated in whatever format those are being generated. So— Oh, I'm sorry. I messed that up. It's actually ilett.jonschipp.com. My fault. I thought it was pronounced "eyelet." I don't know. Well, that's just for my phonetics. Passwords demo. So anybody can follow along if they go to this address. This is software I wrote to help improve training. I think that one still works. Demo at— Yeah, demo@highlight.jonschipp.com or display.jonschipp.com. I imagine people remotely can't hear Jon, so I'm probably going to need to repeat something. No, they can. Oh, they can now. We got this working now. OK, that's handy. I think you switched tabs on accident. I did, and I was just retyping it. OK. Oh, I gotcha. You can paste it into the GoToMeeting too if you want. That's true. Other direction. Which config are we going to use? Prologue? Yep, number 2, Prologue. Passwords demo. I guess the first thing I'll do is just run Bro, get some logs, and kind of explain some of that. So while you'll generally run Bro on just live network traffic, You can also just give it a packet capture, the read file option here. I can just do Bro-R exercises, BroCon 14, and Running exercises, rare ground 14, SSL exercise traffic. Oh, that's my fault. Let me try to fix that real quick. Actually just put those on there today. See if there's any other that are readable. Well, you did /exercises, so just do it in the root there. Does that actually work? Yeah, you don't have the file permissions. One second. I'm going to pivot here a little bit. Use your phone. This is try.pro.org. There's another learning utility where you can run some run a script against the packet capture and just to see the results. So the whole point of this script is just to print out some data. We're going to ignore that. But the main thing to see here is just that you have a bunch of these .log files. So kind of going back to that database analogy, These can really be thought of as separate tables in a database where they each have the same— each log will have a number of fields and it will just go through and populate for all those fields. So for example, the conn.log here, we just have some information about the TCP/IP connections. Here's the timestamp when this happened and here is the originating host, the responding host, the protocol, and so on. And then, you know, you can go through the HTTP where it has some of that data, some of that same data to begin with, and then has the MAC address and the IP that was assigned. And for example, here's known certs where whenever Burp sees a new SSL certificate, it will just, you know, I'll give you some data about it, and I'll try to do that once per day per IP address by default. So you just have a repository of what are the SSL certs that I'm seeing. This tells you the certificate issuer, so, hey, someone just got owned and their CA is compromised. Do I have any certs issued by that CA authority, certificate authority online? So all these are just going through the logging framework. And let me know whenever you need— actually, I need you to drive. I was waiting. So just open a new tab, terminal tab. And just type ssh test. And then you'll be on that host. And you can just chmod that exercises directory. You should be able to sudo su, or whichever, however you want to do that. And then exercises. Do I need to set these too? Yeah, just chmod, give them the readable bit. You can do the whole thing if you want. I don't really care. -r. 144 will work. Is it all capital or are there cursors? Yeah. Yeah. 744 will work. Or 444, whatever. 777, everything in the whole directory. Yeah, just 77 everything. Is there 855? Well, the directory. Yeah, the directory is. The pcap files are not. I'm just assuming they're not. Yo, 777 is cruise control for cool. That should do it. Pretty sure sudo su is cruise control. Cool. All right, now can someone try that now? Yes. That's really strange. I apologize for that. I can't do much over here. I just got less questions than I had before. That's a terrible joke. I feel bad smiling at it. Can you— Let's do a find -type d exact change by what? a+x? Yeah, of course. I don't remember it. I don't remember the address. I'm sure there's a memorable one. Yes. There's probably multiple subdirectories. Brocon is— Oh, are these going on different containers or something? Yeah, but it's mounted from the host. So it should take effect immediately. All right. Why are you using 4% CPU? Ah, there's the issue. Oh, I see the user ID. Yeah, OK. Ownership. Looks like that, Mary. Yeah. What is that? That's better. All right. Hey! Thank you very much, Vlad. I apologize for that. That's what I get for doing this right before the meeting. So this is the same pcap that was up in tryout-bro, just with some sample traffic. So whenever you run Bro with the read file option, the -r, it'll just generate those logs in the directory. So is anyone that's following along having issues getting this running? Yes. Okay. I've got a new issue though. Hooray! That's progress, not perfection. I'm lost, like what are we doing? I cannot open packet_filter.py. So we're getting ready to— —reading in a pcap file. Yeah. So if you're in the home directory, absolute path it. So, pro-r/3.0/exercises. Yeah, because you can't write to that. That's exactly right. And you're in the— is this in your home directory right now? No, right now I'm in exercises/procom. You can't write to that directory. You're not going to have write access. So— Go to your home directory. Just type cd. When you do the recursive, I don't know what the -r flag is, but when you do the Bro thing. That's to read in a file. Reading in, you read that sucker in, it creates a bunch of files in the directory that you're in at that point where you're pwd'd. What directory are you in right now? Okay, so your home directory is the prior directory. But any other directory isn't. So which one are we supposed to be reading right now? Or cd. The one he has up there. SSL exercise traffic.txt. Yeah, I think that's the clearer— I'm still running that, right? Yeah. The file is in the resolution directory. OK, so now I've got all these logs in my home directory. OK, that works. I think we're probably going to have something working with these logs a bit more efficiently. With these text logs known as the ASCII logs, it's really just using the standard Linux tool suite of grep, awk, head, tail. One handy shortcut is just less -S, which will let you move side to side because these are just really long. Log line and so on. So all this should look very similar to the data that was on try.pro. At the top here, we have some comments about this file. So these are all CSV files, but they're actually tab-delimited. So the first thing is just what the separator character— Are you— oh, you're Lessing. OK. I was wondering how you got that so pretty. Yeah, just with the capital S for the turn-off wrapping when you move side to side of the arrow. And then it has some information about the file that you're in, when the file is open. So this is right now. And then it just has the names of the fields. And then the type of each of these fields. So, ts is a time value, so it's just standard Linux Epoch time. This is a string. This is an IP address. This is a port number. And kind of just going through there. And then, end has a comment for whenever the file is closed. DHCP kind of has the same few fields at the beginning, and then MAC address, IP address, how long that assignment is valid for. Not sure why you would have the release time here. Traces aren't logs. It should just be acts that are being logged. So going into how some of these files are actually being generated with the logging framework. So right now I'm on, all the Bro source code is up on GitHub, just /bro/bro. And all these are being generated by Bro scripts. So the data is being made available to the scripts, and other ones that— one of the main uses of the script is to take that data and generate logs for you. And that's really key because you can write your own scripts to create new logs, to add or remove fields to the logs, and that's really one of the main customization points for working with Bro. So scripts, base, verticals. We're looking at DCP. And all these have a main.bro script here. So these fields here, these all match directly what's in the logs. So we have the TS value, the UID, the ID, MAC address, assigned IP, lease time. So essentially the way this works is you build this data type in Bro called a record, which is really just a collection of other data types. So here we have something named TS, which is a type. Time value, which is of type time. We have something UID, which is a string. We have ID, which is actually another record. So you can kind of nest these things deeper and deeper. And the way it works is you'll go through and you'll populate these fields. And then you'll just do a log.write. And it'll go ahead and log that to the correct file. Why is the ID the IP address? So the ID, if you look in the file, the way these are accessed in the ASCII logs is with this ID dot subfield. So here it's accessing orig_h, orig_p, rest_h, rest_p. So ID is actually a record made up of these 4 elements. Ah, OK. And that just corresponds directly to— The four elements in here. Inception. Pretty much. Yeah, and you can kind of break it by making a record refer to itself in weird ways. I think that was what segfault took a while to track down. I bet I'd be good at this. So like tsuid and id are our names that we're giving these? Yeah, so this script will go— through and name these fields. So not only is this a collection of these other data types, but they have specific names and types associated with them. So type and time and string, those are like keywords? Yeah, so one of the benefits of the Bro scripting language is that because it's designed to be domain-specific for network monitoring, time value is built in, IP address is built in, port is built in. So these— just these kind of handy things that you need to deal with. And then all these types can also have specific attributes. So maybe you have something that's just for internal use that you don't want to clutter the log with, so you don't give it this &log attribute. So whenever you send that record off to the logging framework, it won't actually print that into the log file. And similarly, some of— most of these fields are required depending on what DHCP traffic we see. Specifically, maybe we don't catch the client's MAC address. I think according to the RFC, that's technically an optional field in the one place we're looking for it. And, you know, if they don't get an assigned IP address, if they don't get a lease, we're not going to have that information. So essentially the process for building one of these logs is to— this is essentially saying that there's a new DHCP log. Redef is just Bro's way of redefining a variable, and here we're essentially saying that we have all the log IDs that we know about and we're adding this additional log ID. Log to it. This is kind of a weird shorthand. Because we're in the DHCP module, this will default to DHCP double colon. And then the logging framework will take that and figure out, oh, this is from the DHCP module, so I'm going to name it DHCP.log on disk. I might name it something else if I'm sending it to SQLite or something else. But within the logging framework, there are plugins for what you actually go in as a handler as well. And then the other thing that's left is to actually just go ahead and create the log stream. So Bro is event-driven. All these events fire, and your scripts just have to have code in the different event paths. So bro_init fires on initialization and lets you just do things startup. And what we're doing here is we're creating a new log with the DTP log that we had above. We're telling it what are the columns in this log. And then there's a handy shortcut of— if I want to do something with this data as it's about to be written out to the logging framework, go ahead and fire off this other event, and I can handle that somewhere else maybe to to— and just get it as kind of a shortcut. So a lot of the code will just define this new event. And then if you— I guess I should back up a little bit. So the DHCP analyzer has events for a request, an actual acknowledgment message, NACK, release, renew. So there's actually a bunch of separate events in there. And just to kind of shortcut you from having to sit there and figure out, well, if I want to catch a DHCP lease assignment, I would need to handle this, this, and this. A shorter way is usually you're just kind of going off of what you have in the logs anyway because you saw something and you want to either act on that or maybe you want to send that to an additional log. So just a shortcut is this new event that gets generated of Hey, I'm writing a SAS log to the log. Here's the data if you want to do anything additional with it. The other reason I kind of point out how this is actually generating the script is that this is really where the documentation is for all these different fields. So if maybe you don't know specifically what a trans ID is in the context of DHCP, this can at least give you some clue of what's actually going on there and just a short description of what you're looking at. Here specifically, it's useful to start to figure out which portions were sent by the client, what was sent by the server. So you showed some code that seems— if you scroll down again, I don't remember where it was, but not the ProNet. OK, so here, like a DHCP acknowledge, right? So that seems to define a function that will handle DHCP acknowledge. I assume somewhere else this gets called when a packet comes through, correct? Yeah, so essentially there are two layers to this. There's a portion of Bro written in C++, and then there's the portion that is in the Bro scripting language that we're looking at now. So the C++ layer is really for all the things that need to be be fast, and that includes things like actually parsing the traffic off the wire. So there's C++ code that will take this, and then it will call this function, the DHCP ACK function. And it will go through, and it will populate, you know, the connection information, the IP address, and all these other things. These different events are documented. Again, the docs are in the code, but we also put those on the website. And you can pivot around through there. And then where the scripting layer comes in is that whenever you have this event DHCP-ACK header, that code will run for every time that function gets called. So here we actually have it twice. And so does Bro scripting language get compiled to object code? No, it doesn't. So glad I didn't go there. It'd help if you explained that. So the parser is written in, well, in this case C++ for DHCP, and it defines events that when it parses the packets, it's providing both the event that it will fire and the data structures that map to that event. So here you're just catching that event and then doing something with the data it's providing you. So this isn't actually parsing the DHCP packet. Is there another way of— to be printed out? No, this is taking a parsed packet and allowing you to look at the fields of that packet and do something with or without it. Which is like on-match action. Yeah, so this is an event-driven scripting language. Usually those are used in things like GUIs where you— something fires a mouse click at position X and Y, and you just have code that says when a mouse click, take the position and then do something. Uh-huh. Right. So this is kind of the same idea of we saw this message, here's the data out of that message, now I'm gonna go ahead and do whatever additional processing I need to do on there. So the port— the script— The goal of the C++ layer is just to literally pick out the fields off the wire, figure out the encoding or anything else that might be on there, and then just try to make them available, convert them to an address format. I mean, I think here, yeah, some of the things were— some of these are records, so it'll go through and populate those fields for you. All this is really doing is creating a new local variable of type info, which was that record which we want to log out. And then it just goes through and it sets the different fields. So it sets the timestamp to network time. This is a function that will just return the timestamp on the last packet it received. ID and UID is already populated in this connection variable. And then it's really just kind of mapping up the data that we want to actually pull out. There's more data in here that we're not logging. So as these get designed, there's always a trade-off for how much do you want to log, how detailed do you want to be versus space considerations. Is that really going to be useful to you down the line? What I started touching on before was just the fact that— and unfortunately this is quite wide— but these events, you can also assign priorities to them. So you have two pieces of code that are going to get run whenever this DHCP ACK event fires. So you have this chunk here, and then because you're handling the same event further down, you have this chunk. So you can assign a specific attribute here where here it's priority 5, here it's negative 5, and it would just go down and handle the higher number priority things first. And that's really common for anything that gets logged out. And the idea is, again, if you want to maybe add fields or change the data before it actually gets logged out, you have between priority 5 and -5, you can have another event hook that will do something. And it just lets you change that as opposed to, you know, this logWrite function call was right here, you just wouldn't have anywhere to actually insert your code. You could. So the base scripts are just really designed to do the bare minimum, get you the logs, but they're really designed to be extensible in terms of you adding fields or changing the data somehow. So, you know, maybe you wanted to— you have the MAC address here. Maybe you wanted to actually have a table with the OID vendor name, so you could grab the first part of that MAC address, look it up, and you could add that to your log as you kind of go through and start examining that. One other thing that Vlad didn't quite explain is those comments that are there above each of the text fields. You notice they have two hash marks in front of it. That's for the parsing of the automated— Docs. Docs stuff. So if you just put a single comment there, or a single hash, it's still a comment, but it doesn't get parsed by the parser. You guys running your own custom parser, or are you using some kind of product? It's a custom thing. I was just wondering. It's based off of— Doxygen, I think. Doxygen. I don't work for Chrome, by the way. So all these scripts get documentation automatically generated for them. And so there's a script index here that will just kind of go through all the different file paths. So you can go into base/protocols/dhcp/main.pro and, you know, here's the DHCP info type. And it will just go through and it will pull all that data out. And then we were talking about the ID field, for example, which is really another record. So you could click on that and that should take you to —con ID, which shows you that— well, here are the subfields available there. You'll find some things are much better documented than others. Yeah, there's still quite a few gaps, unfortunately. And then this is the new event that was created that you can handle this too if you want to access the data as it's sent off to the logging framework. And you'll get the CSV info. Parameter. Something I've been meaning to ask, and maybe you know this answer, Brad. Is that documented somewhere, what all the different formats and crossrefs are that you can do via the automated generation? I'm not sure. I looked at the source to figure it out. Yeah, I know. And I usually don't do anything all that fancy, to be honest. 'Cause you could force references and stuff. Yeah, and there's special code in there for linking to an RFC and stuff like that, which is useful. It's almost kind of like Markdown, isn't it? Pretty much. Yeah, so this is an example of another log also related to DHCP. So again, we have the known certs where you just log the SSL cert once each time. This is known devices for— I want to know all the MAC addresses that are out on my network. So this once per day will just log the timestamp that it saw it, the MAC address, and then if it actually got a hostname as an optional field in the DHCP message, it'll log that in too. That's always fun, since you always see Jim's iPad, everybody's naming stuff their first name all of a sudden. So— so on try.pro.org, there's a handy example here for creating a new log. So this is just the same thing as was in DHCP, but it's really just kind of boiled down to the bare minimum where you're defining this new log. And really, again, this is— log, you give it the full name. You have an info record, which has a timestamp and message. And then you have— you're creating the stream. And here there's just a little bit of code to just go ahead and do that once on initialization. So this is the code to create an instance of that record with the current time as the timestamp. And the message is just hello. And that matches up with time and string. And then I'll just go ahead and write that to foo.log. And then I'll go ahead and print out logs to std::cout. So I didn't give it a pcap or anything, but just running this, it'll just add that one instance of this message. Go ahead and run this with a— Well, so I want to see if there are any POSTs in this HTTP, but this interface isn't super great for that. I guess I can take a look at exercise traffic. Yeah, so we have some POST requests in here. So an example of something we could do is we could just create a new log for maybe just HTTP POST requests. You want to know where people are submitting forms, things like that. So one of the main use cases is just for creating new logs. So let me— All right. Do it again. Screen right. My network keeps dying. Like, I don't have internet right now. So the one downside to these events is that you need to know specifically all of these variable names and types that are being passed to you. View. So you really can't write anything without checking either the documentation or some existing code. But let's do HTTP. Create our new log or info record. Let's just do timestamp and post. —and the URI. So within Burro init, we'll go ahead and we'll create the stream. And then we have this button. So there's an HTTP request event that comes from the HTTP analyzer. It gives you the connection, the method, their original URI, and the unescaped URI. And the version of HTTP that they're speaking. Interestingly, it doesn't actually give you the host, so that's cool. Wait, are you calling the export thing that you just wrote or no? Is that what that does or no? No, so this essentially just— this code will be executed whenever that event is called from somewhere else. So this is just kind of like a function handler, I guess, is one way of thinking of it. About it. OK. So all I'm running in here is just a block of code that will execute for every HTTP request. So I'm doing this in addition to everything else that's currently going on. I don't think we actually get hosts with this event that I proposed. But just for purposes of demonstration, so if the method equals POST— actually, let's do this. If the method is not POST, return. Otherwise, local code. So I'm defining a new record. I'm setting the timestamp to network time. And I'm setting the URI to, let's say, original URI. And then I'll— And then, so here, we just need to pass the which log we're writing to and then the actual values that we're writing. So we have— which should be— which log? So I'll rename this to the same thing. Again, these, as long as I'm in the HP Post— as long as I'm in this HP Post module, all these are implied. Just to make it a bit more obvious what's going on, I'm explicit. So I'll go ahead and write out this info record that I just— let's try running that. So now we have an HTTP POST log. It expects these things to be camelCase, and it can kind of get weird with the naming. There's a way to override that. But it just has the timestamp and then the URI that we're actually doing a posting to. To, which is neat but not all that useful, really. So we can look at— actually, we can do this. I mentioned before that we have this utility event whenever something actually goes off to the logging framework. So what you can do instead is just look at this log HTTP event. Event— oops. And then it'll just give me an HTTP info record. Method.post.return, and then let's go ahead and add in the host. And then let's just regular— Yeah, this is out of the HTTP module, so it's actually gonna block. So is that, I guess, more or less— I know there are lots of syntax oddities and weirdness, but essentially we're just defining new log, defining the columns for that log. Creating the file, and then go through and populate the fields, and go ahead and write that out. Can we possibly— or do we have meeting notes for Sam and GitHub? We can add some of this if you'd like. I think that would be useful to keep around as a reference for later. OK. Vlad, do you care to copy and paste that into a text file or something? Yeah. And then I'll add it later. Jason, for these events, can you match on Well, is the hypervisor— No, he needs to give it— because it needs to know what— For HCM, yes. For Oplog, yes. I mean, I assume that's— But I guess, are you asking can you match the event name? Eventually. Well, I just want— what if I wanted to only match on one field, and I don't really care what the other fields are? Your function definition has to match for the event. Is there parameters being passed in? OK, so you just don't pass those parameters then? No, no, you have to accept all of them that are defined in the parser. But then you don't actually need to ignore the rest of them. You can ignore— you don't need to use them. You can just ignore them. OK, so you— OK. But the signature needs to match. I gotcha. Another thing we can do is just start extending— I guess we can go back to DTP as an example. Maybe we want to just throw in an extra field in there. We have this DHCP info record and— let's see what other data is available here. I guess I should go back to the documentation. Top level, protocol analyzers, TCP. I think router is logged. So we could just add the hostname, for example. Um, so I could do this, redef DHCP. So I mentioned that in here we're handling this DHCP ACK events at two different priorities. So what we can do is we can just have another handler in between those two. I'll just have to set priority 0, and— Yeah, so sorry because these are in here because the RFC says they can be in here, but practically I don't think you actually see them all that often. Go back to the app. For a second. I've opened DHCP message probably. XID, for instance. Let's see what I get. That one should be— or— ah. Or CI header. Let's try a log. Well, that looks like always the same. Uh, progress we have, status. I think I'll try CI header. We're going to need to do something just to kind of prove that this works. Just do x_id. Or, uh, first, yeah, the number. x_id would be at least different for each. Well, I thought those are already being logged as transactions. Oh, yeah. We can still log it as another field, though. Uh, oh. Yeah, I'm kind of just taking shortcuts here. I don't think it's like we do, but— oops. But essentially adding fields is just, again, redefining this record and doing a += with the new fields that you want and then just going and populating those. I'm going to add that to the notes too, what you had earlier. Well, that'll work just there. It'll be fine. Yeah, I was just kind of leaving these up in tabs. OK, cool. So the other thing I want to— touch on really quick. Is that log, Chris? Nope. I don't know why. I'm not going to— Yeah, it's still not populating. I think it's because I was trying to override it when it assigns a connection. And that's technically a no-no if there was translation. So going back to the Git. So I mentioned before that these log— these log writers can also be plugins, and that's actually something new in Bro in the upcoming release, but it's a shared library, so you don't need to recompile Bro to take advantage of new ways to send logs around. So inside of Bro proper, it comes with support for writing out to the ASCII log that we've been dealing with and to SQLite. So source logging writers. So it has a SQLite writer and it has a batch writer. And essentially, you can go through in your scripts and your configuration and tell it where to send each of those logs. You can send them multiple places. And then on top of that, there are plugins for sending it to Data Series, which is an HP binary format, which I think everybody had high hopes for but hasn't really panned out that well. Or you can send them to Elasticsearch, which is a NoSQL database that essentially takes JSON data over an HTTP API and then gives you JSON data back. And this is handy because it's a lot more flexible in what you can work with since you can issue queries directly, and then you just get JSON data back. Plugs into D3 if you want to start graphing data directly in your browser, or just it being a lot more easy to work with than the ASCII logs where you lose that— at the top you have the name and the type, but you lose that whenever you actually go through and get the data. So some people just use Logstash, or just use Kibana which is the frontend to Elasticsearch for this data. That's how Brownian also works using some of that data. And really, the configuration is scripts policy to So just like everything else, this has a script, and you can redefine these values to change how the logs will actually behave. So As you're sending these over to a database, it'll create essentially a database or a table or a database every X hours and it'll change that out so you can query the correct data, at least in Elasticsearch. Analog switch doesn't— which don't map quite the same. You can exclude some logs or you can explicitly send other logs over and It's essentially just in the logging framework creating a new filter saying that for this stream that we created, go ahead and apply this filter, which will specify a specific writer that you should be using. And then each of those writers has a number of options. So here you can set the rotation interval. You can actually have it where usually your connection log, your DNS log, your HTTP log are going to be the very noisy ones. So maybe those you want to be rotating every hour or 2 hours, while the ATP maybe only once a day. So you can kind of tweak some of these settings to just to get some different behavior in here. Most places that end up running this will just load this script and then maybe they'll exclude a few logs that they don't want to send over to Elasticsearch. But the hope is that as you don't need to recompile Bro and keep version or worry about version matching and scripts changing, you can just kind of use these plugins and they ship with the scripts that they need and the customization points points. They ship with unit tests. And then you can just kind of go and enable it. So I think as we release this, we'll probably get more logging plugins for things like log directly to Splunk or whatever and just kind of take advantage of the extra benefits that you would get there. Yeah, so I mean, we focused on the ASCII logs because that's what most people end up using. And really, if you're using one of the other plugins, you're probably just gonna wanna keep the ASCII logs around anyway in case, you know, your database goes down. In a few places I have both Elasticsearch and ASCII enabled, and people still prefer working with the ASCII logs. It's slower, it's just the tools that they're used to, and they can do it very correctly. They don't need to use a mouse to click on things. I certainly understand that too. But yeah, you can just kind of tune it for your environment. But the main tuning point is kind of stuff that we covered of creating new logs. There are people that have a separate DNS log for external DNS servers where if you're not using the campus DNS servers or the company DNS servers and you're going out to Google, maybe you want to just have a separate file or if you're doing DNS blocking, you can put So bypassing that with that, it's probably not a lot of traffic, so go ahead and throw it in a separate file and you can just get separate statistics. And then just either adding or removing fields from the logs. If you're doing HTTP Basic Auth, you're going to see the username and the password— well, the username by default in the HTTP log. There are people that don't want that for privacy reasons, so logging framework does have some customization points where you can actually remove fields from that log if you are worried about the privacy concern of all the data that you're sending there. That's pretty much what I had. Thanks, Wyatt. Thank you. Right. So this is your algorithm they found for what? Uh, the try to predict URL. Yeah, they saw. Yeah. All right, well, that concludes this meeting. Is there any topics you guys want to talk about for the next meeting? Any ideas? I was interested in the SumStats framework. That was one thing we could talk about. We have a list on GitHub. I don't know how— when the last time it's been updated of future topics. But let me quickly review that before we go. I would be in favor of, if not next week, then in at some point of utilizing the hypervisor to stand up an actual instance of Bro and using it to sniff something. Okay. I think that would be a worthwhile meeting. And just using the meeting time to actually do that. Oh, oh, yeah, sure, we can do that. I'm also interested in Some stats framework. Yeah, OK. What'd you say, Shane? I was thinking we could maybe throw up the MiniNet or something. Ah, yeah, just do some SDN stuff would be cool too. Yeah, so we got all that to the notes. So here are a few things we talked about before. Of course, Blacky Brownian, because he wrote that. We want to do the ELK stack. William, if they could talk about Splunk sometime in the future. A few things that were— Tyler mentioned Wireshark. You'd like to do some advanced Wiresharks? Yeah, everyone knows basic Wireshark, but once you— I can do that sometime. Wireshark has lots of buttons. Well, maybe not everyone knows basic Wireshark. Yeah, we can incorporate it all in for you, all right? We can read them quickly, but it wouldn't be a bad idea to hit them. And the two other ones were Arcus and Snort. I know we talked about those two. A few people are interested in Snort too. They've seen the Bro side of things, which is a different approach. We can also take a look at a strictly signature-based system as well. We should do Suricata instead of— Oh yes, we can do Suricata. That would be fine too. That's good. You could also hack it into the mainframe. Yeah, we gotta keep it with the name, I suppose. But all right, well that concludes— we'll figure it out. So we have a bunch of ideas and we'll come up with whatever works best. Kevin, you have anything? You had your hand there for a second. I don't know if that's— All right, well, great. All right, well, thanks for attending, everyone. I appreciate it. And if you have any future ideas, throw them out. Let me know. And if you want to speak on something, please do. We all need help. We're ending early today. We are. I can see that. Sushi? Sushi? Sushi? Sushi? I'll try to make it more often. Want to come for sushi? I like to have beef pot roasts and stuff to work it off too. So that'd be really cool. Yes, Tim. You guys volunteer me for all sorts of stuff. I know. It's kind of great. Yeah. It was because it was my cat. We have those on campus.
More from Jon


What No One Knows the Podcast / Vodcast featuring The Tampa Bay Wave and Jon Schipp

Meeting the Exposure Management Challenge: Key Use Cases for Success | @OfficialRapid7 #SolutionSpotlight

Spot Security Control Gaps and Non-Compliant Resources Across Your Attack Surface






