OpenNSM (Critical Stack Intel and Bro Top)
Jon Schipp led the OpenNSM community meeting covering organizational updates and two technical talks. Dustin from Critical Stack demonstrated the Critical Stack Intel Marketplace, a free service that aggregates threat-intel feeds for the Bro framework, and Brotop, a Go tool that streams Bro logs to a browser for real-time debugging. The group also discussed security concerns about containers leaking audit data and syscall visibility.
Chapters
All right, here we go. Another Open NSN meeting. We do have a guest speaker today, so we'll get to him shortly. First, we're going to head up through the notes here. So we're going to go straight into group updates. So last week, I think it was, I created an official Open NSN Twitter account. Do tag us in that, and we're also using the hashtag #OpenNSM, and that will be used to, of course, tweet the video recordings, the meeting notes, our guests, et cetera, et cetera, and projects. Shane Rogers bought opennsm.net last week as well, so currently that is pointing to our NCSA web server at the moment, but eventually we'll be having it pointing to all the VMs in our labs. Sponsors, we are looking for sponsors. So if you have anything to offer, we'll have a banner for you on the website. If you're a commercial organization that has products that work with TAPs or special high-performance network cards, etc., we'd love to be able to review them. So if you want to donate a card, we can review them and talk about it in the meeting, etc., etc. We're also looking for monetary donations and other things like that. I am working on a Unity cluster and I made a big— a large amount of progress last night on it. And we should have it as soon as I get the word from one sponsor I'm working on— potential sponsor I'm working with right now. We'll be able to rack it with them. And the other thing that was just announced prior to Shane coming— or when Shane came in the room was that we are now officially under the Association for Computing Machinery Title Open NSM. And before, a little history on that, before we were, prior to joining or being incorporated into ACM, we were known as Open NSM. But when we joined them, they suggested to try the name SIGNET, which a former group had. But since we already had national participation and a large user base, we decided that it would probably be beneficial to avoid confusion just having the name standardized. Or uniform, I should say. So now we are known in ACM and out of ACM as OpenNSM. So that's nice. Jumping straight into the news section here. So a few things. There is a really good thread on Stack Overflow that a client asked a question on how to debug or deconstruct a BPF filter for TCPdump. And I thought it was a really good discussion. So I highly recommend checking out that link, which you can look at and Guy Harris has been a VPS hacker for years. He works on libpcap and tcpdump. He had a very detailed reply going through this filter that this guy is having trouble with. And we can actually see from the filter, essentially what's actually happening, he's trying to match the word or the letters GET and then a space here for a GET request.. And he's asking, you know, I don't understand all this. Maybe someone can help me out. And then of course, Kai gives a, like usual, very detailed lengthy response on what everything means in there. So I highly recommend checking that out. Also, Stack Exchange has a reverse engineering section now. This has actually gotten announced, I think it was sometime last year. I've been getting the newsletter, keeping up on the most popular posts. I thought I'd mention that because it's really interesting. There's some good stuff on there. Also today, or yeah, today I think it was posted that Security Onion 12.0.4.5.1, that ISO image was released, which includes all the updates in the past up to February 5th. So now instead of having to, if you're needing security now, go ahead and download that so you don't have to get the old ISO and then apply all the patches and everything with it up to the 5th. So now we're going to jump into the tool tray. This is where we talk about— we share little code snippets or tools that come out. I have this little shell function now called check_bpf. I'm going to quickly look at it here. Okay, so this right here essentially you just pass a BPF to it and it tells you whether it's valid or not. I actually took the expression here from Guy Harris in one of his Stack Overflow posts. And essentially what actually happens here is here's a PCAP file format exactly right here. A simple PCAP file in this set of the value of the expression variable. And it's actually for Ethernet DLM 10-meg type. And using that you can pass in a filter and see if it's valid or not. So let me just try it real quick. Checkers for BPF. I want to say IP or not IP. It says it's a valid BPF. Or IP and not IP, and that fails, right? So an IP or not IP, we're asking for all of IP or things that are not IP. But in the second one, we're negating everything out, so it's a valid— it's an invalid filter. You can do your normal stuff. You can use other qualifiers like port 22. It says it's valid. And of course you can do filters that you need to use other expressions in. So OR 443 OR 80, for example. And it tells you whether it's valid or not. So nice little thing to have in your shell on one of your RC files on startup. And then I have a link to my GitHub doc file for that. So just take a look at that if you're interested in it. Paper period is where we talk about presentations and academic research that comes up. And I actually don't have a chance to go fully through this, but SPI-Net, which is the conference for— or the network for the International Supercomputing Conference, released a presentation out on flow analysis. And they had Bro. So they have a lot of traffic going through there. You can see it's a huge amount. If you look quickly here, they had Bro investigating 296 gigabits per second So that's a very high rate of traffic. And they have a detailed network map and discussion of all of it. I didn't have a chance to go through it, so if anybody's interested in looking at how they did it, how big their cluster was, etc., and the data that they were able to obtain from it, do please check out this link right here. Sorry, we have an incoming call from Cisco IT, as you're asking. Okay, they hung up. It's probably Devin. Alright, so next thing. So, Waylon was going to talk about this other paper called "The Underground Economy of Fake Antivirus Software." Go ahead and pull that up. Yeah, so there's this paper that got published by some researchers at the University of California, Santa Barbara that takes a look at a couple of aspects of one of the big spam bots that gets used that came out of one of the Parnikas in Russia. If you've read Brian Krebs' new book Spam Nation, it talks about what that model looks like and sort of how that relationship works. But basically they were able to obtain access to some backend payment processing servers that were used by one of the more popular botnets, and it takes a look at the financial aspects as well as the technical aspects for detecting these types of operations. It's interesting because it really shows how there's more than just the NetFlow aspect. So you're talking about detection and looking at these types of things in order to ultimately prevent them from occurring. There's more than one way to approach it. But basically they look at how these outfits have to have access to legitimate payment card processors like Visa and MasterCard. And in order to maintain access to those, they actually provide excellent customer service to the people that they're scamming. So the people come back and request a refund because they feel like they've been scammed. They're more than happy to oblige them and give them their money back. But the— there's a couple of economists who take part in this paper and they basically talk about how those patterns of behavior can ultimately be used by vigilant payment card processors to detect these types of operations. So there's also some bits in here about how they use Anubis to deconstruct the executables for some popular fake antivirus programs. Been around, but that wasn't of particular interest to me when I found this because it was kind of a novel way to approach protection. I think that the economics of this is really interesting. I thought it was pretty cool, customer satisfaction, even if you're a part of Russian fishing network. Well, and it also talks about in the paper how they, like, they keep really detailed customer records, like, I mean, they're really serious about keeping— Yeah, it's like there's so many aspects of it that are legit that like you almost have to look twice to see that it's actually not. That's real cool. Yeah. Yep. And I also second recommending Brian Krebs' book as well. It's really interesting. Thanks for that, Will. All right. Well, we're now at the talk section, and I'm going to give it up here to Dustin. So our talk today is going to be on critical stacks, in-cell service, and grow top. And many of us know Dustin from the STORBY project. So it's a beautiful web interface that is used to log all kinds of store-like data in there. And it's used in security. I think so if you use security, I think more than likely you've also used Snorby. And of course Dustin works on a large number of other projects as well. And he'll be talking about a few of those today. I started to take a look at this for campus over the last couple weeks. The Intel— Oh cool. Yeah, go ahead, give it a like. Yeah, and then there's been discussions on the security mailing list I've seen lately about that. A lot of people are really enjoying that service. So highly recommend checking it out. Can I ask questions now, or do I have to wait? No, I don't think Justin cares. Justin, are you a contributor to the project, or are you primarily just a user?
To which project? The Intel application?
Yeah, the Critical Stack product.
Yeah, so I'm actually, full disclosure, I'm the CTO.
No, it's cool, man.
It's cool. Yeah, so yeah, I built the, I built the whole thing out. So right now at Critical Stack, we don't, we don't really have like an engineering force. So my day-to-day responsibilities have pretty much been building up our initial products. We saw a huge opportunity to basically leverage Bro from the intelligence aspect. So me and Liam basically basically just said, hey, let's take some time and let's just build this free service and get this intel kind of in one spot and in an easy and digestible place for, for the Bro intel framework. So we kind of buckled down and just went for it, and that's what we put together.
He's like, yeah, no big deal. And then I would like to mention as well that Liam May joined the call as well. Liam Randall, also with CriticalSec, if he has time. I think he's on a flight or something. Um, so I'm gonna go ahead and turn off screen sharing on my machine and then Dustin, we'll get this started. Cool.
Um, let's see.
It should be a green button. It's just share screen.
Yeah. Can you see it?
Yes, we got it.
Cool. Uh, so I mean, first off, what I want to say is I'm not here to, to try to sell you anything. I mean, I've— there's nothing I'm— that I hate more than a security company that tries to join this stuff and try to pitch a bunch of crap. That's not what I'm here to do. Everything that I'm going to talk about is either free or open source or freely available. So just to get that completely out there, I mean, I've spent my entire career building open source stuff, and even when I did start my first company, I felt bad for about 2 years before I actually started to accept the fact that, yeah, I gotta eat too. Um, but open source comes first for me, so that's, that's what I want to talk about today. Um, so just a little bit of background on me. Um, I haven't been in the trenches for quite some time. Um, I've worked for the, the GE incident response team under Richard Baitlik for, for quite some time, and that's kind of where I did most of my incident response day-to-day activities. While I was there, I started basically building a ton of software and kind of decided that I was much more interested in software development than I was in incident response. Not to take anything away from incident response, it's just kind of what I felt. So I kind of pivoted from there, you know, from the success of Snorby and a bunch of other stuff. I eventually got to the point where I wanted to start a company, and my first company was ThreatStack. I don't know if you guys do anything with Linux or if you guys do anything with cloud computing, but it's definitely something to look at. It basically just monitors system calls and tries to build behavioral profiles based off the system calls that it observes off the box. And like I said, keeping true to my open source, not trying to sell you any crap, there's also a free alternative that does the exact same thing. ThreatStack does slightly different stuff, but this is pretty much doing a lot of the kernel-level stuff. I don't know if you guys have used Sysdig, but it's definitely something to check out. One of the cool things is, is that you can actually attribute NetFlow data or network traffic specifically to a process. So if you're doing system-level monitoring and you want to say, hey, this, this network activity happened, but what process did this come from? Was this a child process? If so, what was the parent process? What other system calls did that process make in the last 2 hours? Those types of things can easily be answered by Sysdig, so I would definitely check it out if you haven't heard of it. So anyways, after ThreatSec, I left ThreatSec and basically teamed up with Liam because I'm so interested in what he was working towards, and the combination of open source together with the bigger vision of what we're trying to work on now for the future is what really attracted me there. And the first thing we did was the critical stack intel Marketplace, and I did air quotes on that. It's a marketplace. Marketplace is usually basically kind of mean buying or selling, but that doesn't happen here because it's all free. But it's a cool term, so we just decided to stick with it. So the Intel Marketplace is essentially just, just an aggregator. We basically kind of scoured the web and looked for all the interesting feeds that we could find, feeds that Liam has actually used in the field that, that were actionable in gave good feedback on. And we took those feeds, automated the process of ingesting those in like 30-minute increment chunks, deduping it, normalizing it, and then putting it in a place where people could subscribe to it. So the Intel feed is, is pretty simple. I'll just log in here, run over the basic setup of it. It's comprised of like 3 sections. So you have sensors, which is basically a mapping for an API key to a physical box, a collection that is basically just a box for the intel you want to subscribe to, and then the feed section that kind of just lists out all the available feeds that we have available right now. So once you log into the intel feed, it kind of walks you through a setup wizard where, where it wants you to create a collection first, uh, you subscribe to some feeds, and then create a sensor. So I'll just kind of run through that real quickly. Creating a sensor, just name it whatever. Once you do that, you pop into a page that says we don't have any feeds that are subscribed to this collection, so we'll click on add more feeds. We'll pick Fishtank here, Cybercrime Tracker, SSL Blacklist. Most of the feeds that we're using right now are mostly feeds that we find useful when we go on engagements or if we do any kind of customer consulting. There are some, and this is something to note, there are some feeds that actually have zero indicators. And this is because these particular feeds are updated daily. So when indicators that belong in those feeds are deemed inactive or not actionable, they get removed like on the drop of a dime, right? So instead of just kind of waiting until the feed has data and then making it visible in the UI, we decided just to make it visible all the time. So you can subscribe to it, and when anything's added, you'll get it. If nothing's there, you won't get anything. So once we subscribe to some feeds, our collection's been created, and then we can go and create a new sensor. There's no limitations in the UI. You can create as many sensors or collections as you want. The cool thing about collections is you can have different, basically, policies for different types of sensors. So if you have a sensor that's you know, on an outbound gateway, you can do specific things there. If you have a sensor that's primarily doing, you know, email or web traffic, you can kind of customize it for your specific needs. Creating a sensor, you don't need any kind of metadata about the host that you're going to deploy to, so you can just pretty much name it anything. Select the collection that you'd like to be assigned, so we'll select Word, which is the, the new one I just created. That's pretty much it. So You have your sensors set up, so what's the next part to that? And that's installing the client. So when we kind of posted this on Hacker News, we got a ton of great feedback, but we also got a few people that were like, you know, why the hell is there a client to deploy this? Why can't I just click something and download? And that's a great thing, it's a great point, and that's something I want to talk to. So there's nothing malicious behind this. We're not trying to like deploy something to your network. I mean, honestly, we don't really care. It's, it's pretty much on the same level as pulled pork, if anybody's ever used that. We didn't want to keep stuff on the server, and we didn't want to do a lot of specific manipulation of the data on the server, and we wanted to push it to the client. And just to talk to that a little bit, I'm fully transparent about this. I'll even show you guys the code for the client. Where is that?
Hey, uh, could you increase the, uh, the font size in the browser? And then the terminal.
Yep. Is that okay?
So— That's perfect.
Okay, so this is actually the source code for the client, and we haven't open sourced it yet, just mostly because we're still refining it, and I'm gonna— full disclosure, we're scared about people hitting the API like too frequently. APIs are naturally easy to manipulate and to break. Most people will use like some kind of HTTP header to like validate that the API is correct so they can limit on the bandwidth. And since this is a free service, um, we don't want people hammering the service because we're going to basically be spending a ton of money to keep this afloat. So that is solely the only reason that this is closed source, just so people won't reverse engineer the header stuff we're doing for, for the API requests. There's, there's nothing else going on other than that. So there's a lot of stuff that happens in the client, namely the deduping of data and the normalization of the data. So when we actually fetch from the client, we pull down the data and we minify it into one master file. So we take all the separate intel feeds and we combine them into one master file and then generate the proper Bro scripts that are needed to include that. The other cool thing about the client is if you opt into— it's turned off by default, but you can actually turn it on to control the Bro process. So if, if new data is added to your local.bro, you don't need to specifically go and restart Bro manually for those new scripts to be loaded in. The Critical Stack Intel client will actually reload Bro if it sees that the checksum for the local.bro file has changed. And like I said, that's off by default, but you can turn it on. I personally turn it on just because I hate having to mess with Bro Control all the time, and I'd much rather just something running in the background that made that happen for me. So that's kind of why we added it. So back to the client. So installing— we support a bunch of different operating systems for this, actually all Linux-based but different distro flavors. So we have a Debian dev package, we have an RPM package, we support Red Hat, CentOS, Scientific Linux, Fedora, AWS, any kind of AMI, and then obviously Ubuntu, Debian, and those guys. So installing is super simple. You just copy this one-line command and we'll paste this in here. So basically what the bootstrap curl script does— curl script, rather— what that does is basically just adds the PKA or the, the AppGet package information for it. Once that's done, we can just sudo install like normal. So it's CriticalSAC Intel, and currently right now we're at version 0.2.8. We have a changelog that's in, in the package if anybody's interested in that. So once the client's downloaded, we just need to add our API key, and the actual post-install script that comes with the .deb outputs that to the console, so it's kind of just a little reminder. So we can go back to our sensor, the new one we just created, Copy the API key, do sudo criticalstackintel API key, paste the API key in. Oops, copy that properly there. And once you paste the API key in, it actually will do its initial fetch, its initial fetch right off the bat. So you can see from the feedback to standard out API key added, initial fetch, we grabbed the Cybercrime Tracker and then these 4 other feeds, created our master public.bro.dat, and the include in the local.bro was added automatically. So this basically comes— becomes operational right off the bat, and essentially all we have to do from this, this point going forward is just restart broctl unless we want to add the configuration option to restart that automatically. And to do that, we kind of copied the whole, uh, I don't know if you guys use Git for version control, but the way they do it is basically, you know, subcommand command, and that's kind of how the whole CLI user experience happens. And we copied the same output for that. So if you do Critical Stack Intel help and then config, you'll get these options where you can say config -a to list all the available config options, or l -l to list the set configuration options. So what we'll do is we'll just run this and do -l. So we have none set, so we can list the available. And right now this is, this is like kind of a little bit ghetto because we don't have descriptions for what these, these actually mean right now. We're working on that and adding that pretty soon, actually, probably next week. But it's, it's pretty self-explanatory. So we have like bro.include— this one's a boolean. So if you want the include to be added to your local.bro automatically, you can set that. If the critical stack Intel client doesn't find where Bro exists automatically, you can set the paths specifically into the client. You can tell it to create the master file or or not to create the master file. You can drop permissions to specific users or groups and also set a proxy. So that's pretty much about it. I mean, for the Intel client, we try to make it as easy as possible, you know, going straight from, from signing up to creating a collection, subscribing to what feeds you want, and being able to deploy them. The client was kind of like a necessary evil just because we had to do so much client-side operations to dedupe and kind of do the minification of the separate Bro feeds. I don't know if you guys have done much benchmarking with the Bro intel framework as far as the amount of indicators that can be ingested before performance hits happen, but it's very touchy, right? And there's some stuff you can do on the minification or the packaging of the intel to optimize for that, and that's one of the other things that, that we're kind of focused on. Right now. To talk about the future, in the future we're going to be shipping each intel feed as a bloom filter specifically. Bro doesn't support loading bloom filters right now, but there's no reason that people can't leverage the bloom filters outside of, out of Bro. And it's also cool just to be able to pull down a brand new bloom filter of each feed as they change. Our client will be leveraging it in some specific areas, not directly related with Bro, but you'll be able to utilize it for like whitelisting or things like that. So that's pretty much it about the Bro Intel. I can open up for questions real quick before I switch to the next part.
I guess I have a question. How do you see people using this, or foresee people using this? With the collective intelligence framework? Do you see this as like a complementary tool or something that might usurp that?
Yeah, I mean, I would look at it as a complementary tool. I mean, right now we're not trying to output it— output into any different formats. We're not doing anything around indicator version control, audit trails for specific indicators, or anything like that. So our forte is essentially just making indicator actionable with a click. The bad thing about most stuff like, you know, ThreatStream and ThreatConnect is like, you know, you'll get your intel, but it's still your job to do the deployment. What those guys don't really understand is that, you know, aggregating the intel is not necessarily the hard part. It's having to actually deploy that crap to like, you know, 100 different sensors and make sure like the intel that I have at those 100 different sensors is the right stuff. And, you know, if I— in the bad situation where, you know, 50% of my sensors have completely different rule sets than the other 50, it's a nightmare, right? So that's kind of what we're trying to solve. We're trying to solve that part specifically right now, but also at the same time encourage people to leverage the Bro intel framework more heavily. Because it's not like— it's not like a one-to-one, right? Like when you use something like Suricata or Snort, I mean, you specifically have to tell it what to match against. Bro is cool because I can load this intel in and match against pretty much anything that has, you know, an IPv4 address or has like a type domain or type URL. It just does it all automagically. So we just want people to learn that they can use that more heavily but also kind of alleviate the pains of deployment.
Okay, you guys have a user's mailing list?
Uh, we don't have a mailing list right now. Like, uh, right now we're actually using Zendesk for most of our FAQs and, um, questions from users. So if you're in the application or if you're in the main landing play, yeah, it's, it's just right there. We have a whole bunch of stuff. Richard wrote up some— yeah, Richard, Richard Bate, like, wrote up some stuff about, like, deploying it on, like, Security Onion and and a few other different systems, and then there's some stuff on the configuration options as well. I didn't really walk over this, but we actually— we have whitelisting built into the client as well. So if you guys maintain your own whitelist— yeah, so like when it's building the minified file, it will check your whitelist and it will remove stuff that's in your whitelist, which was super helpful when we were actually using it in production for ourselves. So it's important to note that like this isn't just some like open source thing we just threw out there. We utilize this day to day when we do consulting stuff. So most of the realistic, you know, real-life scenarios and kind of the pitfalls and pains that people would run into trying to leverage the Bro intel framework at a large-scale environment is what we're solving, because it solves a problem for us too. We're just happening to kind of open, open sourcing it in a parallel nature.
So that way you can't accidentally blacklist your top-level domain.
Yeah, well, I guess you could. You could definitely do that.
He's not speaking from experience, is he? No, not that this has ever happened to me. Did you use a wildcard? Uh, shoot. I have a question, Dustin. Do you know if there'll be any— maybe this now, but if they'll get any support in the future for maybe adding your own feeds. Say if we have, the NTSA, I run a few different analysis systems that generate CSV files with indicator types in there. And it'd be really nice to be able to leverage something like this to, if I can incorporate that into your web interface. Say, hey, grab this CSV file and make it Bro formatted or something like that. Have you guys thought about that at all?
Yeah, that's, that's actually a great question. So the short answer to that is yes, we definitely are going to do that. The long answer to that— I guess I just should have started off with the answer. I don't know what I'm talking about. All right, so the answer to that is, is yes, we're going to do that. And the reason why is because you would be surprised. So like, I don't know if you guys have done any custom aggregation of feeds before, like if you guys tried to pull in a bunch of like the random feeds that are out there, it is very unreliable. For example, I'm not going to name names here, but I actually was requesting a feed and I was getting a 200 OK status, but I was getting like this MySQL error and like just the text MySQL error coming back when it was a 200 OK status. You know, like all these guys, these guys are doing this for free, right? These guys don't have time to maintain it. They don't have time to make sure that like they have 99% uptime of their feeds. That's another thing that we want to try to solve, right? We want to make a free service where anybody can use us to host their stuff, right? Like, you know, there's, there's a lot of other options to do that, right? Like, you could go host it on GitHub, or you could go host it on Bitbucket, or all these other places. But the cool stuff, the cool thing with us is that, you know, our client is going to be optimized to basically make those actionable. So it's up to you. I mean, if you want to go the whole Bitbucket source control route, or if you want to host your feeds with us, We don't really care. We just want to make it there in case people want to leverage it, and we want to leverage it ourselves. One of the things we're trying to accomplish right now is to iterate over all of the PDF reports that have been output on like APT Groups and take intelligence out of those PDF reports and throw those into the Bro Intel Framework format. So while we're creating our own custom feeds, we're going to need some solution to post them as well. So that's That's kind of the reason why we're doing it, is for the community, but also to make it easier for us to put our stuff out there and free to the community.
Hey, Dustin, I'm sorry, I have one more question. I know you're trying to get to the next part of the talk.
No, sure, man, it's cool.
So I've been taking a look at a lot of the Intel-type stuff for campus security, and One of the things that I found when I talked to, I think it was ThreatStream, they were asking for access to some of our API keys and like they had sort of this, they didn't exactly call it mandatory, but they basically wanted us to share back the stuff we were pulling in from other sources. And we like the idea of that in certain cases, but there's certain feeds that we have that we have restrictions around that we can't really share back. Do we have that flexibility with, like, if we were to use CriticalStacks product, is that something that, you know, we sort of have that leeway to say whether or not we want to share those back?
Yeah, so we actually, we don't collect any data. You don't have to share anything with us unless you want to.
Okay.
And by want to, I mean you would actually have to physically send us an email because there's no method to do that and there probably never will be.
Okay, interesting enhancement later on.
Yeah, I mean, we— well, we've thought about it from like— so the only reason we've thought about it a little bit is for enhancing the effectiveness of the way Bro looks for matches against its intel framework. So we've thought about basically saying like, hey, if we get a fire from the intel framework and in the log, it would be cool to show the effectiveness is some kind of average or a sum. On how many specific pieces of intel are firing from what feeds. We've thought about that, but when you, when you start to walk that line, it gets really sketchy, right? And we don't want any reason for the community to think we're, we're doing anything invasive. And since this is a free service and we're not trying to monetize this at all, it's not really worth it for us. We're totally open for anybody building capabilities on top of it to do that. That's fine. But it's just not something on our purview right now. With that said, though, we are working on the ability for private feeds. So there's a lot of talk right now about the government basically sharing proprietary feeds, proprietary intelligence with certain, like, certain organizations or certain communities. There's also feeds privately held by, you know, different organizations that want to sell to, like, or not sell, but share to people in their specific networks. We are building stuff in right now to handle that capability. So the way that that would work is when you went to the feed page, instead of seeing— actually, when you went into a collection, instead of seeing the subscribe button, you would basically see a button that said request permission. And what that would do is that would actually send an email to the person that maintains the feed that would say like, okay, you're from Facebook or, or you do security for a university, or, you know, you work for, you know, somebody at the government or whatever, sure, we're going to give you access to that. And then that access is going to be directly linked with your Critical Stack account, and then you can start to subscribe to private feeds. So that is one thing we're working on right now, and mostly the user experience around, you know, if I'm, if I'm a feed organizer and controller What's the easiest low-touch interface that I can deal with for approving and denying people? So that's kind of what we're working on next.
Oh, cool. Thanks.
Cool.
So I know it kind of— If anybody has questions that are remote, you're able to unmute yourself, so feel free to do so. And then ask the question and then mute yourself again. Go ahead, Justin.
I was just going to ask if anybody had any more questions before we move on to the next part. Cool, sounds good. All right, I'm going to ask for like 1-second break. I'll let you guys take a 1-second break. I got to grab another beer, so hold on 1 second.
Hey, where's our beer, Jon? Budweiser's in St. Louis. Speaking of, um, there was a post on the, uh, Buro mailing list, uh, earlier, I think it was last week, where a guy contributed. He Steve's GitHub repo for a tool here called Bro-GTL JASP generator. I should have added this to the notes, but I forgot about it. But he brought up when he was talking about generating the— pulling the data from the reports such as the mandated report, the big one anyway. You could actually— there's a tool that you can actually use to actually do that for you. I haven't had a chance to look at it. I don't know how good it is, but it would be worth checking out. Shell scripts called Intel Energy Core Generator, and I will post it in the notes after the meeting. So, just so everybody's interested in it, I'll post it in the chat right now. Cool, awesome.
Alright, so the next thing that I want to kind of talk about was kind of split in two parts. I want to talk about this little kind of side project I've been working on, which is called Brotop. And the other kind of half to that is the Go programming language, as far as, you know, how it can be useful with security data or security type applications. The Brotop is a pretty simple thing actually. So basically all it does is it's a spooler for the Bro logs. Converts it into the JSON format and kind of streams it to a web browser. And the initial reason that I wrote this application was for debugging. This is what it looks like right here. Can you guys still see my screen okay?
Yeah, looks good.
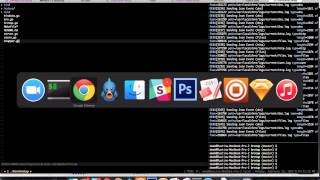
Cool. So the graph that's at the bottom left-hand corner is just like a load graph. So each specific log, it's kind of graphing the logs per second. And then we get kind of this output where we can see, you know, the real-time output of each of these Bro logs, the last 5 lines. And if we want kind of like a more detailed view, we can click in and start to get, you know, all the output. We buffer it to like 500 events, but outside of that, you know, you're gonna have to go cat the log. But I wrote this because I was doing a lot of stuff with the Intel Framework and I was getting really tired about I was getting really tired and frustrated with having to cat the logs or specific, you know, specific Bro logs to see if what I was expecting to see was there. So I wrote this really quickly to kind of make it a lot easier for me to do that. I open sourced it, so it's out on GitHub. If you go to github.com/mefuck/brotop, you can download it and build it yourself. I haven't put any binaries there for download, but I'm gonna do that soon. It's cross-platform. Everything's self-contained in the binary. You don't have to run different processes. You just run it once and it works. So if you can see my terminal, a few of the cool features that involved is, is Brotop will actually search your system for Bro logs. By default, it will look in /opt/bro, or we'll look in /usr/local/bro. And try to pull those in automatically. But if for some reason you have your Bro in a very custom setup, you can do --path and supply those paths manually. So when you run it, it just works, spins it up, you'll start getting feedback. And I have— this presentation application like puts this thing right at the top and I can't see my tabs. Hold on here. So CNN's like notorious for like basically loading a ton of crap, so I usually use that for demos just to load that and watch madness happen. Um, so I mean, it's just kind of out-of-the-box solution. It just works right off the bat. Um, but the cooler stuff that's involved in Bro is kind of the, the code that's set up. And I don't know if anybody or any of you guys program in Go. Um, but there's been a ton of useful information or a ton of useful applications that have been kind of emerging recently, and one of those specifically is HEKA. If you don't know what HEKA is, I highly suggest taking a look at it. If you're doing any type of stream processing or log collection or any kind of real-time analytics on security data, like, this is the tool you definitely should be using. The easiest way to explain is it's basically Elsa without the UI, but a very different Elsa not built in, in Perl or, or, you know, using— I don't even know what else he uses, but it's very different from that. It's very high performance, very scalable, and it's built by Mozilla. It comes pre-packaged with encoders and decoders for a lot of specific things. So right off the bat, a ton of the different log formats that you would be expecting would be already pre-built into the database. It supports GUP decoding, all this cool stuff. So while the logs are actually flowing through, um, whatever processing system you're using, you can start to build on top of that data. One of the cool, I guess, examples of what you could do with that is building profiles of specific traffic or building profiles of specific logs generated by specific boxes. And kind of matching those against some, some greater database. But the overarching kind of theme here is that that's built in Go. A ton of cool security stuff is emerging that's built in Go, and Docker is going to be a whole different world for, I think, for security, as far as security is concerned. And that's an area that I think a lot of people aren't kind of looking at. There's a lot of cool security work that can be done there as far as doing monitoring inside of Docker containers. And I could definitely foresee Docker being used more heavily for, like, system-critical applications. Not that it's more secure, it's just much easier to maintain and to deal with the deployment of those. But that's also going to be a gap in our visibility unless we get some kind of monitoring inside those containers and relaying that data back into some main collection area. And Go is just great for that because Docker's built in Go. HEKA is a great stream processing thing built specifically for security, and that's in Go. So just kind of one of those things where it's a language that's going to facilitate a lot of cool stuff that can be built regarding security. And Brotop's one of those things that I'm trying to leverage now. So if you jump into programming with Go, you can grab the Brotop repository and you can kind of mix and match or pull stuff out that you need, right? So if we look in the wrapper portion, everything that has to do with actually tailing the log files is already built in here, and the outputting is actually using a Go channel, which is basically a fancy way of saying, you know, it's— a Go channel is essentially just a thread. So Brotop spins up a thread, throws data to that specific thread, and that thread deals with the processing of that output. So if we look in here, here's where we actually do the conversion from the channel to, to the JSON where we grab the specific fields, map that to it, and then output that as JSON data. So it'd be really easy to take this library and manipulate that data to output to any format you'd want, whether you were inserting into InfluxDB or into Splunk or whatever. There's probably other stuff that exists for that right now, but I guess it's always, always nice to have a library that you can embed into an application that you're building for a specific specific reason. Um, so that's, that's Brotop. I mean, very trivial right now. I'm going to be adding a lot of stuff. Um, one thing that I'm working on right now is integrating that with Bevly. It's a really weird name, but, um, I'll show you this. There we go. Bevly. I don't know, does anyone know how to pronounce that? B-L-E-V-L-Y. Anyway, weird name, but, but essentially this is another Go library that's essentially Elasticsearch. If you wanted to build your own Elasticsearch, this, this is what you would pick to build it. It does all the text indexing for you. It auto-generates facets based off the data that you index, and the API couldn't be simpler. I mean, you simply throw a struct into it and bam, you get all the indexing power that you would get out of out of Elasticsearch. So if we map this struct to a JSON object, it's basically indexing JSON data, and it's simply just a method call to get the facet output. So one of the things I'm doing right now is integrating that project into Brotop so we can have a specific search and filtering capability for each specific Bro log. So I can say, like, you know, if I'm tailing HTTP log and I only care if the request is this. I only care if the status was this. I only care if, you know, the payload contained, you know, this certain byte sequence or whatever, right? That's not actionable. This is never something you'd be able to take into like an IR investigation and actually use realistically, but for debugging it's really nice, or if for one-off situations where you have some, you know, high-critical system or something. Maybe there's a use case there. But yeah, that's Brotop. I can open up for questions if anybody has any. Does anybody use Go right now for anything that's listening?
No, no, I don't. I've been wanting to play around with it. I just haven't had a chance to use it yet. Kind of interesting what you're saying about containers though, because I happen to know like here at the university we're starting some research into that area. There's actually some fear that there might be some security holes in containers of SEL specifically. Oh yeah. Side channel listening. RAM or cache, maybe even kernel access.
So I'll give you a hot one. This is something that not very many people are aware of. There's a lot of hosting companies right now, and I— damn, I don't even know what the legal words to say, hey, don't blame me for this if you use this for anything evil. But anyways, this is what you can do, right? So a lot of companies that do hosting they'll actually spin up a ton of Linux containers, like whether it's Docker or it's an LXC container. Newer versions of the kernel actually package the Linux audit APIs, or they come with a lot of Linux audit APIs right off the bat. Basically what that means is you can use stuff like auditd to basically record the system calls from the host machine. So inside a Linux container, the Linux audit APIs basically leak into the containers, right? So theoretically, you can spin up a container on one of those hosting providers, use AuditD, and you can actually collect system calls from all the other containers. There's not a lot that you can do with that. Actually, there's a lot you could do. You could, you could basically determine pretty much any process or anything that's running on everybody's container. But those are the kind of scary things that exist right now in that world. It's like you just don't know, like you don't get certainty about what exists in the kernel land and what can actually slip into the container land. And just talking to your point, that's a reality. Like, that's a real problem that exists right now.
Do you know if you can get arguments to syscalls in Auditd? 'Cause I'd be interested if you did, if someone did the password command and then there's a read to read in the bytes for the actual text that's sent for the password. I wonder, I don't know, I'm just thinking out loud.
Yeah, dude, yeah. So I mean, with AuditD, when you're collecting the system calls with AuditD, you can go as far as to say you could, you could track so much data that you can say if the Apache process ever has an execcv system call to spin up a child process that doesn't belong to Apache, that should never belong as a child process to Apache, then alert me. But you can also collect the system calls for anything that's run at the terminal level, right? So you can actually have an alert that fires that says like, you know, someone ran this specific command with these arguments with this output. Or you could say, you know, this specific process made this network connection or received this network connection on this specific port and sent this much data. There's a lot of really interesting information you can still get from the kernel that I don't think a lot of people are leveraging properly yet. Like I said before, Sysdig is one of, you know, the projects that's kind of making this a lot easier to do. You know, attributing network data, network traffic to a specific process used to be a very hard thing to do. And it still is a hard thing to do, actually, but there's a lot of stuff that's coming along that's making that a lot easier. Like just being able to say, like, you know, proc name, file descriptor name, event is accept, and proc.name does not equal HTTP. Like just being able to say like anything that's not HTTP that's doing a network accept system call, like that's crazy powerful if you're collecting on the right boxes. But yeah, back to your point, like yeah, you could collect all of that data very simply.
Yeah, I know they don't have a namespace for like The dmesg, the kernel buffer, the log buffer, because you can do dmesg in the container and get information from the host too.
Yeah, exactly, man. And it's like, it's one of those things, man. It's like when you get hipsters building infrastructure, that's just something you have to deal with, right? Like everybody wants to use containers because containers are cool and easy to deploy. And just to be like, I love containers. I mean, it makes things a lot easier, but you're definitely taking a huge risk when you're using them because we just haven't filled out that area very much. You know, who knows what kind of gaping holes as far as security is involved that exists in that, but it's scary because huge, you know, Fortune 100 companies are leveraging it like crazy. You know, I was just— I was talking just to a huge company just a couple months ago that's, you know, essentially ported all of their infrastructure to running as Docker containers, like in a Docker cluster. Yeah, I mean, it's just, it's crazy, man. It's taking huge leaps like—
We are aware of some of this stuff. I know that for the one project here at ITI, they're working on working with Intel on trying to mitigate some of this stuff. Intel is willing to actually like deploy a chip with a segregated cache space for use specifically for containers.
So like the Intel VXT thing or— so like controlling virtualization at the hardware level?
Exactly. Kind of like increase some of the security that we know is out there while not taking a step back towards virtual machines, right?
Yeah, I mean, that's definitely an approach to that. The only downside to that is, is people have to replace their current infrastructure to support it, right? And as we've seen with past situations, like, that's a huge hope, right? Most of, like, the control infrastructure right now for most of, like, let's take GE, for example. Most of GE's manufacturing, you know, facilities are running on, you know, operating systems that would, you know, terrify anybody that does pen testing. It's one of the things, right? Like, you know, the further we advance in that side, the further we're gonna go back in security. But that's the cool thing, right? We'll all have jobs forever.
So yeah, on one side or the other.
Yeah, so bring it, man. I don't give a shit. I'll still get paid.
Any questions for anybody else, even remotely? No, that was cool.
Oh, I didn't look in the chat, my bad.
There's nothing there yet. Uh, if anybody has questions that are remote would like to place in the chat, we can read it, so please do so.
I will answer anything, even non-security related.
Your Social Security number? What kind of beer are you drinking?
Man, if I told you, man, you would probably talk shit on me, man. I'm actually drinking a Heineken. Don't hate me. It's just, it is what it is, guys. That's a good question. I was actually— when you guys were talking at the beginning, I was thinking that exact same thing. I mean, I would love to, man. I think— I think that I was gonna say that at the beginning, like, guys, like, so I've been in, you know, NSM-related stuff for a very long time. You know, I remember when Bam was still working on 1.0 of Squeal, and that was freaking ages ago. But we've never had like a community, or we've never had a get-together of people that, that are real NSM, you know, aficionados, I think, until you guys set this up. And that just blows my mind, right? Um, so I want to thank you guys so much for, for putting this together. Like, it's— you guys should give yourself a pat on the back because you're the first people that actually took initiative to actually set it up. And, you know, I think it's going to be a big deal, and I think we can, can really get NSM out there to way more people.
I appreciate that, man. Kudos to Jon for that one. You said all this in Richard's book. Yeah, Richard Delverault. Yeah, I saw it. I see it. I think he recommended in the last chapter, the last, even really the last couple of pages of, I think it was the Practical Network Streamlining book that he came out with, that focused on security onion. And I saw that the idea of, you know, having discussion groups or user groups. I felt like I already run, with Waylon, we run the Linux user group on campus. So I decided, why not have an NSM group as well? This is a big thing right now, and it will continue to be. So, yeah, I just kind of went with it from there. So, yeah. Hey, I do thank you for contributing, and then Dustin, and donating your time. You did a really good talk, and I think we all really enjoyed it. We will have this video recorded and online probably tonight. So, you know, we have a YouTube channel and all that. So we will try to keep everything documented as well as in the notes. And I would want to point out before we sign off here is that I did an article that has basically an overview or more detailed a description of what OpenNSM is, what it's supposed to be, and what we would like to do. And we want to be more research-focused, so we're talking about doing actual research, publishing papers, and the big thing right now is that we're looking into is just getting a lab set up. And right now I'm trying to find a sponsor for rack space and electricity and power, and then the other big thing is just hardware. Servers and hard drives and RAM and all that. That's the big thing we're looking for right now. If anybody has ideas for where I can look or who I can ask for help, it would be greatly appreciated. But yeah, I'll post a link to that article in the chat. And if anyone has anything else to say, I believe that's— Piney, Keyster, they go together. I believe that concludes That concludes today's meeting. Thanks, Dustin. Yeah, thanks, man. That was a really good talk. Thanks for coming out. Yeah, thanks a lot.
Yeah, thank you guys for putting this together, man. You guys are doing great stuff.
Thank you. And next week, it looks like we'll have GRR, the Google Rapid Response Framework tool, next week. So the two national Googlers will be on to talk about that. And that's two of my projects this year, Intel Framework and, uh, GRR. GRR, you're loving it, aren't you? All right, take care everyone, have a good night. It's an egg. It's delicious German chocolate, and inside there's a small toy. I see it. Do you think it's from— Huh. Like, two trees. You kidding? They're from Germany.
More from Jon


What No One Knows the Podcast / Vodcast featuring The Tampa Bay Wave and Jon Schipp

Meeting the Exposure Management Challenge: Key Use Cases for Success | @OfficialRapid7 #SolutionSpotlight

Spot Security Control Gaps and Non-Compliant Resources Across Your Attack Surface






