OpenNSM (ElasticNSM - Matt Bromiley, Brian Marks)
Matt Bromiley and Brian Marks demonstrate Elastic NSM, a network security monitoring system built on the ELK stack. They show how to pipe Bro and Suricata logs into Elasticsearch as JSON, then use Kibana dashboards to visualize malware traffic, spot alerts like the Nuclear Exploit Kit, and correlate file hashes and C2 check-ins from a single PCAP.
Chapters
Alright, so back to Snort. Again, all this— so Snort 2.9.27 was released and added support for Cisco Fabric path decoding and encoding. Also, there was an issue resolved in the normalization preprocessors having issues with packet resizing, and that has been fixed. Moving along, this is a really interesting thread on Information Security Stack Exchange. Group. The guy was asking about evading IDS in exploit development, and he pointed out based on his research two things that can be done to evade intrusion detection systems, and they're susceptible to many of them, mostly being— or the main one— they both rely on compression, but according to him, and I believe this is true, is that you see IDS like Bro and Snort sort of come up only look at the first or last compression key. So if you compress multiple times, you only get the first or last decompressed, and that data will then be compressed and your signature should lock the next payload. So that is something interesting, uh, so keep in mind. Also, you can check out the links for more and more detailed information on those items. So I'd recommend checking that out. Also, Wireshark 1.99.4 was released. It's mostly a developmental release. And 2.9.72 install has already been prepackaged and available in Security Onion, so you can do hack-get install and you'll have that. Also, Security Onion, this is a big move for them, is that they moved all their stuff, the scripts, to GitHub. So now it should be easier to contribute. I actually got a message from Doug the other day about some patches that I need to get— make a full request to that, please, at one time to see if they have repositories for each of the packages. So do check that out. Moving on to conference. There's lots of conferences coming up. BSIDE Chicago is May 16th. ThoughtCon is also in Chicago, and that's the same weekend. And Shane's going to ThoughtCon, is that correct? Yes, I think— Similar sometime numbers. Like Whitney is giving a talk there. Oh, Whitney's giving a talk? She hasn't been here in a while, but she's done it before. Great. Yeah, I'm actually only going to that too, but that's Hamvention again, and my heart relies on through, uh, Hamvention. So I hope they'll find some cool stuff and bring it back. I think this is Thursday and Friday though, is that the same time as Hamvention? Oh, is Thursday and Friday? DotCon is Thursday and Friday. Oh, sorry, yeah, that's right, the 15th would be— okay, yeah, so that's actually— I guess I could make it to South Bend if I wanted to. Tickets are still available. But, uh, but, uh, yeah, it's too much, too much in a single weekend. I actually have to go after ImageCon right back to Indiana for a wedding, and then I have something else to do around that time as well, so I have a lot of travel to go. Anyways, BroCon is coming up in August. It'll be hosted at MIT. It's a hard way, but I shall be there, I expect. So if you're interested in BRO, I highly recommend the official BRO conference. Also, Layla and I will be at AIED at Helen Marshall University in West Virginia, the Appalachian Institute for Digital Evidence conference. They hold it every year. I'll be giving a talk on ILIT. I think so, Layla will be as well. We're co-authoring a talk, and it's about the training environment for Linux, based on Linux containers and using NSM zero-traffic tools. So that's kind of cool. I'm also going to run into Tool Tray here. So this is a new plugin that was written for Bro, and essentially, so whenever you're working with Bro, typically you will do— a lot of people will use Bro Exchange so that you can just have access to the container nodes to start, start the job. And well, That's not the best way to do it. The best way to do it is to use Perl processing capabilities so you can actually divide off the specific access control for specific things such as, in this case, we need netadmin, net role to start up the interface and have Bro be able to bind to the interface and sniff, sniff for traffic. So this guy wrote a Bro control, or excuse me, he wrote a Bro control plugin that actually does the set caps lock for you automatically and it gives you a capnet role and capnet admin versions on the real binary. But just basically the same design. Prior to that, you have to go log in each node and put that on the binary. But this, with this, you just pass in the plugin, and prior— or when it— when it runs, excuse me, when it controls the brand, it lets you make sure that that is applied to the binary. So that's kind of nice. Also, I came across this Malcom tool. This is a malware communications analyzer that I haven't played with yet. Essentially, it's a way to visually represent network connections and associated malware. So you can see they give you two examples, like, uh, DNS stuff, peer-to-peer, backlogged DNS. It gives you a nice little pretty graphical view of nodes and the communication between them on the network. So that's kind of a cool tool. Hopefully, we'll get a layer of that in the future as well. Jon Schipp is saying that it is kind of wonderful. So does anybody else have any problems?
Thank you.
Okay, so, um, this is the first time you've run audio problems, I think, so I guess that's something good.
Can you guys hear me now?
I don't know. Um, test, test. Is anything just completely missed?
Hey, Jon, this is Matt. I just want to confirm, can you hear me?
Yes, I can hear you, Matt.
All right, cool. The only thing I'd say is— okay, all right, I got Matt is clear, which— all right, sorry for loud and clear. All right, everyone, gotcha. The only thing I'd say is go back to— thanks, Zach— go back to the thing you were just talking about, you were just going over.
The mail column?
Yes, thank you.
Yeah, yeah.
Let's try that. So let's go back to here. So again, we talked about the BroControl tempcat plugin where you can actually have the capability to sit on the Bro binary through the BroControl plugins that we started to roll out automatically, which saves you a lot of time. And if you had to do it manually, the other tool that we have today on the tool tray is the tool called Malcolm. It's a malware communications analyzer that essentially looks at C&C data, task logs, DNS, all kinds of stuff, and gives you a mind map almost, or a peer-to-peer map between all the hosts and when they were talking to each other and whatnot. So that's actually a cool visual representation of machines you would have on your network, and you can use it to correlate specific attacks. So, and actually do investigations of where different pieces of malware connect to and connect from. So that, that's a tool that we would like to explore in the future. So do check that out, and this is the GitHub address right here. Next section, we're going to go into EMVDB, and is Dustin on the call? Dustin is not. Dustin is going to drop in. Talk about this tool that he's working on now. It's a brand new tool and it is essentially, it looks to me, a front end to OSQuery. So Facebook is working on a tool called OSQuery which allows you to query system data across all of your computers and return them to a central server. And then this tool allows you to make the query and then actually have it in a graphical form. So you don't have to use the command line tools. And you can see here, you can select everything from processes, and this will grab all the processes running on all the hosts that you have. You can see the— you can actually click on specific ones and actually query them themselves, it looks like. So that's kind of quite interesting. So do check that out. We do plan on doing more investigations into OS Query in the future. All right, and now, given that Max and Brian seem to have no audio trouble over there, we're going to go ahead and pass it to them to give their talk today called Elastic NSM Using the ELK Stack. So, a brief introduction. Max is also known as 505forensics, is a consultant who works in digital forensics and incident response. He's working, basically doing downstream audio deployments for a large number of finds businesses including this one, which is actually quite impressive, 175,000 full-time employees. So, props to you on that, Matt. And Brian Morris also works with Matt, and he has been an engineer at the Interior here at the Department of Defense, or a contractor, I should say, also working in similar areas with incident response, intrusion detection, and digital forensics. So, I'm going to go ahead and pass it off to you guys. I'm going to go ahead and— I'm going to stop my screen. And then one of you can pick up by clicking on share screen.
Great.
Okay, Matt, I'll go ahead and share my screen. And so, yeah, my name is Brian Marks.
Hai ji.
My screen that I'm sharing out. See that all right?
Yeah, Brian, we can see you.
Okay. Yeah, so I work with Matt Bromley. I'm in the San Francisco office. He's in Dallas, and so I may be in San Francisco, but I travel all over. I'm on the East Coast right now. Matt, why don't you go ahead and give us an intro to Elasticsearch?
Yeah, yeah, so no, first and foremost, thanks, thanks, Jon and the OpenNMS team group for having us on here. I got to be honest, I started hearing about your group, and I think we've been in contact for a couple months now, but as soon as I started hearing, I was like, I want to get on here. I want to help share and spread the knowledge, spread the word. So as the introductions went over, Brian and I have been doing this for a little bit now. Our experience ranges from, from incident response to data breaches and all that kind of stuff. But probably one of the more exciting projects that at least I've ever done— I'm sure Brian's gonna agree with me— has been deploying network security monitoring tools. And there's a lot of great products out there. I don't need to tell this group. It just so happens that in a lot of our work we keep stumbling on Elasticsearch, and we keep utilizing this as a tool. Now, it's a little bit out of this scope, but we've actually ported Elasticsearch into uses for digital forensics, incident response, large-scale log analysis. And for this purpose, we're going to be talking about something that we've dubbed Elastic NSM, which is really using Elasticsearch for the purpose of network security monitoring. So monitoring network data interacting with data of that sort and really kind of using the power of the GUI front end and the indexing and the visualizations to help drive investigations, to help, you know, find out knowledge faster. So there's a lot of kind of terms been thrown around. The biggest one is the ELK stack. The ELK stack is Elasticsearch, Logstash, and Kibana, and all of this comes from the web— or the company that Brian got brought up now called Elastic. They had their first con back in mid-March, and they renamed themselves from Elasticsearch to Elastic. They bought Elasticsearch as a service in the process, and they threw this awesome conference. So they had a pretty big week where they got a new name, a new acquisition, some new employees, and, and a little more money, I'm sure, at some point. But they're a great tool. Anyway, Brian, let's take a look at the products list. Just to kind of show the list of what we got here. From Elastic—
Oops.
Kind of going through—
You're cutting in and out, Matt.
I'll do my best to not cut in and out.
There we go.
Anywho, Elasticsearch, Logstash, and Kibana make up our ELK Stack. You can see there's other products here listed as well. Shield, Marvel, and Elasticsearch Apache Hadoop, and then language clients. Those are also equally fantastic products.
Shield—
scroll up a little bit, Bryan— Shield is actually related to security around Elasticsearch. Marvel is a fantastic kind of insight, a monitoring tool. Gives fantastic visualizations of what's going on with your cluster, because as you can imagine, people are spinning up thousands of nodes at a time. Elasticsearch for Hadoop is fairly self-explanatory. It's using Elasticsearch to index data that's in Hadoop. We're going to focus on the top 3. Elasticsearch, to begin, is your indexing tool. Elasticsearch sits on top of Apache Lucene, or I should say it's built around Apache Lucene, which is an extremely powerful Java-based indexing and searching tool. Elasticsearch wraps a great API API around it. Well, they put a good HTTP API. There's also other API clients as well that they built in, and it just makes the data really, really fun and easy to interact with and work with, and more importantly, get inside the data store. And we'll talk a little bit about that as well. Logstash is— I consider Logstash the pusher, the worker, if you will. If you need to get something into Elasticsearch, Logstash is going to be one of the easiest ways to do it. It has all of the connectors built in. It's got an API built in, if you will. It talks to Elasticsearch very, very well. And you can take basically a flat text file of any kind, as well as binary formats too. But you can take a text file or anything of any kind and push it up to Elasticsearch using Logstash. And we'll go over some of the configuration options for that. And then last but not least, there's Kibana. Kibana is the open-source data viz frontend. It's a beautiful AngularJS app. Right now it's a Node.js app, but there is also just an Angular app as well that we're gonna show off. But that lets you interact with your data in a way that a lot of tools really don't. So, you know, Brian's gonna walk us through a little bit of kind of setting these up and how to bring all these tools together and stuff. But keep in mind too, any questions anyone has, please throw them out there. Please interrupt us, please ask. We'll be happy to answer. But Brian, why don't you go ahead and take us a little bit through setting this up?
Okay, so I'm not sure how much experience everyone there has with Elasticsearch, if you guys have been using it for months or years or whatever. So I'm gonna go through a quick setup. If you use this tool, it may be a little bit boring, but just bear with us and we'll get to some cool stuff with network security.
I think the beauty of Brian walking through this setup is that we can do it in about maybe 5 minutes at most.
Right, yeah, so okay, here I'm gonna grab Elasticsearch, grab the tar. And then I'm also gonna grab—
So while Brian's pulling all these down, we will say too, there's lots of data and lots of resources out there about ELK using, bringing all of this stuff together, the configuration files and everything. I'll talk a little bit about this further, but Yeah, all right, Brian, cool.
Kibana.
Okay, and then so Kibana 4 is the latest. For this presentation, we're gonna use 3, so we jumped on the past releases.
And Kibana 3.
So this is what I was talking about a little bit earlier. Kibana 4 is actually a Node app, an Angular Node app, and it's super powerful, and it does fantastic aggregations. The only thing is it takes— and this is not a fault of anyone, just the way it is— it takes a little bit longer to get up and running, whereas with Kibana 3.1.2, we can actually get into analytics very, very, very fast. So don't think we're using the outdated version or the older version to, you know, limit the group's exposure, if you will. It's just more of a demonstration, and 3 gets us there quicker.
Okay, so There we go, we got Olaf. Sorry, was there a question?
Yeah, can you just blow up that module a bit?
Oh, thank you, I will.
Good? That's good.
Okay.
So I'm going to untar Elasticsearch, and then Elasticsearch requires Java 7 update.
Sorry.
Could you clear the screen? We can't see the bottom line of the terminal.
Okay.
You can start at the top. That would be great. Just gotta clear it. Oh, that works too. Perfect.
Okay.
So even when it's at the bottom there, you can see it?
Click software and then toolbar.
Yep. Okay.
You can see it. Thank you.
And so Elasticsearch depends on Java 7 update 51, I believe, or Java 8.
Let's see.
I'm running Java 7.71, so I'm good. And we can run bin/elasticsearch to get it running.
So I just want to comment, Brian, when you pull up Kibana, head back to that— sorry, head back to that window real quick, just for everyone who's watching. That's it. Elasticsearch is now running. It's ready to accept data. Even better is we're not going to walk too much through like multi-cluster configuration and multi-node configuration, but if you had changed about 2 lines on within the config file, you could have done the exact same startup and it would have automatically started joining a cluster, becoming either a data or a search node in the cluster, and start replicating data immediately as soon as it's discovered inside of there. So they've also built in auto-discovery. As well inside the tool. So if you're throwing a bunch of different, you know, if you have a massive cluster, you're bringing a bunch together, it's spinning up another instance is very fast. Sorry, Brian, go ahead.
Yeah, so I'll just do a query for localhost. So you can see that's running right here. And then for Kibana. Well, I'm sorry, that Kibana can run wrapped around Apache or Nginx, but you can also install it as a plugin for Elasticsearch, which is kind of nice. They're around that way, so we'll just make directory Elasticsearch. So that, that's how you would install Kibana as a plugin. And again, go back and run Elasticsearch. Sorry, I can't hear that.
Is the underscore important in the file name?
Yeah, the underscore, that's the format that they use. So all the Kibana files are then in this _site folder so it knows to serve it up. So we go to localhost. And now we're running Kibana as a plugin.
So then I think— I wasn't timing it, I wasn't timing it, Brian, but I think that might have been about 4 minutes.
I was going for the record. And all right, so now we need some data in here. We're gonna go ahead and use Bro, put some Bro logs in here. Yes. So I'm gonna pull down Bro just to show you guys how to integrate it with Elasticsearch. I'm actually not going to do a full compile because it takes quite a while. I have one pre-cooked, if you will. So Unzip Bro, cd into it, and then I'll just run a configure so that you see what we're looking for whenever we're compiling Bro is this Elasticsearch support. So right now it's false. The library that's required to use Bro with Elasticsearch is libcurl, and the library for that in the apt packages is curl.
Thank you.
Okay, so now we'll reconfigure. Alright, so now we got true here for Elasticsearch. We're good to go. We can go ahead and make, make install. I'm going to step back out of here because I'm just running this on a VM, and it'll take the rest of the presentation to compile it.
So the—
by default, it lands in /usr/local/bro. Go in there and then do an fgrep for elastic and everything. So these are the configuration files for Bro that have the pattern Elasticsearch in them. We can check out— so here, let me grab this up. Bro IDS Elasticsearch. First result for this is, is the Bro documentation. On how to integrate it with Elasticsearch, and it'll have exactly the same thing I just went over right here. And then we're going to load this to our Bro— Bro.local right here. So I already have it added in. Let's just go there and then And then we also have— here's the tuning policy. Actually, this would be our configuration right here. So this is the elasticsearch.bro file, and you can change your cluster name. By default, all this stuff works out of the box. We're running localhost:9200. Everything looks good. If you want to tune it to your instance, you go right ahead.
Yeah, so hey Brian, let me just jump in.
Okay.
So to talk a little bit about kind of how the ELK Stack comes together, there's a couple of different ways obviously that you could get Bro logs into Elasticsearch if you wanted to. You could run Bro and then output to a typical directory var/log or or the local, wherever you wanted to, and have Logstash monitor that directory if you wanted. And then Logstash would capture the logs and push them up, or you could have Bro automatically output to ES and just specify the IPs and ports and everything on your local instance. So if you've got Bro nodes deployed, you know, all over an enterprise or whatever it may be, there's a couple different options to get that data up to ES.
Okay, so I'm gonna go ahead and run Bro on this malware traffic analysis packet capture, and we're going to send the data to Elasticsearch. So I'm gonna cat my Bro commands I have here. So we're gonna run /usr/local/bin/bro and then take in that pcap and And then this is the tuning policy that we want to load to run lossless Elasticsearch. And then I also add this one just for fun. We want our, uh, the files MD5 and SHA-1 so we can have that data. So let me go ahead and run that. I got those warnings before, but then I go to Kibana right away. We can see we got data in here. Yeah, all of our Bro data in here in a Bro index, and we can even check back here, curl localhost Sorry, sorry for the big block of text here. So there's the Bro meta index, and then so this is how the Bro index will come in from the from the packet capture, gets the, gets a datetime, names it like that. So now that we have some Bro data in there, we're also going to add some Suricata data, and for that we go ahead and get to Suricata website. And for this, so whenever— if you have Ubuntu and you just do an install of Suricata from the aptitude package manager, you're going to get an older, outdated version, and it will not have support for what we're trying to do next, is have JSON output for Suricata. So I recommend you go ahead to their website grab this 2.0.7 will work. That's what I'm running. You can compile it yourself or grab this Ubuntu PPA, which is a lot easier with the precompiled. It has the JSON support built into it. So you just grab that, install that PPA, and then you can get running with Suricata. So you say Suricata, and you can see My build info, this is what we're looking for, this libjanssen support. So as long as that says yes, you're good to go. And then to get Certkata working with Elasticsearch, we want this Eve JSON format, and here it gives you a little example of it. And then you need to modify your SuraConic configuration file to enable EVE-Log. So I keep that in. I guess—
wait, here we go.
Here's my config. I have EVE-Log turned on, so we can go ahead and run this.
Okay, so I—
oh man, I'll put output from Bro, and then here's, here's my output from Suricata. And here we'll take a look at the, uh, eve.json. And this is going to be very easy to throw this into Elasticsearch. That's what we're going to do just a little bit. So there's, there's all the information from— and you, you can customize this in the configuration, the files logged, HTTP log, whatever you're looking for. So now the push to something Elasticsearch, we have— there's the upload JSON. So this is a little script that— really simple Ruby script that Matt passed on to me, and all I needed to do was change this. So now it becomes my script. Matt, what would we call this index? It was like NSM sample.
Exercise, and it's an exercise. So let me, let me give a quick cop-out here too while you pull this together. So first and foremost, the data inside of ES in Elasticsearch, it sits in JSON already. So this is really easy. The reason we did it— you can actually do a bulk API.
You're coming in and out again.
Okay, you're good. Is this any better?
Yeah, that's good. Cool.
Okay, I was gonna say, um, the data in Elasticsearch sits in JSON anyways, so having data in JSON to push up is really fast and really easy. There's a couple ways. This quick script, I think we wrote it to see if we had any errors in lines, which is why it handles the file line by line. But you can also just do a bulk. There's no error handling. I took that part out but just left in the line parsing. But there is a way with Elasticsearch, you can also do a RESTful HTTP bulk push as well. It's basically a massive curl PUT command and/or POST command, and you can push it up that way as well. And then you can also use Logstash. So just to kind of COVID the breadth of how to get this data back into Elasticsearch, there's multiple avenues, but this one works just fine.
So we'll go ahead and run that Ruby. Just run it like this. We'll go back to our Kibana. Okay, so now we have the Suricata log type and all of our data. Isn't here. Okay, so Matt is going to take over from here. He's going to touch a little bit on the mapping, the index mapping, and some of the network security monitoring, forensics, and our investigation example that we're going to do. Go ahead and share out, Matt.
Hey Brian, can you see what I'm sharing?
Yeah, yeah, I'm seeing come on on Chrome.
Okay, cool. I don't know if someone who just joined has got a lot of background noise going on. But all right, so let's, um, let's back up real quick and let's take a look at our mapping that's in here. So one of the interesting things that Brian talked about was getting, you know, getting Bro and Suricata data in Elasticsearch together. Well, obviously if you've looked at either of these logs before you know that they're not the same type of log. They don't have the same fields, they don't have the same length, the timestamps aren't even correct either, or they're not, sorry, the same. Suricata is actually down to, I think, a millisecond, whereas Bro is actually an epoch time. So one of the, one of the things that we'll do ahead to kind of prep our index, instead of just pushing data up to Elasticsearch, we'll actually define our mapping ahead of time. Now note there's two different types of fields in here. I've got— let me actually collapse everything. We've got a Bro file and Suricata log. So let me give a blank— let me give a blanket assumption. Yep.
Yeah, hang on a sec. How's that? Any better?
It's better.
Thank you.
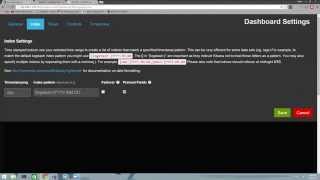
Alright, so when, when building up the mapping for these two, again, they're going to be a little bit different, but we can prioritize this in a way that our index is going to be a lot smaller if need be. It's going to handle numbers differently. It's going to handle IPs differently. It's going to give us a lot of better way to handle our data. So again, we're doing historical pcap analysis, but there's no reason you couldn't stream live files if you wanted to. But for the sake of this exercise, we're looking at the pcap analysis exercise. From malware traffic analysis. And you can see I've got the Bro file log. Spoiler alert, I know there's some malware in this pcap, so I want to take a look at the file information. Everything here is just input as a string except for our timestamp. Now note, I did this on purpose to show the difference between the two, but this takes all of the different fields from our Bro log and pushes them up as strings. If we take a look at an optimized index, which is our Suricata logs, now we've got things broken out a little bit better into string, long. We've defined some— an analyzer for our signature field, and I'll get into just in a couple minutes what this means. We're handling our IPs a little bit differently, and we've actually got nested JSON documents inside of here, which is really good. So for HTTP, we're looking at hostname, method, referrer, user agent, so on and so forth. So nesting the JSON lets us handle it a little bit, lets us work with it a little bit more efficiently. And then I think also one of the most important concepts about when pushing data up is that you have to tell a visual front end what field is my timestamp. So you want to make sure your timestamps line up from source to source. So if anyone can think of Bro logs off the top of their head, the timestamp for Bro is actually just TS. For the sake of this, I've changed it on the upload to timestamp, and that's an easy configuration tweak. But I've changed that to timestamp, and then for Suricata log, we also have timestamp as well. So regardless of all the other fields that are there, we are going to be doing, you know, luckily our times are going to line up. So in attempts to mimic the index that Brian was building, Let's take a look at early Kibana. Can anyone let me know, is this good size?
Maybe a little bigger.
A little bigger. Alright. How's that?
Yeah, it's good.
Cool. Alright. So what we're going to do now, by default, Kibana is going to look for indexes that stem from Logstash. But by no means is that a handicap. So what we're gonna do is actually tweak this to take a look at our NFM exercise index. We can actually— anything in brackets is static, anything— and then we can also display date values. So we can store this in multiple different ways. Our time picker, we're gonna take out the stamp, the symbol. So our time field is actually gonna be timestamp. And we'll keep it dark just because that's fun. Let's go ahead and refresh our page based on our settings. Now, this is your basic Komada dashboard. It looks very boring without any data inside, but luckily we can use our time picker here, and we're gonna go back 30 days. Notice our histogram here is actually thinking. It's thinking because I've got to give this one the right field as well. So we're gonna change the field inside of our time picker to actually be timestamp instead of @timestamp.
Perfect.
Okay, so now we're starting to see the Logstash format for metadata. Yep, yeah, exactly. If you push data up via Logstash, it's going to be— it's going to be pushed— the date is going to be pushed up as @timestamp. So what we're going to do instead is customize this dashboard. Okay, so we know the PCAP was from March 9th, 2015. Our graph shows this, and the beauty of kind of being at this state now is we've got Suricata logs and we've got Bro file logs inside of our— inside of the Elasticsearch. We're now going to play around with our data. So without really digging into a log, we're going to investigate and see what happened during the course of this PCAP, right? We're interested in how this played apart. So Just to get an overview of what's here, we've got a basic query box. We've got our filters for these. These are going to apply to the entire page. We've got a histogram showing our events over time. Obviously, all of our activity is going to center on March 9th. Now, if we wanted to just focus on that day, we could handle this a couple different ways. We could come up here and change our date to just be March 9th. Let's actually do the 9th through the 10th, so that way we get a full 24 hours. And now you see we've got a full 24 hours and our activity— the graph is centered a little bit, but we're looking at just a day of activity. Actually might have a little bit more. Okay, I go to 6 PM on the 10th there. We can adjust that, or we can just drag and click inside the graph here. All right, so we're getting a little bit closer to our activity. Now remember, this is a PCAP, so we're looking at a lot of activity. We have a lot happening in a little All right, perfect. So just looking at our traffic analysis here, I can see that for the first— I don't want to say 4 minutes of this PCAP— we have— I don't want to say average, but kind of ups and downs with regards to activity. And then the last 45 seconds absolutely— 30 seconds absolutely explodes with activity. So in kind of examining what's going on with this, we can get an idea that something happened prior to this time time, which started throwing all of this up. Seeing as we're in Kibana, let's go ahead and drop in some filters and see how much is Bro and how much of this is Elasticsearch— oh, sorry, how much is Suricata. I can remember what my, uh, what my type is here. Okay, perfect. So we've got 834 events that are Suricata log type. We can go ahead and color this. We'll color it red. Let's call it Suricata activity. We'll pin this in there and we'll drop a new search in. And what we're gonna have now is we're gonna start to see some some red in here as well.
Perfect.
So our graph is now updated. The yellow is everything and the red is what is Surakata. So we're gonna have some overlap there. So let's try a different type now. I think it's profiles. I'm not sure why that one's not coming through, but we'll hang tight because I know that we're gonna run into the data anyways. So we've got an aggregate going here, Suricata versus overall activity. As you can expect, we start to see a little bit of Suricata dotted in and out. We can hover over any of these periods of time and they're going to give us back some statistics that we see there. So 10 events per second with Suricata versus 21 aggregate. We get here, we're looking at the 182 events of Suricata versus 367 aggregate. So we can start to profile what's in there. Now the other thing I know from Suricata is that we've got an alert trigger as well. So we can look at this a couple different ways. We can hit focus on our alert signature, which is going to show us a list of the alerts that are within the current view that we're looking at, or we can actually drop in a graph and profile these. So again, because it's a fully customizable AngularJS, we're going to move our histogram over a little bit, and I apologize, the resolution is probably going to throw this off. That's okay. What we're going to do is add in a terms panel, and we're going to call this alerts. Our field is actually going to be alert.signature. So I won't go through all the fields, but we basically want to display a pie graph because pie graphs are cool and fun of all of the alerts that we're seeing throughout this, throughout the traffic right now. All right, so this pie graph is completely thrown off by the resolution and looks actually quite ugly. So what I'm going to do instead is actually just change it to a table, and it should give us our top 10 alerts that we're seeing. Okay, I'm going to zoom back out just for the sake of showing it, and then I'll zoom back in for the demo. But you can see what we've done now is now we generate an alert table of what types of alerts are we seeing inside of our traffic. We can look at it another way as well. We can come back down here to alert signature and say, hey Elasticsearch or Kibana, show me only events with alerts in them. We can hone in on this little magnifying glass here. So now we've got 58 events, 58 Suricata and 58 aggregate, which means we're one for one. So that's, that's a good thing. We're now looking at all Suricata events and all of the alerts that came through. And then this table down here is also dynamic, so we can actually start to build this out as well. So I want to look at timestamp, let's take a look at source IP, destination IP, and then I'm going to look at alert signature as well. The table is dynamic and it's sortable, so we can actually sort by time. So now I'm starting at 4:54, the, the very beginning of this pcap, and it looks like we have a nuclear exploit kit landing. This is using the emerging threat library for Suricata, but chronologically we can start to see exactly where our what exploit hit us first, right? And if we just scroll down through alerts, we've got Nuclear. It looks like there's a— it looks like it's tried, or we've tripped alerts on Flash, on an outdated IE, on Silverlight. We get down to double server headers, and then boom, we've got a Keyleah host infection, and we've got a Symdus-C check-in. So I like seeing check-in events. So it's starting to— we're starting to get C2 communication. And if we keep scrolling down, the alerts just continue, continue, continue. So immediately within our PCAP, we sorted by time and we found a nice little starting point. Let's, um, let's blow back all of the alerts because we now know what we're looking for. We know our first alert was a nuclear exploit kit, and then if we blow that back, it's going to affect all of our other elements. So we can search by time and boom, we can get back to our, our nuclear exploit kit, we can now take a look and see what's happened afterwards. So as you would expect, we've got a little bit of traffic kind of in between these events here, and I only know this because of the timestamp-wise, but here's a Bro file log that is sitting in between some of these Suricata events. We've also got a hash associated with it as well, and I'm liking— I like to see file activity when I see alerts dropped in. So again, we have a dynamic table. Let's go ahead and bring in some of the, some of the content that we're seeing here. So HTTP URL we can drop in, and let's see if we also want to bring in— so we're gonna bring in Bro information, we'll bring in our MIME type, and then an MD5 hash. Now this is going to be thrown off the screen because of the resolution that we're looking at, but focusing on the alert signature We can scroll down. Okay, so we have our starting point, we have our Nuclear Export Landing Kit, and then boom, we've got immediately we've got a page request. We've got a referrer, the fortinet.biz, and then the hostname that it's referring to is a .vu. If I'm sitting and examining this Ptrack for suspicious traffic, I'm immediately throwing, throwing an alert up. I'm a little nervous about what I'm seeing. And we've also got a non-human named HTML page as well. So that's just one line after the packet. So we can continue scrolling down, and it looks like we've got a Bro finding here. We've got a hash that we could bump up against a source. We could look through our system, we can compare it against the files that Bro pulls out. And then continuing to scrolling down, we've got a bunch of other obfuscated strings that we're seeing being referred to from our bad domain, and then strings that just come flying out of nowhere.
Obviously, obviously, you see what's delivering as well, and the MIME type.
Yeah, sure.
Yep. Yeah, so right here, let me see. So it's a blank MIME type. What's that, the one above it?
Yeah, that one.
Perfect. Hey, good point. Thank you for pointing that out. I completely skipped over it. You're right. Now take a look at our content type, an application/octet-stream. Being pulled down from this link, which, you know, is going to throw up another flag for me. It's going to put another pin that I need to investigate a little bit further.
Right, so we are seeing nuclear payload events.
Yep, exactly. So let's see if we have one here. Okay, so these are our text HTMLs, and the beauty of all this— and again, if the focus here is to think about Elasticsearch as an analysis tool— if there's something that we want to see, right? Let's go back here. Our HTTP content type, that seems to be a really important field. So let's actually back up. Let's take out MIME type and MD5 because in this resolution they aren't doing much for us. Let's drop in HTTP content type and see if this gives us a little bit more, more direction, if you will, a little bit more context. So again, our first alert drops. We've got multiple HTML files hit. Boom, a whole string of application octet streams interlaced with Bro files in between as well. So another nice way to look at our data. We can continue scrolling down, and again, there are some flags you can throw here, but we've got Bro files throwing some hashes at us which we could look up a little bit further. Continuing down, we've got more obfuscated strings wrapped around with Suricata alerts. So, you know, for a 5-minute setup, a 30-second log push and then maybe a 2-minute dashboard build, we've already started to profile very quickly what's going on inside of this PCAP and what kind of data that we're seeing. Again, interlaced with Bro logs, we're getting information about our files being downloaded, we're getting MD5 hashes to come out of them, we're getting file sizes as well coming out of this data. So it's a long, long, long laundry list of what we can quickly pull out of there. Now again, I understand walking everyone through a PCAP sounds fairly simple, but The other side of it is let's get some quick answers to our data that we're seeing. So for example, let's, let's see, let's go back and take a look. We saw something, we saw a beaconing, if you will, we saw a check-in event. So let's see if we've got any other events for alert signature containing check-in. And I'm going to actually disable this so we get the red out of the way. And it looks like we've got 5 events giving a check-in. 3 CIMDAs and 2 Kilihos. Organized by time, we can see CIMDAs checking in before Kilihos, but immediately we've got, it looks like maybe close to 45 seconds to a minute in between CIMDA, and we've got 22 seconds in between Kilihos checking in. So we can immediately start to profile that type of traffic as well. The beauty of Elasticsearch is again, it stores everything in JSON, so every row that you see actually is an interactive clickable event. So we can scroll down and take a look at this Trojan— sorry, at this Trojan alert from Suricata, and we see a signature ID, we see an IP, ports. So that gives us a little bit more information to look out for. And then again, we know the timeframe that we're looking for, right? So let's use this as another pivot point. Let's take a look at this last check-in event. Let's hone in on that one and let's remove this. So what else was going on around this time? All right, we've got a couple server headers being in there, a few more alerts being thrown. We're seeing a few more IPs. Let's see, and a little bit more. We got some more hashes from Bro coming in there. We've got just, just a lot more data. So without belaboring the point, I think the goal is to just show how easy and quick it is to bring a lot of different types of logs together and And when you overlay them, you can look at a pcap for 5 minutes, and if it's an obvious thing, if the alerts are sticking out, there's a real quick win on identifying kind of what's there, what, you know, what shouldn't be there, or what's sticking out, that kind of stuff. So it's a neat tool, I think, a good way to bring all this to the front.
We have a question in the chat if you got time to address that.
Yeah, sure, definitely. I mean, Jon, this is I'm not sure how hard of a cutoff it is. I've got time if there's any other questions, but sure.
Can you pull up the chat from—
Oh yeah, yeah, I'm sorry.
15 or so minutes left. Don't need to rush or anything.
Okay, yeah, no rush. So D-Web said, why wouldn't you just use SQUEAL? Then you don't have to pivot to 2 to 3 apps. That's a great point. You know, there's lots of other tools, I guess, to visualize this and look at it, to look at this type of data. I think it depends on the infrastructure that you have and also the type of data that you're looking for. So from a kind of historical analysis point of view— and D-Web, if this doesn't answer the question, let me know. From a historical analysis point of view, a single PCAP is not that much data, and there is probably tools to look at it a different way. Some of the implementations I've done with Elasticsearch, which quite frankly would have been too slow, or I couldn't replicate in time for this talk, if you will, are bringing months and months, years and years of historical data together. We're kicking off massive kind of imports of historical logs. And the beauty of— the reason— not the beauty, but the reason why we use Elasticsearch is it indexes everything and it lets us search historically across a lot of data. So again, I guess to reiterate, for the point of this exercise, a single pcap could certainly be examined a bunch of different ways. There's no doubt about it. But I've walked into the door and seen, you know, a terabyte of Bro logs from someone who basically flipped the on switch and then never ever bothered to look at anything. Oh, sorry, I see a follow-up. Yeah, yeah, exactly. I would, I would say that you're right on the money. Real-time event flow, it does that very well as well. I wouldn't want to take away from that. It is able to handle logs real-time, and you can obviously play with them in a different way. But if you're looking to solely kind of hone in on alerts and then go to something else, or then, then there are definitely other tools to do that. I hope that answered it, but if not, let me know.
I just also want to add, I mean, one of the things that we really like about it is the customized— customizability and the performance of it, because like a lot of things that we run into aren't a nice structured PCAP or whatever. We run into a lot of different log types of the clients and stuff like that, and we custom build our tools to that. And then also the performance of, you know, some of the data that we're handed is outrageous. That can, you know, help us.
I think that's a great answer, D-Web, that you just put up there. But let me bring up another point as well. Using Logstash. So this is actually the way Logstash— very simple concept. Input is what's coming in. Filters are what am I doing with it, and output is where you're going to push it. So the input and file filter output is a pretty powerful combination, but the codecs also allow us to handle different types of data as well. You can actually take historical NetFlow and throw it at Logstash, and it eats it like it's no problem and then brings it up into Elasticsearch for you. So there's more than just PCAPs. I think there's, there's multiple different ways to handle a lot of different types of data. And again, if it is sitting in something like, you know, if it's just a plain text file or you've got, you know, gigs and gigs and gigs of logs that no one's ever looked at before, here's a quick and fast way to start to get a handle on that. I guess with that though, group, that's, you know, that brings us to time. So I'm not gonna rush.
I could talk all day, but I understand if anyone incentive to that.
But, you know, this was just a real quick kind of walkthrough of a single PCAP historical analysis with Elasticsearch and Kibana. There's a lot more avenues we could take this down. We'd love to explore some of those other options. If anyone has any other questions they want to bring up in the chat or whatever, feel free to let us know. But with that, you know, on behalf of Brian and myself, Jon, thanks a lot. I appreciate you having us on here. I wish we had a day or two to kind of go over, you know, handling those gigs and terabytes of logs and everything like that.
I have a question. Do you know what other types of data you can actually import into Elasticsearch without using JSON or using Logstash to pick up files in the directory? Is there any way? Things that are being used for importing data?
Sorry, repeat that one more time. I'm sorry, it got a little muffled on the end. Or Brian, if you can answer it.
Yeah, I'm just curious about more supported ways of importing data into Elasticsearch.
Oh, yeah, yeah.
You know, besides the JSON or—
Yeah.
Yep, so— Really, if you can, if you can, if you can— so there's APIs for Ruby, for Python, for .NET, for Java, for— I mean, you name it, there's APIs out there. There's also rivers that can hook into other data sources as well. Quite frankly, if you can parse it and get it into some form of text, you can push it up into Elasticsearch. We've actually had some instances too where we've taken just some for super dirty log formats with very inconsistent field types and written kind of— intelligence, the wrong word— but scripts with a lot of if statements inside of them that can structure themselves based on that. And then we build it, we built the JSON by hand as well. So if you can get it into like a string or a text format with a script or an API— or sorry, with a script— then you can push it up. There's APIs all over the place.
Okay, cool.
Oh, by the way, so if anybody is remote and they would like to ask a question, you guys can unmute yourself and you can ask the question and then mute yourself again. Do we have any questions from those that are remote? So whenever you deploy these, Matt and Brian, do you typically do these in a single instance where you have, like, I don't know, I don't know what the core of this measurement is, but between hundreds of thousands or millions of events where you would probably want to use a cluster?
Yeah, so I'll take this one first, Brian. I've personally I personally put out— I want to think, I'm thinking right now, this is going to sound horrible to everyone on this call, but I've been in an environment where there were 87 ingress/egress points. I know, it was a nightmare. But so I've deployed an 87-node monitoring cluster where we had 87 instances of Logstash running, and from Logstash running, we were pushing up to like a 5-cluster or a 5-node Elasticsearch cluster. So it was a pretty, pretty big one. This is— we were talking about a lot of traffic coming through. We had, we had Bro running on all of them, so we were bringing in Bro logs and basically with Kibana getting an enterprise snapshot of traffic at that point in time. And I think this was, this was the last development stage I remember. I think we had about 10 instances of Snort deployed. As well based on where they were sitting relative to the company. And we were actually bringing in the Snort logs as well. So we were again overlaying everything. That was a massive cluster. That was— you could— Kibana actually has an auto-refresh on it. You could set the auto-refresh and the screen would never stop scrolling. Brian, you got any war stories for us?
Any questions?
No, not anything that compares to that, man. Yeah, just that one whenever trying to— what was your record of putting in a million lines?
Yeah, that's the other thing too, is we, for like massive scaled historical analysis, it works out really well. So we've used— I've used the S as well to take a look. Like I said, I've walked into a place before where there's a terabyte of logs just hanging out and someone's like, yeah, I have no way of looking at those, or As usual, Insert Commercial SIM Here was not configured correctly, so it's not looking up, you know, it's not looking at logs the way they want it to look. But in any event, I walked into some instances and pushed up, you know, you write a script that recurses through and pushes up, and you can push about a million rows, for lack of a better term. I've got about a million rows in 40 seconds, so it just chomps through data very, very fast. Oh nice, all right, we just got a cool, we just got another question in. Do we have time, Jon, to keep answering questions?
Oh yeah, go ahead.
Cool, all right. Have we done translations in Logstash with threat feed data? Yes, so kind of another hidden feature, and again, I apologize if it looks like we should have showed more. But there's definitely, there's a lot that can be done with Logstash where you can actually drop in dictionaries, if you will. Okay, boom, Meh iPhone, who is contributing to this as I'm talking, is, you can drop in dictionaries on Logstash, which are basically lookups. So that's one way to do things. I guess enriching data in Elasticsearch is another really cool feature as well. I've used Logstash dictionaries where you can— I've actually, you know what, if you want, I can show you some Bro Logstash dictionaries which work out pretty well. So like the Bro conn.log, for example, here. Zoom in. So the Bro— so if anyone looked at Bro logs, you know that the— let me see, I'm trying to remember what event this is, but something in the Bro conn.log actually has connection statistics. So with Logstash, if you wanted to grab a little bit more data, or if you didn't have these memorized, you could build out a dictionary, a translate dictionary, and tell Logstash that when it's importing your data, give me this information as well. So tell me that an S0 is connection attempt seen, no reply. Tell me that a, you know, an SH is originator sent a SYN followed by a FIN, but we never saw SYN-ACK, so on and so forth. The dictionaries really, really, really help you build out some more power. The other thing you can do as well is you can enrich your data on the ingest as well. I'm going to use enrich kind of very lightly, but Jon, you were asking earlier about some APIs and some scripts and everything. If you'd imagine what you can do with a script and an API at any point with any piece of data. You can do the same and then push it up to Elasticsearch. So one of the, one of the things that I've done before, and again, this was more of a proof of concept, it was by no means a network security monitoring methodology, and I would not recommend this to anyone as a flag, if you will, but every time a Bro file log dumped a hash, we bumped the hash up against VirusTotal and malware and all that kind of stuff and get back to see if any data, like, did we have any super low-hanging fruit? In front of us. Did we have anything that just, you know, threw off the Richter scale of AV alerts and that kind of stuff? So there's a, there's a couple ways to take a little piece of data and not just look at it in a visual form, if you will, but also, you know, use my API script and bump it up against a few bunch of, bunch of different sources and then throw all that into Elasticsearch. And then instead of filtering on, you know, instead of filtering on alert signatures, For example, filter on, hey, show me everything in VirusTotal from the, you know, with a successful hit in the past 5 minutes. So a bunch of different ways to interpret and look at your data as well.
Great.
Do we have any more questions before we head out here? Okay, well, I want to thank, uh, Ryan and Matt for donating their time to talk about today. I think it was a really cool Well, definitely the immediate visualization. So I'm sure we'll have a lab up and running. We'll actually, you know, have a chance to experiment and get some practical hands-on experience. So thank you guys for coming, and we're a little over time, but we're gonna go ahead and conclude. Next week we will have, I believe, Justin Asoff will be talking about his StatSpeed and Bro integration. With the E+ TV in your phone. So I do look forward to that, and this video will be, uh, available online, YouTube and Vimeo. Uh, take care everybody and have a good night. Thank you.
Thanks, guys.
Thanks, everyone.
More from Jon


What No One Knows the Podcast / Vodcast featuring The Tampa Bay Wave and Jon Schipp

Meeting the Exposure Management Challenge: Key Use Cases for Success | @OfficialRapid7 #SolutionSpotlight

Spot Security Control Gaps and Non-Compliant Resources Across Your Attack Surface






