OpenNSM (Graphing Bro Metrics, BHR, Ninfo - Justin Azoff)
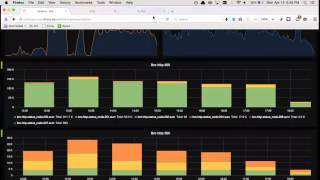
Justin Azoff demonstrated three security tools: a metrics pipeline for Zeek using StatsD and Grafana to visualize network events, the Black Hole Router for automated IP blocking via REST API, and ninfo, a plugin framework that queries GeoIP, Shodan, WHOIS, and passive DNS in parallel.
Chapters
Screen sharing.
All right, it's that time again for the Open Network Security Monitoring Group at the University of Illinois at Urbana-Champaign. Let's move along right into the group update section. So we do have a sponsorship document out. I've mentioned it a few times, we're always interested in seeing the projects that we have planned. And the sponsorship details if you'd like to, you know, provide funding for us. You can take a look at the benefits they'll get you and what they'll get us. So please do check out that document. Also, on Saturday I started a GoFundMe campaign, and it's actually doing very well within the 2 days that it's been up. Quickly go over here. Take a look here, we've made over $1,000 and it continues to go. Today I think we made $225, so hopefully it'll continue to rise. And largely a part of all the number of people that are sharing it, and especially Richard Baitlich, I wanna give a big thanks to him. He has like 30,000 followers and is a big name in the NSM community, and he seemed to endorse what we're doing. So that was very nice of him, I appreciate it, Richard. Moving along, so there was the UIUC Capture the Flag competition held by another SIG group called SIGPONY, and they do have an analysis page up. So if you'd like to find the information, the results and scoring and some details about the challenges, do visit that link. And we—
before you move— sure, go ahead, Jon. Before you move on from that, I have been handed the reins for the UIUC TF for next year. And so I will be looking for contributors, vendors to donate, sponsors, and challenges. Anyone interested can get a hold of me. Yeah, I'm going to pass to you. Great. I think that's about it. Cool.
Thank you, Shane.
I would like to see this group get a little bit more involved in it. So it might not just— That's fair.
Right, right.
SigPony, WUB, UIU, you know, NSM, yeah, maybe even ICSSP.
Yeah, maybe we can do a, like, one of the times when it gets closer to actually set up a meeting just for that, and we can actually all work on creating challenges together.
I plan on setting up meetings starting maybe next month, once a month, and then more frequently as we get closer. I think we're shooting for trying to co-locate with Hack Illinois in February, so that's kind of like have a big event. Awesome.
And finally, in the group updates section, we have a sponsorship. So Gerald from Blue Flag Security actually donated $250, so that was very kind of him, and he'll—
come on in. Hey, Jon.
Yeah, he donated $250, so big thanks, a big shout out to him. Also, we're gonna move right on into the meeting sections. So, NSM in the news. Shane added this one, the RSA Security Conference bans booth babes. I don't know if there's any more to add to that.
Not too much, there's a link if you want specifics, but.
So at the time that we were doing this, we couldn't really, there wasn't a whole lot of NSM news, at least that we didn't see, so. We started to add some more offensive and other items that aren't particularly pertinent to the group, but we got them in there to have some coverage. So thank you for—
I just wonder, like, yeah, I can see a few positives for banning Booth Babes. But if you're the kind of security professional that gets influenced by Booth Babes, do I really want you running my organization from a security perspective?
I don't know if— well, sometimes— well, I'm actually not going to say anything on the air right now. But— But yes, I agree.
That's, that's probably the fact that they had them to begin with is just like, oh my God, people made purchasing decisions.
That is true.
That is true.
Right. It's probably— yeah, that's kind of sad for something that— right, right.
Well, uh, we're going to the next item here. Uh, new BlackArch distribution released in ISO. I'm not familiar with BlackArch. What is that? Is that like a Kali alternative?
Yeah, it's similar to Kali. It's Arch-based.
Okay, Arch Linux-based.
With a large number of penetration testing tools pre-installed. Cool. Maybe it's a little bit smaller footprint than Kali.
Also, there was a hidden backdoor found with using an API in OS X that allows you to become root or have root privileges. And this was basically, it was a local vulnerability, so you can't do it remotely. However, you might be able to take advantage of it if you could find a vulnerability remotely. And then use that to escalate further. So do check that out, there's a good blog post on that. And it has to do with the System Admin API, which uses XPC for communication. Also, the Beebone, an elusive botnet, was recently taken down with FBI from the US and some European organizations. So if you're interested in that, do check out that link. Also found out, or came across this there's a redirect to SMB vulnerability that was talked about quite a while ago by, I think it was discovered by CMU, Carnegie Mellon. And what it allows you to do is redirect from a URL to SMB. And then the problem here is the SMB tries to authenticate if you redirect it. And they give you an example here using a GET request. A user just went to a website or something, or in this case, a HTTPS website, but the result was that it gave a 302 redirect and the location of the redirect was set to file. So then it would actually try to authenticate this and you could use this to harvest credentials or other types of attacks you can use to gather the data. So if you're affected, Internet Explorer is the one that was listed as the— what's affected, any application that may use that. So, and there's those listed and I guess one of the impact is using malicious ads that could be crafted that would force authentication attempts from IE users. So that was interesting. And going, skipping beyond, Joss Labardi had a little gist up on, he posted on Twitter, you can go to using Bro to basically using the HTTP header event handler and then actually check for that location that if that's there and then look for the file, use a regular expression to match for that file string and then if it's there then that means someone's probably using that and then of course you can do whatever else you want whether you want to generate a notice or not. That was a little proof of concept you could use for detection. Going into conference corner, got quite a few of them here. Let's focus on the ones that are near us. Hot Sauce is a symposium boot camp on the science of security. So if you work in scientific computing and you have an interest in security related to that, then do check out this conference. It is held at the NCSA. Shane's going, I believe. ThoughtCon is in Chicago, so it's 2 hours north of us. And BSIDE Chicago is also having their conference around that same weekend, as well as Hamvention, which I'll be attending. Then I guess that, yeah, then AIDE 2015, that'll be in West Virginia at Marshall University. It's the Appalachian Institute for Digital Evidence Conference, which is just a forensic conference. They also have an InfoSec track, and Waylon and I will be there. We'll be speaking on the tool called Pilot. And then BroCon will be at MIT later this year. Also, we have an opportunity So if you're looking for a job and you want to play with Bro, you can follow that link. So LBNL, the Lawrence Berkeley National Labs, and with the NURSE group, is actually seeking someone to be on via security analyst.
We get to play with Bro.
So you can see that I believe Bro is in the job description.
So Bro, I expect so, yes. They've pretty much been using Bro before Bro is a thing.
Yeah, I believe so. Is Ashish over in that group?
Do you know?
Yeah, I think Ashish is over there. Yeah, I know he does a lot of cool stuff.
So, John, I added another opportunity outpost if you might need to refresh.
Oh, thank you. Yes, I forgot to do that. Okay, and then, oh yes, SANS is— oh, you can speak on that, Shane.
What's that?
Did you want to talk about— I don't know what else it is besides the talent.
I mean, it's pretty self-explanatory. There's a link there. That's a registration for the event. I think it's an online cyber talent fair. A bunch of different companies sponsored by SANS. Okay, cool.
Well, do check that out if you're interested. Tool Tray. And Shane, these are both yours. Pop one open here. So NSEC3map is a tool to enumerate three— or, excuse me, to enumerate the resource records of a DNS zone using DNSSEC. The scanning of our enumeration of DNSSEC records.
Cool.
So look at the output here. I'll move on to the next one. So this is a newer tool, maybe of interest with you if you do some DNS enumeration. Also have a tool called Sparta. Shane added this one as well.
And are you blaming me?
No, no, no.
I'm just—
if you want to chime in, I figured you reviewed—
no, like, I put the notes on there because 'cause I didn't know where else to put them, but now they're gone, so.
No, I'm not blaming you. I'm just trying to get your attention if you wanna talk about them.
No, no, that's fine, yeah.
So SPARTA's a—
I found from the mailing list, but go ahead. Okay, cool.
Yeah, so SPARTA's a Python GUI application, which I guess you can read it, simplifies network infrastructure penetration testing by aiding the penetration tester in the scanning enumeration phase. All right, so it's just a penetration testing tool. Okay, it looks like it can run Nmap, Nikto, Hydra, okay. So that's a way to quickly run these tools, it seems, from a GUI. I'm thinking that's my takeaway right now. So if you're interested in that, do check it out. Paper period. So not necessarily a paper, but I did get an article published in 2600, the Hacker Quarterly, and it was released today. So if you're at your local Barnes Noble or Books-A-Million probably, on a tool called Eyelet that I developed, which is relevant for NSM 'cause Eyelet is being used mostly, as far as I know, to do NSM and DFIR-based training with tools like Volatility and Sleuth Kit, Bro, et cetera. So if you wanted to do that in your organization, provide some sort of training, check out my tool Eyelet, which makes it really easy to provide training environments to users. And then at this point, we're gonna turn it over to Justin Azoff. Justin Azoff is a security engineer at the NCSA. He's on the security operations team, and he's also a developer for the Bro project. He's been working a lot with basically reworking with reworking Bro control, making it a lot better with Daniel Thayer. And he, he's done a lot of really interesting stuff with integration tools with Bro, and a number of them are including passive DNS, dumbnode, and the Blackhole router site. So he'll be talking about a few of these today, but his main focus is on graphing data with Bro.
All right. So I have an idea.
So we'll go ahead and I'm gonna stop the sharing and you just click screen share.
Share screen. Share screen only. All right. So what I'm gonna be talking about is how to build something like this. Nice, very efficient dashboards for graphing Bro logs. So it's not something that hasn't been able to be done already using things like Splunk or Elasticsearch. The difference is by graphing the metrics directly, you can do a lot more with a lot less resources. So instead of needing hundreds of gigabytes of storage to store all the logs and crunch the numbers, you log the metrics on the fly and So like the data to provide all these dashboards going back a month or two is only about a gigabyte compared to the raw logs, which are dozens of gigabytes. So how does all this work? So the first component that enabled this to work is Bro started supporting plugins a while ago. So I wrote this plugin that's on GitHub called the Bro Statsd plugin. Which when it comes down to it, I can fit this, is that is the entire thing, minus all the boilerplate that there's a script that generates and not counting generate or connecting to the socket the first time, the entire plugin really amounts to two lines of C. So what you do is, or what this enables you to do is it just exports a single function called statsd_increment a string and a count. The StatsD API, which I'll get to in a minute, supports a couple other things, but increments are the main thing that you want for doing the kind of metrics with Bro. So given this function called StatsD increment, I can pop over to here and— not that one, this one. I will use statsd test. This was the first script I wrote. So what it lets you do then is take a standard Bro event, connection established, and then call statsd increment Bro connection established 1. And then you do the same thing, connection rejected, and then you call statsd increment Bro connection rejected 1. And what that ends up after it makes its way through the stats daemon into the metrics storage is that provides this graph right at the top. So that couple of lines of code provides a connection rejected metric and a connection established metric, which you can now graph on a dashboard, zoom into it, and do a lot of very neat things without storing gigabytes and gigabytes of connection log entries. You're basically just storing, you know, the actual metrics. Easy. My spikes, and it's the software that drives this is very responsive because it's— it just doesn't have to work over the raw data, it works over the metrics. So I covered how the Bro thing works. This is where it ends up. The other component is how you actually get it to go there, and that's by just running a very simple tool called StatsDaemon, which I have it starting up. That's nice. Oh, I broke that. Ignore that one. So StatsD is something that I think Flickr initially came up with it, and then Etsy helped popularize it. It's just a very simple daemon that listens on a UDP port and collects those individual increments. And then what it'll do is it will bubble up all those increments on, say, a 10-second interval. So what that's doing here is you end up with the metric, the counter, and then the timestamp. So Bro is potentially outputting, you know, thousands and thousands of increments a second, but what you don't want to do is send thousands of thousands of increments a second to your metric storage. So this tiny little daemon will just aggregate those and and every 10 seconds send what the total count was to your actual metric store. So you can see here we had, you know, 21 SSL session ticket handshakes. Instead of sending 21 updates to the metric store, we sent one update saying it was 21. Can I get that going again? Yes. All right. And it's a very lightweight daemon. Essentially, you just run one on each of the Bro boxes that'll be doing increments. And you point it, and in our case, an InfluxDB server that's also running Graphite. And in about, you know, 10 minutes of work, you can get this really nice infrastructure going. So let me quickly show— I have this pre-canned dashboard that I put together. Didn't— didn't take very long at all. Still online here? Okay. So you might wonder, so you send the data into the system, how hard is it to actually generate a graph? So what I'll do is just change this to an hour. So to add a new graph, shows the power of the system. You add a row, you add a panel, you add a graph. Edit it, and I have a metric series. See, it autocompletes. I have a lot of metric series. One that I want to graph is I am sending— I think the autocomplete is NX domains. Every time Bro sees an NX domain, it increments the counter. All you need to do is then say—
here's a nonexistent domain.
Yeah, nonexistent domains. Which sometimes you'll see a spike in that can indicate a problem. Say you want to bubble up every 60 seconds, and that's it. I'm done.
So would you be using this for an analysis tool to find anomalies, or—
Find anomalies, just keep an eye on things. It's a really nice kind of thing if you have a flat-screen TV in your office on the wall. Talking about possibly throwing out the graphs and just cycling through a couple of alternatives.
So what's the advantage of doing this sort of thing in Grafana as opposed to Swarm?
So the main difference is, like I briefly mentioned, all the data for this that I've been collecting for a month or so at 10-second intervals is a little over a gigabyte. So the amount of resources that you need to store this data for months or years is going to be a lot lower than Splunk.
Then put the index counts.
Exactly. Yeah, you increase your brightness too.
I think that may be why it looks so dark, unless it's just the, uh, nope, even though it's, it's a dark theme, which probably doesn't help.
Um, there is a downside in that when you might see something like a spike, there's no easy way to drill down and find out what caused it because it just simply doesn't have that data. It just has the aggregate metric data that says Hey, there was a spike. Like a good example, you were having some issues with large connection log entries. And looking at these graphs, we found a couple of cases where, you know, the baseline graph was just stuck on the bottom, and then there'd be a spike up to like 40 million. Which can be frustrating because you can see that there was a problem and the system doesn't slow down just because there was a problem. But yeah, so something like this where our, you know, base level of traffic and then all of a sudden you get 130,000 connections established in a very short time interval. And, you know, you can zoom in, but you can't find out what caused that. But it's really the trade-off for only having all of this data take up about a gigabyte. So, oh, so also why don't I show— so that NXDOMAIN thing, you might be wondering, you know, how hard is it to just graph something? NXDOMAIN group. That is the entire script. Two lines of code. So I guess three. So you need to handle the DNS event, figure out if it's an NX domain, increment a counter. So from deploying this and pushing it out to the Bro cluster and being able to graph it, there's nothing between step A and step B. You deploy this code, it starts sending the metric, you pop over to your dashboard, you add a new dashboard, you tell it you want to see the NX domain graphs, and you're done. You don't have to deal with it taking up a lot of space or anything like that. So, and here's the new graph that I added, the NS domain graph. Nice. Plus, the software supports a lot of nice features for adding data. Like, I don't know if you'll be able to see this, but you can tell it I want to see values, the min, max, current, total, average. And you might want to do a— How do you get— oh, this tab. If you wanted bars instead of lines, you get bars instead of lines. And one other neat thing you can do, fairly straightforward, Oh, you can also do a table instead of that. That makes things nice. So basically, without really writing any code, you can generate some really, really nice dashboards. And then I think is you can still export them as like JSON data if you wanted to share them with someone else. So let me go here. So really, with hardly any experience in the software, you can, you know, send a bunch of Bro metrics, aggregate them, add a dashboard, just click around for a couple minutes, generate a dashboard for what you want to see, and make some pretty advanced graphs.
Uh, you may want to point out how easy it is to set up like Grafana and InfluxDB with containers because they're pre-packaged, everything.
Yeah, so I wanted to test this. I didn't want to have to deploy, you know, servers to test this. So we have kind of a test box running Docker. So I pretty much just started up a Docker container for InfluxDB and a Docker container for Grafana. And that's what it's been running off of.
So you're using the Tutum ones, right?
Yeah.
So if anybody's interested, github.com/tutum, I think, /influxdb or /grafana or something similar to the URL.
So one neat thing that you can do— so the ones I showed so far have been pretty basic where they just increment one thing, but You can also do something like— so for HTTP, instead of incrementing the counter by 1, I increment the counter by the size of the response. So that gives you the total bytes, not just total connections. And then I dynamically generate a status metric for the status code, which— so this one line of code or two lines of code generates the data for all these graphs, the HTTP 200 wildcard graph, 300, 400, 500. Comes from those two lines of code, I get four different graphs and I can drill down and look at just, say, HTTP 500s over time. And if you wanted to zoom in, so this will do, it's nice to make just HTTP, I have to click again, just HTTP 500s over the last week. But you can look at all the status codes. Or just one or two. So you just get potentially a large number of data from just a very small amount of code.
Can you go back to the big— the dashboard where you have it, where it shows like 50 gigabytes aggregate, or the number?
Oh, yeah.
So how do you do that?
Because I couldn't— Sure, sure. Yeah, that's just a different type of graph. So when you use the little menu here, instead of adding a graph, you add a single stat. Okay. And then the single stat, it's just slightly different settings.
That's the total traffic there?
Yep. So it's the Bro HTTP bytes metric. Okay. And you just get similar options. And what you do is you turn on sparkline. So without sparkline, you just get a number, but if you turn on sparkline and background mode, it still kind of looks like a graph, but it makes the data more front and center, and you can make the values very large. One nice thing about this software is also that it understands the different types. So, you know, if I told it was bits, it'll display like that, or none. Like, that number in this dashboard would be completely useless. You're looking at that, you know, how many commas would I have? But if it was, you know, dollars or something, you know, 13 trillion. But we can be smarter than that and tell it, no, you know, this is bytes. So it'll give you in tebibits or whatever the proper unit for that is. But it's also milliseconds, microseconds, nanoseconds. So it makes it very easy to get the right unit if you wanted to change the colors, things like that.
Are you using the group by option anywhere in your graphs? I was wondering how that works.
I didn't know if you knew. I don't believe so. I've really only scratched the surface in this. Plus, this is the older version of Grafana. There's a version 2, version 3, that's in beta right now.
Mug's using 2.
Yeah, that they overhauled a lot of it, and it's even more advanced. Like, I'm not sure if this has it, but they have a thing called templated graphs where you can have one setting that you change and then it affects all the child graphs.
One nice thing about it is like you had to mess with the configuration files to get your source In the new one you don't, you can just do add source and type in the URL of the InfluxDB and the password and username and it works.
That's metrics. Any questions?
Oh, it's really sweet.
Yeah, it's— so the really neat thing about it is— It's because Bro now supports plugins. You don't need to modify the core Bro, you just run configure, make, make install on this plugin, and you have the new function and you can integrate it into a different system. So basically it just ends up being just yet another way to get data out of Bro into another system. And if you had a large amount of data and you were trying to do something like Elasticsearch or Kibana, and your system was just falling over because it couldn't keep up with the volume of logs. You know, we've had a couple of spikes where it's dumped, you know, billions and billions of records, and I think statsdemon ends up using like 0.1 CPU. Like, I think it's running on these boxes, it doesn't even register. You know, Bro is using, you know, 80% of the CPU on the box, The stats aggregator just doesn't even register. It's so lightweight. I've tested it locally, just throwing like a million increments a second at it, and it drops a couple, but I think it still gets 90% of them, which means you could, I think, easily handle a couple hundred thousand increments a second from one— on one box. So, it's very lightweight. Oh, and by the way, I'm using, just because it's easy to deploy, the Bitly stats daemon. There are stats daemon implementations in Perl and Python and C, but this one is pretty easy to get going because you, if you have Go, you can just build the static binary, copy over to your ProBoxes. So very easy to get working. And yeah, like I said, the All of that data is 1.6 gigabytes. And I set this up— actually, I know when I set this up. It's whenever I committed this. So whenever I open sourced the plugin, let's see, about 2 months ago, I think. It's possibly a way for me to figure out—
Oh, we had a question from Gary in the chat.
Oh, hi, Gary.
Says, any chance of posting your example Metrix Bro scripts?
Yes, I can definitely do that. I might have to talk to Liam. So one thing I did, I kind of stole— I don't know if anyone has ever heard of Liam Brandl's Fire scripts. So he had a couple of scripts designed to just analyze some PCAPs and find interesting events for like DNS and SSL. So basically what I did was I just took his scripts and did a search and replace for like print commands with statsd increment. So it's basically just handling all these different events, and for each one, statsd increment, statsd increment, and you get some pretty neat things. It's very easy. You basically just have to think, you know, what event do you want to count? Like the one that does the SSH dashboard, 2 lines. Handle the new SSH event, template it in with the authentication status, and then increment it. There's very little code that you end up having to write to do these dashboards. So again, so yeah, that 2 lines of code provide this SSH dashboard with failures and successes on one graph over time. So yeah, I can definitely publish that, or at least rewrite them. Some of them have turned out to be less than useful. I kind of just was like, I need some scripts that throw a lot of events, and I knew his off the top of my head threw a lot of events. But I kind of have a better idea, I think, now of what's useful and what isn't. So I might come up with a more standard set of scripts. Yeah, the nice thing is it really just does make it very easy to experiment. You know, if you know what the event is that you want to graph, you just hook into it at an increment and now you can graph it.
So, um, were you going to check with Liam and then see if—
yeah, I forgot what the license they were under.
Okay, well, if we— Gary, if we hear word back on that, we'll, uh, post it on the mailing list or get in contact with you.
Yeah, I could always develop my own service from scratch, or that— like, it's really, it's really only—
we'll just bug Justin. That's probably the best thing.
Bug me. It's really just this DNS graph that shows all these different events, and this SSL one were the two scripts I stole from Liam. The rest are just the one that I came up for testing, like the HTTP. That's a bug that happens. I think they fixed it. So yeah, so that's, that's debugging with Bro sending data to an InfluxDB and Grafana server.
Sweet. Yeah, it's really cool. I love the visualizations on here, how easy it is to make it look— yeah, presentable.
The main thing that surprised me was once I got it working, just how easy it was to go from nothing to a dashboard with tons of graphs on it showing some cool metrics and finding some trends.
Peter, up next, what do you got?
Yeah, I can talk about that. Yeah, go for it. Sure. So kind of the main thing I do is like glue systems together and integrate things with other things. So one of the things that we've had, but it kind of needed a rewrite, was a black hole routing system. So it's, it's a common thing that a lot of sites have where you have an IP address and it's bad and you want it to not be on your network anymore. And a lot of places handle this differently. Sometimes it's a firewall, sometimes you do null routes. Sometimes you do null routes with BGP, and there's a lot of projects that do this, but in my experience, they handle maybe 50% of the problem or 75% of the problem. Like, they might be good at blocking IPs, but they don't support auto-expiration, or maybe they support blocking and unblocking, but they don't have an API, so you can't ask it, hey, what's currently blocked? So a project I've been working on over the last couple of months is a project called the BHR system. It's not a very creative name, I guess. But it consists of a couple of different components. So there's the actual Black Hole Router site, which I'll demo in a second, that handles the web interface and the API. And then there's a standalone Python client and then integration with Bro, and the mechanism that we use for blocking uses XAPGP for injecting null routes. So the nice thing about it is the actual site doesn't really care about how things are being blocked. It doesn't care where the blocks come from. It's kind of just like a message queue API server. All it cares about is what's blocked, should it be unblocked, and you know, how long has it been blocked for. It has no opinion on where they're coming from or where they're going to. Which makes it really easy for, you know, another site that might want to use this but they want to actually implement the blocks in a different way. Well, now they don't have to throw out the whole thing and rewrite it. They can use all the code and just rewrite one small component and customize it for their site. So the web interface is pretty easy for people to use. It's kind of what you expect, you know, you could block an IP. You say this is a bad IP, block it for 5 minutes, and pick block, and now it's blocked. And I blocked it a short while ago for testing. And you know, I can add another block, 2345, block this one for a week. So now we have 2 current blocks, 2 expected blocks. You got my block list. So it kind of supports the full workflow. So like a help desk can use this to see what's currently blocked. If they know something's blocked and they want to know why, they can query it. So it's kind of like the end-to-end system for maintaining blocks. And the nice thing is Well, there's kind of two nice things. So one, it's built on top of a REST API framework. So there's a full API for finding out what's blocked. So if you wanted to integrate into another system, so our current blocks, you can hit this API and it gives you JSON data of everything that's currently blocked. And blocking is actually, Really just another API call. So whatever that integrates with the system just needs to send simple HTTP requests, which means that if— even though the server's all written in Python, if your group really liked Perl, you can still integrate with the system. And it doesn't use any kind of weird protocol. It's just standard HTTP and JSON. So pretty much any programming language will integrate with it. So this is what it kind of looks like from the user standpoint. The basic, you know, add/remove query. If I turns out this is bad, we can click it, unblock selected, and say this was fixed, and unblock. And you notice if I reload, that just updated because what I have here is kind of the dummy blocker running. So normally you'd have one of the clients that integrates into the system handle the blocking and unblocking. And for testing and demonstration purposes, there is a tool that comes with the client called BHR client run standard out, which all it does is it implements the blocks to standard out. So it says what would be blocked, what would be unblocked. So if I flip back over to here and add a block for 4444, it'll block that. So that's connecting up to the API and asking for the feed of things to block. So it responds pretty quickly. There's a couple speedups I would like to do. I just need to look at the kind of current state of WebSockets and figure out what the best way to do it to get that block time down from what's about a second to just even faster. And unblocks are checked less frequently just so that unblocks never starve blocks, because especially when you're trying to react to an incident. If an unblock takes 30 seconds, no one generally cares, but you don't want blocks taking 30 seconds. So I unblock that, it's going to take upwards of 30 seconds for it to just check. Just, it's a priority thing.
Could you show, uh, is there a graph that you can view to show how many people are blocking for some time frame?
I could probably show you ours.
Yeah, maybe.
We just implemented this for campus.
Oh, cool.
You want to connect to the Zoom call?
We can screen share too. Uh, did you guys do metrics?
No, but I mean, I guess you could pull up the interface and show. Oh, I think you have access to it.
Oh yeah, uh, actually, I'm saying I do. So this is actually— that one was running locally on my system. We actually have a production instance of this It's just seeing one feed. So right now it's blocking 21,000 things from the Team Comrie Dragon Research Group SSH list. Oh, which I could demo. So one of the things, you know, once you write a system like this, you realize pulling in a feed, blocking the entries, unblocking the entries, kind of a repetitive thing. It's such a common task, so I have a class called SourceBlocker. So this is the entire code to pull down an Intel feed and load it into the backend, you know, and handle— handles all the protocol, all the authentication. All you really have to do is implement this function called get records, and this is just the code that you need to pull down the feed, parse it by the columns, ignore the comments. So if I run this, I think to basically need these environment variables. I will steal those. I set those environment variables and run dirg.py. It's just going to go ahead and start blocking. So now you can see on my stats, I have expected blocks 300, current blocks. You can see expected tends to go up and then it catches up. So one nice thing that I implemented is most of the API calls act in batches. So even though this is loading, you know, hundreds of blocks a second, it can apply the 100 blocks a second on the backend. Because the first time I did this, I didn't have the batching. So, you know, 1,000 blocks would end up being 1,000 API calls. And no matter how fast the backend is, the API latency and the network latency just kills the performance. So now it does batching in groups of 100. So applying, you know, tens of thousands of blocks doesn't take as long as you would expect. It doesn't help that this is running on my laptop in a VM on battery. It's a little faster on an actual server. Yeah, you can see it's just churning away, loading thousands and thousands of entries. And that page is going to be a bit slow. Probably asking a little bit much of the laptop right now. Yeah, the nice thing is, so now I go to query, take one of these IPs, search for it, tells me— not actually— oh, there it is. So it's in the database. Now it's blocked. So now someone can figure out what the deal with that is. If you got a link or something like that. There's not much more to it.
The plan for us is to use Bro as a source for blocks. So if you see SSH attacks on your infrastructure, you can programmatically block those as they're occurring.
Yeah, so I have the full integration with Bro all ready to go, the Bro script that you need to run the tool, the Python kind of integration. And this is a little advanced because it has queuing support, so in case the API was down Bro will queue the records locally. And yeah, pretty much all ready to go. Just drop it in your Bro server. As long as you have all the prerequisites, you can go from not having null routes to having, you know, Bro-fed null routes.
So I want to say when we were testing this, we had it turned on some dev routers and we were just watching it cook without actually placing any production blocks.
Yep.
And I want to say there was something Like, they were north of 2 million Woodmead blocks.
Wow, you guys see a lot of stuff.
Had we actually been through it—
so how long was that? What time span was that?
It was over like 2 or 3 weeks.
Oh, okay.
Yeah, I mean, that's still a good amount.
Yeah, the nice thing is it's all, all basically lessons learned because I've done this 2 or 3 times. It's all configurable. You can say what you want the default duration to be. There's per-notice durations. I had a feature for country scaling, so you could say, you know, Chinese hosts or Romanian hosts, you could bump up the scaling and scale them, say, 8 times as long. Or if you wanted to say— I didn't try it, but it would probably work to set a default block duration and then set the US country scaling to like 0.25. I think that would work. So yeah, supports a lot of different modes of operation. And yeah, a lot of this stuff isn't a lot of code. It's just kind of annoying code that you have to write to glue two systems together. You know, a couple of pages here and there. And what's nice about this system is I've tried to engineer it so that it is flexible and is really not opinionated at all. So that it doesn't, you know, corner you into any kind of one— oops, I wanted my repositories and searched for everyone. Yeah, it's, you know, I've seen other sites have ran black hole routing code and ends up being tied to one source or tied to a specific router or hard-coded to work with a different tool. So what's nice about this is like our actual BGP router integration is just another client to the system that runs extra BGP. To do the actual null route injection. So if you didn't want to use this and you wanted to use— say your site had an OpenBSD firewall, you just kind of have to write a client that talks to the API and pulls down the block lists and feeds it into pf. And you could still use all the other components without having to start over. And one nice thing is that it also supports multiple clients. So you could do something like run one centralized VHR instance and run an exitBGP client, an OpenBSD client, and they'll just all pull down the blocks. So you can do this on, you know, a very large distributed company and feed these block lists just to all different locations from one centralized location. Because that's basically what the API does. It's the bookkeeping to determine what's blocked, what should be blocked. Like, if I go here— oops— if I go here and kill my standard out blocker and add a block— so you can see on stats we have current expected match pending is 0. If I try adding a block for 5555, I don't think I have one for 5555. Now if I go to stats, you'll see block pending is stuck at 1. So it knows that, hey, there's a new block, it hasn't been applied anywhere, something's wrong. Current, you know, isn't matching expected. I start that system up again, it'll immediately sync up. So if one of your systems is offline for a while, it comes back online, it'll sync up the full block list and start up just fine. Oh, another nice thing that this supports 'cause as soon as you implement this, you'll run into a problem is, you know, what happens if something gets blocked that shouldn't get blocked? It's like, no, let's block Google DNS, 'cause no one would ever do that, right, Jon? So try to block Google DNS, you get an error, hey, that's whitelisted.
Did you do that?
No. By no, he means no. So, you know, like Google DNS.
You know, that's a real dick move. I'll move DNS if you mention it. You're on campus and you just sat there like, no, I wasn't expecting to break it either, man.
I don't make fun of you anymore.
So the other nice thing is that Fairgame is built on top of Django, so we can leverage it for some of the boring stuff like adding whitelist entries. So if I go here and say whitelist 9999, um, At least it was just 2 IPs. You know, so that's all you need for someone to whitelist.
I didn't block any IPs, I just— it was being called a bunch of domains.
And the nice thing is that's also hooked up to the API, so if you had a large list that you wanted to whitelist, all you need to do is do a POST, now I can't block 9999, and And so it's, it's all these little details that are important. So one thing you'll want to do is, hey, we should whitelist our local site so we don't accidentally block our own hosts. And then you realize, hey, well, what happens if we have a compromised localhost that we want to block? Well, that's what this skip whitelist button is for. So when you really, really want to block something, even if it's in the whitelist, you can skip the whitelist and block it anyway. Nice.
So that's really useful.
It prevents you from shooting yourself in the foot, but if you're really determined It provides you a way out, so. You have every right to show that yourself if you want. This is America.
Question in the chat, Gary. He asked, how did you guys talk your various network teams into allowing you to do this? Especially in regards to the batch loading of intel lists and programmatic blocking from Bro.
I didn't, but he could answer that.
Yeah, maybe Will can answer that.
Lots of bros. Lots of booze.
Surely there's a better answer.
I got them highly intoxicated and got them to sign agreements too.
So we actually—
I'm told our shop is unique in that we have a pretty good relationship with our networking team. I've met with other schools in the CIC who lament at the fact that they do not have as constructive relationships with their network groups. I find this to be appalling basically because ours is so good. You know, I think we took baby steps. We're not even really taking in feeds en masse right now. We're really only taking in one.
And the feedback on that one so far?
And so far it's been great. I think one, you know, the relationship helps just having that there to begin with. Obviously trust is huge. They trust us not to screw things up. I mean, we've all screwed things up from time to time, but by and large we don't. I think letting them drive in terms of the testing efforts was a big one because we weren't overly aggressive in trying to put things into production. I guess there's not really any magical formula. I mean, You know, a lot gets said about knowing your stuff technically, and not to distract from that, but it always helps to have good personal relationships with people.
Yeah, and I'll say at the NCSAR, we have a good relationship with our network engineering people.
Right.
Now, another example, we— so one of the things we want to do is start pulling in reputation feeds for DNS so we can sync all those to a site that we manage. Malicious sites, and that does make our DNS service manager a little nervous, so we're probably not going to broach that one for a while. For now, we just do all those manually and on a one-off basis. Yeah. Now, I guess the more aggressive play there is that if you're running a Bro instance at your site, you can effectively circumvent your networking guys because at that point you're just intercepting raw protocols off the wire and Now, politically, I don't know if that's the right thing to do because, right, I mean, if my DNS service manager found out that— I'm saying this on a recorded call, but— like, right, I mean, if we just started intercepting DNS and like any DNS, regardless of what type of resolver someone was using, and we started sinkholing all those requests to our domain, he, she, you know, whomever might start getting a little upset because you're basically intercepting the protocol campus-wide. Or site-wide depending on what type of organization you're at. So I don't know, if I had to sum it up, I would say relationships and patience, not being overly aggressive in your timeline. Obviously you don't want it to take a year, but you know, don't try to push it in a month or something.
And encourage Whiskey Wednesdays with your NetEng team. Right, that's actually what happens over here at NCISA.
Well, so we found out about the Black Hole Router— so NCSA is across the street from campus IT. And so I work for campus IT, and Jon and Justin work at NCSA. I found out about this from playing volleyball with you guys last summer.
Well, technically this didn't exist until you added it, because we had our Black Hole Routing System, but it's kind of old and crufty.
Yeah, we did have one, though, so maybe that—
Yeah, so at first it was like, well, why don't you get our Blackhole Router system running? I'm like, yeah, I'd really rather write a new one. Like, OK, you do that.
Well, and so that brings up a good point too. If I had to say, obviously, we're like, well, Justin must be this kind-hearted fool for coming over and basically helping us with our implementation. But really, if you step back and look at it, it was a mutually beneficial arrangement because you got to test the updated code base in an environment that wasn't your own.
We hope to get this running like this week, right, switch over from the old system.
And so I guess that's something else, if you could— I don't know who asked that question.
Gary.
Gary, if you can find a way to construct propositions that are beneficial for all parties involved, make clear the win for your networking group as well.
He does have Thirsty Thursdays, he said.
Yeah, Thirsty Thursdays, you get him drunk.
Yeah, I will add one thing there. So there's the automating the blocks, and then there's having the automated blocking system. And I think it's important to make a distinction between the two, because even if you don't want to automatically push blocks into the system, you'll still want to block something manually. But blocking something manually shouldn't involve, you know, logging into the router and manually typing like a null route command, right? Because for many sites it still does. And then when they finally decide, okay, let's do feeds, you don't even have the automated way of doing it. So even if you don't plan on using feeds, it's still nice to get a system like this up and running because then everyone can use it. It still has the API, you can get metrics and logs and reports, and the help desk can use it even if you never push anything into it, even if you're just using it manually one or two times a day, right? You still get huge wins across the board.
And so our CISO loves the hell out of this because we can generate metrics and pretty pie charts and stuff, and he can go show it to the CIO and, you know, the provost and whomever and say, look, you know, this is what we're doing for you, and this is data.
Oh, I'll add one. So one problem with that is it's actually very hard to generate metrics for problems that it prevents. Like, you might have issues with machines getting compromised from, say, SSH scans, So now you start blocking SSH scanners. Well, how many incidents did you prevent? Right? Like, you can tell, you can say how many scanners you blocked.
So you can't really say, yeah, right, you can't really say how many of those scanners would have been successful. Yeah, their authentication attempts.
Not to like diminish it, but it's, it's annoying because you can't say like, hey, we prevented 50 incidents. You probably did, like, over the course of a year, all the things that are being blocked, especially you start blocking like exploit kit sites, right? You know, we used to have issues at Albany. You know, someone get compromised, we'd immediately block the exploit kit site. You know, how many other people did we prevent from getting exploited, right? The only metric we have is, yeah, we got one person infected.
Maybe you can use some sort of correlation between prior to having it.
It's hard to prove a negative, right, is what I'm getting at.
You know, but, and so I guess two things. I, you know, once I pass that sort of thing up to our CISO, at that level it's all about spin job anyway. And so, I mean, that's— it's unfortunate in some, some fast— in some ways, but you know, if you're a sales guy at that level, you're basically just trying to get budget and win hearts and minds for your team, right? Clear hurdles. But I guess from a more operational perspective, I think it would be interesting. You always say from— well, from an incident response perspective, You know, it's often said that containment is predicated on proper scoping of whatever it is that you're seeing. And so I think it would be interesting if you— and the overhead on this must be just killer, and now that I'm thinking about what it would take to make this happen— but if you could take all of those IP addresses that you've blocked and then feed them back through your SIEM data as indicators and find out if any of those were successful anywhere else on campus.— or in your site prior to getting blocked. That would be interesting. And then you could know that, hey, this one actor was actually successful in logging into 3 hosts before it got blocked site-wide.
Yeah.
I don't know. I think that would be interesting. I don't know what it would take to make that happen, though.
They did something like that, but going forward.
Take a jazzy jays off.
Going back. Yeah. It's a good idea. Jesse J. Yeah, that's about all I really do.
You don't know me like that.
Did you want to talk about ninfo?
Yeah, because that's really fun and everyone should use it and it's hard to get people interested in it. And I always hate it when I see people reinventing the wheel, writing like one-off scripts. So, I have a presentation that I wrote up that I could quickly zip through. Uh, oops, that is not the GitHub. It's on. If you Google it, it's the third hit on Google, at least for me. Clearly Google is like tailoring results to me. So any info is about querying all the things, all different data sources. Oops, that's not gonna work, but this will. So it's— I think I started writing it, the first version, probably in like 2009. Where it's like, okay, we wanna take this IP address on campus and find out who owns it and where it is. Oh, and what does it resolve to? Oh, and did it set off any Snort alerts? And you start just adding all this code, and then you run it, and it just takes 5 minutes to run, 'cause maybe the like Snort database is down or something else is down, or then you realize you end up with 500 lines of code to just do a lookup. So it's like, okay, plugins. You know, let's do plugins. Snort plugin, DNS plugin, WHOIS plugin. And— Yeah, basically once you get into plugins. So what it basically is, it's 3 different things. And this is its biggest strength. Because primarily it's a library. You know, you can use it in other code. And it comes with a command line tool and a web interface. So it's not just a command line tool you need to do screen scraping. It's not just a web interface. It in theory makes everyone happy. If you want to write code, you can use it as a library. If you just like using the command line, you can run it. And what it does is it wraps other APIs. So, like, I'm sure a lot of people have used things like GUIP. It's like, well, how do you use GUIP? Well, you have to, like, import the library. You gotta create a database, probably, right? You gotta do something. Okay, now I can look up my IP address. And it's like, okay, that's GUIP. How do you use, like, the Shodan API? Well, I gotta import some module. I think there might be like an API involved. I gotta make a client. There's some function, and everything is different. Every— to just do a lookup for some IP address or something, every data source or tool wants a different API. Some things don't even have APIs, and you have to screen scrape. So you want to build an API on top of some service that doesn't even provide one. And so the big thing is it's a uniform API. Once you get this running, looking up GeoIP, Shodan, WHOIS, DNS, it's the same way to look up everything. And it doesn't matter what you're looking up, it'll figure it out. So what does it look like? So if you want to use as a library, you import it, you make an instance of the class, and then say, okay, I want to get info text for GeoIP for this IP address. And there's some rendered text. If you didn't want it as text and you wanted it as data, well, then you just call get info, and you get a structure back, and you can say, "I wanna look at country name." And then, you can do the same thing on the command line and say, "Okay, I wanna do GUIP, and let me give it two IPs." And it knows how to call GUIP, two different IPs, gives you the result. And there's also a web interface, which I can demo real quick. So, if I do the same thing here, 1234, and it's gonna start running all the plugins asynchronously in parallel, and data will pop up as soon as things start finishing. So, passive DNS, annoying. 1234, apparently lots of people make things resolve to 1234. And there's my, sorry, wait, there's my GUIP and all this other stuff. I'll come back to that in a second. But you can see I just looked up a dozen different data sources in about 2 seconds. So, it's all about plugins. You write a plugin, you do your setup, you do your get info, and the big thing is you can render data, text, or HTML. So, I mentioned Shodan. So, you wanna write a plugin for Shodan. So, you do all the boilerplate, which it's, one of its strengths is you say, okay, I wanna plug in, it's called this, I want to cache data for 2 hours. This plugin only understands IPs, so if someone does a search for a MAC address, don't bother searching Shodan because it's not going to do anything. And then you just call— you name what your plugin is, which is Shodan plug. And then you really have to implement 2 functions: setup, which grabs your API instance of the Shodan API, which apparently needs a API key, and then you call your get info function, which doesn't have to do much, it just delegates to the API host function in Shodan. But the nice thing is, once you write this, you don't even have to remember that. And you write a little template that renders the data. And writing plugins, there's a nice template for it. So lots and lots of related tools. So once you get going, the nice thing is there's lots of plugins. Plugins, DoIP, Whois, SIF, LDAP, you know, Jira plugins. There's lots and lots of plugins. So you don't have to kind of have everything in one giant code base. So using on the web interface, so 1234, kind of annoying. It's okay. Yeah, apparently everything resolves. So I'll give you an example. Let's resolve google.com, get one of these IPs. So info that, say you saw this IP, you didn't know what it was, you throw it into info. And apparently, yeah, all these different domains resolve to it. Apparently we searched for it at some point in our SIFT database. Team Cummery says it's Google owns that AS. DNS response, so direct DNS resolves to their google.net. Number thing, where you can see the difference in passive DNS is this very user-friendly list of domain names, where the actual DNS is rather useless. And NetFlow Indexer is a separate project I wrote that indexes NetFlow. So this just searched about a year's worth of NetFlow to say, have we ever connected to that? And I guess we haven't, because that's, I guess, the IU Google— we get, I guess, a different set of Google addresses, so we hardly ever connect to that. If I do a different address, let's do 8888, you'll see quite a different thing. So, actually it should come up because when the BHR history runs. So you have passive DNS for 8888. Apparently a lot of things resolve to it for some reason. Apparently that's why we had a problem. I guess people are just doing screwy things and having domains resolve to that. And you can see /sys/local has some data. And yeah, so our netflow stats, we've seen it every single day out of the past 499 days, and just about every 24-hour period every 24 hours. And Site Advisor says it's green. Wow. Oh, and yes, BHR history. So apparently, Megan logged 8888 on the 4th at 5, or 50 minutes after midnight. So this is the basic look interface, but where it gets neat is you might have a lot of data. You can do multiple lookups. So you can come here and say, okay, I want to look up 1234-8888. Let's look up one of our addresses, 148.132.2. Put any number of addresses, and let's say for those plugins I want to say, you know, what the GeoIP location is. Did our local SIFT server have anything for them? And what about our NetFlow indexer stats? And I hit run, and that's just gonna run those 9 plugins all in parallel asynchronously, and we can get the data. And the neat thing is, it's all responsive. So if I turn off the NFI stats, it just hides that plugin result. So I could drop back down to nothing and say, okay, let's DNS resolve those 3, or let's look at Threat Expert. And Threat Expert says nothing when there's nothing. Those won't have anything. Or the Wi-Fi. The one downside is on wireless, this can put a lot of strain on the backend because it makes so many HTTP requests. Oh, EHR history. There it is. So, things disappear, things come back as you turn on the data sources. So, the nice thing is, is everything runs asynchronously. You might have a data source on campus or something that's just slow and it takes a while to run. But since it all runs asynchronously and does caching, like one nice thing is if I sent Jon this link, like we were investigating something and he opened it, the page will load instantly because all the plugins do per plugin caching for arbitrary time frames. And again, so that's, that's on the server. But again, this all works exactly the same on the command line. You can get a list of your plugins. Say I want to run the DNS plugin for 8.8.8.8. There's the result. You do the same thing on the command line. Makes it really easy to build tools on top of this, because then you get the same caching for free, get the same simple API for all the different data types.
And we have this in our— we had it on IRC, and now we have it in our new chat software.
Oh yeah, I get you. Oh yeah, check this out. So I just need to get— but that's kind of cool. That looks pretty fun. Can I share this? Clear. Okay, so we have— I have Qbot hooked up to this. So one of the things that actually doesn't come from the ninfo, but it's a similar data source, is we say, hey, has there been any traffic to 1234? It says, sure. We find out that some IP is really bad, we say, hey, is there any traffic to 77665544? And that's below the indexes, it'll be slower, and it'll come back. Did you forget to Oh, I did, yes.
But this is really nice, so this is our chat system that we use to communicate, you know, every day on events and stuff, and we can simply put that in there and someone knows, hey, everybody on the team's aware that, hey, this might be something to look into.
Yep, there it goes. It's a little— the caches need to warm up, but like, so if I did 776622, I think it's like— I did, I forgot to. That'll— much faster. Actually, I'm surprised that had traffic. Who the hell talked to 7766544? But actually, that's, so then you can do the full info where you do ninfo nfi_stats. Well, like if you didn't know, it's, you say plugins, nfi_stats plugin. So, that was a couple of months ago. Someone talked to those addresses. And what works much better now that we're off IRC is you do nfi_stats for 8888 and you get 400 lines, it handles it much better than IRC did, because you just collapse. So, yeah, it's, and it's really easy to hook this up. It's a couple lines of JavaScript that just hits the API. And that's, again, another benefit of kind of centralizing your ways that you query things. So, and anything, so I've just been doing IP addresses. It'll do usernames. It'll do hashes. So if I MD5 a string and I search for this, it'll know that it's a hash and it'll look it up. It looked it up on a couple of different sites. None of them had any results because it was just me typing gibberish. But it knows the difference, so it knows that, hey, that's, that's a hash. There's no point in searching a system. You know, I could put a username in here for me and it's going to pull out everything I've null routed for the black hole router. It'll pull up recent logins from Splunk if Splunk wants to cooperate. It can sometimes fail. Yeah, so that's all my login records. So, and what's really nice is once you get this going, you've had it for a while, you just use this. And so you have an IP address that you put it into this. You have an IP address that's scanning you, you want to know what's up, you put it into this. And it basically becomes like the only tool you need to use ever. Right.
Yeah, true, true.
Like, we hooked up like NetDot into it using their API. So it doesn't have great— or I just registered my machine today, I think, or 236. So now, you know, if we put a local IP, it'll tell us who owns it kind of thing. And now you don't have to use, you know, a separate website deal with logging in just to figure out— I forget what my IP was. And again, the nice thing is that it runs everything in parallel all the time. So if certain systems are slow, you don't have to deal with logging in and waiting. You know, especially a lot of systems don't have a bulk API. Oh yeah, netdoc. So that was someone else's, but— So yeah, so it's like if you had like, uh, 4x in, uh, or I don't wanna do that. 3, 4, 2, so if you had a list of IPs and you needed to know who owned all of them, a lot of systems don't support bulk lookups, but it doesn't matter as soon as you write a plugin You can do a bulk lookup, and that just did a bulk lookup against the net.api in a couple of seconds. So, it becomes very nice. And especially because I could have done that exact same thing from the command line, from like a one-off Python program, and it just abstracts out all the details on how the API works. So, that's basically ninfo. Very cool. And it doesn't really show, but I've written it and rewritten it about 4 times now, just realizing that, you know, the API isn't as clean as it could be, or writing plugins is too hard. And now it's pretty much like the API from users to write a plugin, like, it really doesn't get any simpler. It's plugins basically have— like, you couldn't make them any shorter at this point. You have the setup function, you have getInfo, It's actually another feature I've been kind of working on, on and off, for doing conversions that plugins can register that they can do conversions. Like, you might have a data source that can convert an IP to a MAC address or a MAC address to a user. So you could ask ninfo, hey, I have this MAC address, can you give me the user that it belongs to? And it'll go through the plugins and figure out what plugins have registered that, hey, I know how to convert a MAC to a user. I'm like, you know, my network registration plugin, I can do that. Yeah, that would be really nice. And then it's nice because then if you want to integrate this into a system that might need to do MAC address to username lookups, now you don't have to hard code your site-specific data source. You can just say, OK, use ninfo. And if your site's different than mine, just write a plugin that exposes that conversion plugin. And now you don't have site-specific code.
Speaking of that, we have a question to do with that. Gary asked, have you integrated ninfo with local ARP data or IPAM systems get for MAC to IP mappings, etc.
Yeah, exactly. That's what netdot here does. I have a NetDisco plugin. If you've used NetDisco— I thought I had it. I know I have it somewhere. I might have forgot to open source that one. I definitely can. But yeah, it's for exactly that reason. So you don't have to hard code NetDisco specifics into a script that's just trying to look up a MAC to an IP. But yeah, that's—
You already answered that. Yeah. You said never mind before I saw it.
But yeah, that's exactly what this kind of thing is for, is 'cause all systems are different and their interfaces are often terrible and they don't have APIs. So you kind of just solve the problem once when you write a plugin and then you don't have to deal with it again. And you see, you get the command line, you get the web interface, you get the chatbot. You know, you solve the problem once and just everything can take advantage of it. Yeah, it's very nice. Like when we get the new BHR system going, I'll write a plugin for it so we'll be able to talk to it from the chatbot and ask it if something's blocked or not. All right. Yeah, so I think here we only have a dozen plugins or so. At my previous job, we had about 30. Just any data source on campus that you could ask it for an IP or a MAC or a username, we had a plugin for. And it was amazing. He just never ever had to use another system. Right.
Yeah, it's nice to have it all aggregated in one place. Okay, well, I think we're about time now. Well, and almost perfectly if we end now, so. Thank you, Justin, for coming out. I'm sure a lot of people will enjoy these tools that you have written. I posted the links in the chat if anybody wants to check them out. This video will be online probably tonight on Vimeo and YouTube. And if you have any questions, do feel free to post in the mailing list, email me, or anything specific about Justin's presentation, you can email him at justinazoff@gmail.com.
All right, until next week.
All right, thank you guys.
Take care. Turn that off. Stop sharing.
More from Jon


What No One Knows the Podcast / Vodcast featuring The Tampa Bay Wave and Jon Schipp

Meeting the Exposure Management Challenge: Key Use Cases for Success | @OfficialRapid7 #SolutionSpotlight

Spot Security Control Gaps and Non-Compliant Resources Across Your Attack Surface






