OpenNSM (OSQuery - Teddy Reed and Mike Arpaia)
Teddy Reed and Mike Arpaia demonstrate osquery, Facebook's tool that turns operating-system data into SQL tables for host monitoring. They cover installation, querying, the osqueryd daemon, and deployment at scale, plus plans for client-server distribution and a public query repository.
Chapters
Excellent.
Alright, we're getting started here. Hello everyone, this is Jon. I run the Open Network Security Monitoring Group at the University of Illinois. We're going to get started through the notes. Some updates. Shane graciously bought open-nsm.net, so when we get our lab up and running, we'll be able to have domain names instead of IP addresses to access the VMs in our lab. And I'm currently working on the Ganeti cluster at the moment. It's taking some of my free time, but hopefully it'll be done within the next couple of weeks here. We're also looking for sponsors, so if there's any businesses or organizations that are interested in donating hardware, software, or even monetary donations to help keep up our equipment, that would be greatly appreciated. And we can actually support your banner, or if you actually let us, uh, see your hardware or donate to us, we can actually review it if you have any commercial products, etc. So get in touch with me about that. Also, last week I created an OpenNSM Twitter account, so @OpenNSM. So go ahead and add that. I'll be tweeting all the articles, I'll be tweeting the speakers, etc., etc. And #OpenNSM is the hashtag we've been using. We're gonna jump right into the meeting notes here. So a few things. Bro 2.3.2 was released a few weeks ago, and now there is a package in Security Onion, so that is available if you want to app-get and then update the system. As well, Securedon had a new package out for Elsa that actually allows you to parse out additional fields in Bro's DNS log, and those are like the query field, the query types, etc. And then of course there was some Flash zero days and patches out on that. You can read Krebs's article on that. And we're gonna go ahead and fly through this here because we got some guest speakers today. Tool tray, this is where we talk about new tools or old tools that maybe we haven't heard about. We just give it a brief mention, people you can go and look for them. So the Army Research Laboratory released D-Shell, a forensics framework, and I think Shane was gonna mention, have a few comments on that.
Yeah, do you want me to share my screen or?
Yeah, go ahead.
Alright.
Will you release the share?
Yeah, I'm sorry. Change, change, change. There you go.
You can click, uh, share screen.
You should be able to kick me off.
Yeah, it's saying I cannot share screen while the other participant is sharing.
Oh, all right, thanks.
Oh, there we go.
Here we go.
All right, here we go.
Okay, this is— let me show one other thing.
Oh, by the way, if anybody knows how to get in touch with the guys that wrote D-Shell, do let me know. I've been looking for some contacts and unfortunately I can't find anything.
Okay, I'm ready.
So basically I just stumbled across this article first on Facebook, I think it was, and it looked pretty interesting. Army Research Lab releases D-Shell forensics framework. And there wasn't a whole lot of information on here. One thing that was kind of cool was it did set up a link to the actual Git repo here, and I was able to find it, and all the code is right here. Now, this is maybe not the exact version that they are using, but it does have all the instructions here and everything like that, and this is a public repo anybody can pull to— from it. And they're allowing anyone to write to it as well. I was able to find another little article which had a little bit more detail, and what I found out was that they're kind of looking for some community collaboration here. The Army is hoping that people in industry and in academia will help to build under this DShell and to create some modules for it. And so that's what they've really been hoping for when they made this project public. William Glodak, and if I'm mispronouncing his name, I apologize to him in absentia, but he is hoping to actually release some other software as well. So as Jon said, we're trying to get in touch with some of these guys and see if maybe they'll give us a little bit more details about the about the product itself. And in the meantime, I've got the— here's the GitHub if anybody wants the links right there. If anybody wants to access that. And also, like, just a quick Google search for dshell will turn up all kinds of information about this tool. That's about all I was able to find out.
Cool. Thank you.
And then the next item was that A few months ago Cisco released OpenSOC, the Security Operations Center tool for big data. And hopefully we can talk— we're gonna try to contact these guys as well and have them on the show. So that's something to look out for. It's been released free and open source now. And at this particular point we're gonna jump right into the talks here. So we got Ted and Matt, is that correct? Is it Matt?
Ted and Mike.
Mike, I'm sorry, I apologize. Ted and Mike from Facebook who are developers on osquery, a really neat tool to query information about across all your systems for incident response and other types of things. So I'm gonna go ahead and leave this up here, everybody can read it, and I'm gonna turn it over to them.
Can I grab the screen?
Yeah, let me make you host real quick.
Perfect. So, okay, so a little bit of background. Mike can fill you guys in. He's the kind of the insightful one and had the genesis of an AutoSQL query. Started hacking on it. A couple implementations before we eventually arrived at some SQLite-based driver. Do you want to give a little history of, you know, why— what was the need for osquery? What problems we wanted to solve with it? And then, like, the original direction?
Sure, yeah.
So, my name is Mike. Nice to meet you all. So, back in the day, I used to— I still do, but a big hobby of mine is host intrusion detection. And I've worked on a few host intrusion detection systems at other companies. I've used a bunch. I've talked to a lot of other people who have used a bunch, and everyone generally agreed that host intrusion detection systems are really difficult to use. They didn't really give you much flexibility. They were really slow and weren't really ready for like a large-scale production environment. There were all these like problems that were going on with host intrusion detection systems. And if we sit back when we see a whole industry trying to solve a problem and no one really solving it, and they're all having kind of the same problems, it's often indicative that we're fundamentally approaching the problem incorrectly. So we sat down at Facebook about a year ago and decided, hey, we need to solve the host intrusion detection problem as well for us. Why is every— why is everyone doing it incorrectly, including ourselves in our past attempts, and how can we do it better? So we identified a few core principles as being really important aspects of a product that we wanted to create, and the biggest ones were simplicity, performance, interoperability with internal systems, and I was gonna say ease of use, but I guess that ties into simplicity. So generally, the way most host intrusion detection systems work is you'll kind of like write some code in the form of like a module or something that you'll plug in. But that's kind of tricky because most, a lot of times, security people or people that are kind of interested in like moving quickly while they monitor systems are used to writing things in Python or Ruby or kind of these interpretive programming languages that don't really lend themselves well to high-performance monitoring, right? Operating systems aren't written in Python, so when we write our operating systems monitoring frameworks in Python, there's a lot of internal APIs we can't take advantage of. The performance implications of running large-scale systems in Python kind of stack over time. So we're like, we want something that is as fast as if we were writing in C, but we don't want people to have to write C to use it, because writing deep operating system instrumentation code in C is kind of hard, right? So we wanted the performance of C, but something that was even easier to use than Python, because that was even too difficult. So, what we decided on is most people are familiar with some sort of a query language. So, when you want to query, uh, when you want to ask a question of an operating system, it's really intuitive to think of the operating system as a database that just has information for you that you can abstractly ask. Uh, so we created a kind of framework around exposing the operating system as a relational database such that when you open up the SQL shell or what have you, you can execute SQL queries and it feels like there's a MySQL database, but all of that data is actually being collected via— when you run that SQL query on a specific table, there's some native assembly that's being— that's compiled C and C++ that's being executed behind the scenes. So when you write SELECT FROM kernel modules, it'll go, there'll be native code under the hood that goes and uses low-level operating system APIs to get the set of kernel modules that are loaded and return them to you immediately, really quickly, really performantly. And it almost feels like there's this magic database under the hood. There's not, right? Which is really fun. And then there are a whole set of tools that we've built on top of that. Like there's a SQL shell. There's a daemon. What you're probably most interested in is there's a daemon for host-level monitoring. Where you can add some queries in. There's a bunch of information on that on the wiki. That's the general, like, genesis and why we did it and the bird's eye overview.
Cool.
Cool.
Thanks, Ryan. Yeah, all right. So let's jump into it. Let me figure out how to share my terminal again. You guys have— so it only works on OS X, Ubuntu 12.04, 14.04, and CentOS 6.3 and above. Essentially, like, the most common enterprise Linux platforms and client and Mac clients, because we have a lot of tools for Windows already. We do plan on replicating all the features to Windows, but not yet. There's, like, you know, a couple more things that we need to do for OS X and Linux before we feel comfortable saying that we've we have the equivalent visibility on those machines as we do on Windows, and then we can start improving the visibility that we have on Windows right now. So, if you guys have Macs right now, you can— and if you have Homebrew installed, you can brew install osquery. So, and that will give you— brew install osquery.
Right?
I have a different version on mine, but that'll grow out, grab our latest version. We just published a new one today. I'll push that into Brew a little bit later tonight. If you don't have Brew, you can install it from source. So, github.com/facebook/osquery, and then jump onto the wiki, install guide for OS X will tell you to use Brew. Otherwise, you'll have to make it from source. Linux, it's not as easy with Linux. You have to make it from source. We have a, we have RPMs and DEBs built automatically, signed with a GPG key, that we'll be hopefully pushing out tomorrow. But today, you'll have to go out and build it from source. And building it from source is kind of tricky. We have this make-deps which pulls in all the dependency packages. Some of them it has to download source and compile it. One thing we do different than most packages, and some people will want to slit our throats for it, is we statically compile as much as possible. So you say that to a package maintainer and they instantly freak out. Even a lot of people at Facebook, when we say we statically compile, they freak out because that means a lot of private memory that's taken up by the static libraries, which doesn't have to be if they're dynamic, right? Blah, blah, blah, blah, blah. We static compile for one huge reason, and that's a lot of the attacks that we've seen on Linux, anecdotally, will try to remove their process from the process tree the easiest way possible. If you have root, instead of going into the kernel and trying to unlink yourself, is just replace libproc. And our libproc is kind of built in, so you can't subvert our— the data that we push out by just changing some dynamic libraries on the system. The second thing, so we're— we try to be as kind of like forensically sound as possible. So when we want to install, we drop down a couple binaries. We don't drop down any dynamic library— dynamic libraries, right? So theoretically, if you had a couple of machines that were compromised, you could jump in, install the osquery, you know, package, or just lay down the binaries, and as long as you're using the same version of, you know, the core Linux and C, we should work, right? The second reason is it makes it really easy for us to build reliably if we're grabbing all the sources and compiling them ourselves and statically compiling into our binary, because we're all over the place. And let me show you what all over the place means, as far as what we support. Let's jump into the code. Let's hit osquery tables. All right, so here's kind of like the modules or all the features of osquery. At a very, very high level. Let's jump into networking. So, you can see here, almost everything in these directories is like an SQL table. So, /etc/hosts, interfaces, listening ports. We jump down into Linux. We get process open sockets, routes, ARP cache. We could do the same thing with Darwin. Jump into system, and we see We have things like SMBIOS, looking for SUID binaries, crontabs, CPU ID parsing, so features of your CPU. Jump into Linux, we get tons and tons of things, right? Darwin's massive. So all of these modules or tables that we have all have these wacky dependencies.
Hey, Ted?
Yeah, what's up?
We're actually seeing the window that you're looking at. The one that we're on right now is a Define a Schedule of Queries, and you're explaining—
All right.
Awesome.
Can you see it now?
Yes.
All right.
Let me back up a second.
I apologize for that. So when I was saying— guide. Jump onto github.com/facebook/osquery, hit the wiki, and then for OS X or Linux, we should have a couple instructions there to install. And then where I was just at was inside code. Keep all of our sources in /osquery, and then every SQL table we have is inside tables. The type of table, and then if that implementation is specific on an operating system, we then have the platform in there. All right, so I was kind of scrolling through here listing a couple of the tables that we have, and I was just at Darwin when I said, whoa, there's a lot of tables, and then you interrupted me. Thank you for that.
Sorry about that too.
No problem. Another way to view everything that we support is in the shell. If you did brew install osquery, you can then run osquery -i, which is the interactive shell. That'll drop you to a readline prompt, and you can do .tables or .help to see all the— it's essentially an SQLite shell, so anything you can do inside of SQLite, you can do in that shell too. A couple of things that we changed, right? So, it's very important for us to maintain all the dependencies that we have very closely because we're doing so many things. We don't want any of those packages that we're dependent on to change very slightly and kind of break our host instrumentation because we rely on the data that comes out of it to, like, you know, do forensics, detect bad stuff. So if any of those breaks, we want to know about it immediately, and we want to know about it in our build rather than at runtime. Let me switch back. Does that make sense? Any questions about that? Anyone vehemently opposed to building statically?
Sounds cool.
All right.
I'm going to kill that.
Brew.
All right. So here's the shell, osquery-i. You can see my shell, right? I shared that correctly?
Yep, we see it.
Perfect.
All right.
And I was saying .tables will show you all of the SQL tables that we have. And like Mike was saying, when you select from these tables, it generates the data on the fly. So if I select from processes where path like—
oh, it's free.
I'll see data about the shell that I have open right now. Let's do PID, name, UID, PID, right? So here's the shell that I would have open right now, and then I can grab parent from that too. So the really cool thing that we like to show when we first demo Postgres is joining. So joining data in like Bash or something is pipes, right? Pipes, greps, aux. Here, it's selecting from a couple tables and joining on a field, right? Joining on a column. So, what's a good thing to join on? Processes? Ports? Listening ports? Listening ports. So— What is the default? Yeah, right? That's a fun one.
Listening ports.
Alright. So, all the PIDs that I have that are bound to a port, right? The protocol that they're bound to, TCP or UDP, and then whether they're bound to like anything or just my localhost. So, if I want information about the process, right, let's do from listening ports processes, and what do we want to do?
We want—
let's get path, PID, port. Yo, processes where process ID is pid equals po.pid, right? And path is a little long, so let's just do that, right? So now I can see the process name for each bit. Now that's— it's like, okay, I can do that in Bash. I could do that with a couple of scripts.. But when we do it here, we actually don't shell out to anything. So to get the process list or to get the list of ports, we're using either like netlink on Linux or like the various libprocs that are supported on both Darwin and Linux. So we can do it very, very quickly. And if someone does mess with any of the shells or the shared libraries or any of the binaries that we have, it doesn't matter. It doesn't— it won't affect our query. Because we can do it so fast, we can schedule that very often. So we can run this, this query every couple of seconds, right, with minimal impact to the host. Now the cool thing is, when the data that comes out, when we log that, we only log the differences in that. So by default, if you were to install osquery on a server,, and when you do install from a package, you also get like the init scripts and the sample configs. Um, you schedule a query. I'll show you how that works. And then every time you run that query, the only thing that gets logged are the differences in the outputs of that query. So let's take a look at the config now, and then osqueryd would be the, the daemon that you could start up. Let's jump back to GitHub. Any questions about the shell or joining on the data that is yielded?
That's pretty straightforward, I think.
Perfect. So one last thing with that is, as I said, like, the data is generated when you run the query. When I run process on OSX, I actually run— end up running this command gen processes right here. This, and then I yield essentially a row of data for each process. I'm looking over, and if I were to put WHERE clauses in there too, I would also see like, PID's the, the easiest one to WHERE PID equals something. I can speed up the generation of that data by only emitting the data for a PID if that's in the WHERE or the the query predicate.
Could you increase the screen size in the browser? Or the font size?
Yep.
How's that look?
Go one or two more.
That looks good.
Perfect.
Thank you.
Right, okay. And then here is that row structure that we emit for every process.
Okay.
Kind of ugly. It's C, it's C++, and then it's Objective-C. So jumping in, we do like, you know, we do the same thing as the Army guys with DShell. We throw it out open source. We say, hey, come contribute to us. Give us more tables. But we know there is kind of this barrier to entry for writing C code. But if it's something you don't do very often, we will— we're definitely here to give tips, to review code. We don't mind pull requests for people who don't write C very often. We actually will love it. All right. What did I want to do? I want to jump in the wiki and show you about deploying the daemon.
All right.
So, you build. On Linux— oh, I was going to show the RD. So, okay, so I'll show you Linux in a second. OSX, we provide— we actually have this makeOSX package shell script, and we have one for Linux too. So if you wanted to do some custom config, you know, extend the binary, extend the source a little bit, add your own custom table, and then build either a .pkg or a .deb or RPM, We provide all the scripts to do that for you. That's actually what we do internally at Facebook, is we will build from the releases that are on GitHub, and then we will make a couple edits to the configs, run this script, output a PKG, and then deploy that PKG to all of our clients. So, when that, um, And then, on OS X, we use a launch daemon to start that as soon as the machine starts up. On Linux, we'll use an init script. I'll run through the init script since it's kind of more familiar to most folks than a launch daemon script.
Tools, deployment.
Right, okay. Pretty simple. I won't stay here too long. Start the daemon, give it a config path, pid mutex to make sure only one's running at any given time, right? Very easy. Let's take a look at that config now. All right. So, a bunch of options to set, you know, where do you want your logs to go? How do you want to ingest your logs? How do you want to ingest the config? It's essentially just JSON, so there's a little plugin architecture. However you get JSON to Osquery, awesome, but just get JSON there somehow. And then, this is kind of where the magic is right now, is something called scheduled queries, and this is where you would define kind of like all the things that you want to know about your enterprise or your client fleet. So there's an example one in there which just selects the info from the current running process, but every time you come up with a pretty good query, like I'm joining a couple of tables for processes, I'm looking for paths that don't exist on disk, so someone launched a process and then deleted the binary that was running. For kernel modules, looking for, or for kernel extensions on OSX, looking for kernel extensions that were loaded that weren't signed by Apple, so third-party kernel extensions, or kernel extensions that weren't signed at all. Those would be good configs that you would put into the schedule. Give an interval for them. The interval is kind of arbitrary, and you kind of have to work on, on how often. So for like kernel extensions, you don't expect kernel extensions to change very often, and when someone does load it, they're probably going to have it for a while. So scheduling that every hour wouldn't be a bad thing. And we're— this is kind of the area we're working on the most right now, which is how to better control the schedule of queries that hosts have. Currently, we will just change this config. We'll change it using like some deployment management, write a new config out when we have more queries or we want to make edits to the queries. Eventually we'll have a daemon that everything, all the clients can talk back to, a service, and they can get machine-specific queries, or they can update their queries within seconds. So, if we need to push out an emergency query to look for something very specific, we can do that. We will be able to do that. Any questions there? Are we on time? Perfect on time.
Any questions?
Where's the output of the schedule query?
Good question. So, by default, we push everything into /var/osquery, and that'll come out as one— as JSON events. Let me see if I can—
/var/log/osquery.
/var/log/osquery. Yep. So, that's the default. You can change it to, like, you know, wherever you like. We only have one logger— logging plugin, which is logging to the file system. That's another area that we're working on pretty hard, is supporting other ways to get data off the system. So, that would be, like, logging directly to some kind of, like, TCP socket, you know, then you could do syslog, you could do Splunk forwarder. So on and so forth. Is there any other log plugins that we wanted to make? I think just sockets is the biggest one. Yeah, I mean, it could really be anywhere. Like, if you have—
if you want the osquery data to log a result string somewhere, you just have to write a C++ function that implements taking a string and putting it where you want to put it, and that's it. So, you could log to disk, an HTTP endpoint, into, back into RocksDB, our internal database. Like, you can log to your internal log aggregation Flume installation or something.
You can log anywhere.
Right now, in open source, though, Ted's right, we only have the file system logging implemented, but we're open to feature requests and pull requests.
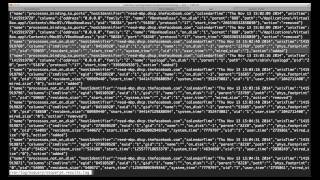
All right, let me share. Alright, I'll switch back to the terminal and I'll show you what those outputs look like. Alright, a little tough to read. I apologize for that. But, um, Let's go through one. Processes not on disk, right? So here I would have a query that I scheduled called processes_not_on_disk with my host, the time that it came out, the Unix time that was logged, and then the columns that I selected. So here, this process didn't have any command line. Here's all its, like, UIDs and whatnot, and then the PID and so on, right? And like, most of this is us just having like a little heartbeat. Here I have processes binding to ports, right? The, the BetterTouchTool, right, bound to a port like 0.0.0.0 across IPv6. Then, you would take that and, you know, you would set something to collect that log from the file system right now. You can also— we have another way of logging. This is called event-based logging, which is the default. The other way is results-based logging, which after every interval of time, you get this massive blob of JSON, which gives you kind of a summary of Here's all the queries that were run. Here's the things that were added. Here's the things that were removed. If you want to do a lot of work around aggregating, kind of like doing a MapReduce across your enterprise of the stuff that's coming out of your scheduled queries, logging it as this results view, pulling it into something like CouchDB or Mongo, doing the reduction there, and then coming up with some view would be epic.
Are all these done by default right here that we're looking at, or most of these?
Are they? Yeah, there's no default queries yet aside from that little heartbeat osquery info.
Okay.
The— we have a beta website that we're— I'll switch back to— that we're pushing out either today or tomorrow. We wanted to get kind of like these reliable builds of devs and packages and RPMs before we push the site out. But if you hit beta.osquery.io right now, We're gonna have this concept of query sets, which are packs of queries that you can download. And those would just be essentially like a sample JSON config with all the queries. And then here in our— we'll provide like a huge set of example queries, because we intend osquery to be used not just for forensics or for like incident response, but for things like policy enforcement, various IT tasks, knowing what kind of homebrew packages they have installed on a host, the performance of various binaries on a host. So you could imagine one query would be looking at processes where their CPU time, or their user CPU time, or their system CPU time is vastly larger than everything else. So it's like a high-performing process. Processes that have lots of memory, right? So now you can inventory processes that are kind of like acting out across the enterprise. So then we would have a query set specific for those who want to monitor process, monitor performance, monitor memory, and then as well as like what we originally designed it for, which is host forensics. So also on this beta site, and this is also just a beta of like the beta site, you can browse all the tables that we support. And see all the columns. And like I said, either, either tonight or tomorrow, all of this data will be filled out. So you get little nice descriptions for each table, what it's doing, what it means, and then what each column in that table means. And it's very small. I apologize. It's actually hard to fit all that data on the screen, so the font size is a little small to begin with too. So to answer your question with a long-winded answer, do we have any default queries? No. We hope to have this portal up as also like a little forum for people to exchange queries that they've found like worked well or detected something. Another good example would be like, hey, there's this new— we use the example of WireLurker. I think we actually have a wiki article on this. New, you know, OS X or Linux malware comes out, has a couple of signatures, like drops a couple files in places. How do you query your enterprise for that? Well, you could push out a query that did that. And so instead of exchanging like, hey, there's these specific launch daemons or these specific processes that I found, you could say like, hey, look for new launch daemons. Here's kind of the the regular expression of— that it uses in, like, the plist name or the binary that it drops. And then, you know, someone could share that query, and then everyone else could benefit from it.
Nice.
Cool. Anomaly detection. So, if you hit the anomaly detection link on our deployment guide, It kind of walks through the logic behind that. So we used WireLurker as a case study and showed you how you could take some of the IOCs that were published by Palo Alto and turn that into a query and then schedule that. I think here's what we came up with. That one was pretty simple. There wasn't too much variance in the names of launch standards that it threw down. But you could, you could see like com.apple. Actually, if your launch daemons don't change very often, so if you schedule SELECT FROM launchd, anything that pops up there after you do your like initial baseline is, is interesting and worth investigating. Cool. So, that's all I had planned for the usage. Any questions about maybe like extending it, what's available, or any requests for what you would like to see inside of osquery? What like sort of types of information you would like to query from your host?
I don't have any of those, but I'm interested in more of deployment. So how many machines are you guys— how's your deployment over at Facebook with this? Is there thousands of machines or X number?
We are not— we are legally obligated to not give any explicit numbers of any deployment.
Sorry about that. Yeah, we can't do that.
No problem.
Okay, it's a lot.
It's not, but I imagine it works with 10,000 machines just fine. I'm just making a guess. Can you answer that?
Yeah, we have. So when we were originally deploying it, the cool— the couple problems that we came up with were like, we had— we were building on, on Mac Pros that were 10.10, and we were deploying it to MacBook Airs, iMacs, everything under the sun, right? And we saw like instruction set problems because the CPUs were different and we were building like heavily optimized backend databases to include in it. And also like the SDKs of the various operating system versions that people have on their laptops. And we've gone through all of that. So we don't have those problems anymore. I think out of our deployment, our entire enterprise, we have like 15 machines that are erroring back right now. So yeah, it works on massive scale with very few exceptions.
I would say one other thing is interestingly enough, once we got past the heartache of deploying to, several hundred machines, the heartache of deploying to several thousand machines was relatively like—
Yeah, it wasn't even there.
Yeah. Didn't exist. There were a few things we ran through when we had a few hundred machines going and we were ironing out the instruction set issues, but once we were scalable enough to deploy to that many hosts, with good design, it was easy to ramp that up by orders of magnitude.
Yep. Okay, cool.
So how we recommend deploying actually will be on this— once this goes to osquery.io, is actually hitting this downloads. And actually deploying to an enterprise with Brew is a pain in the butt because everyone that you want to deploy to has to have Brew installed. That's a very hard requirement. I wouldn't ask anyone to do that. So, it's to grab these packages here. Grab the package, and then, you know, find some other way. Here's, like, an amorphous— find some other way to deploy the config out, right? If you don't have, like, another way to deploy the config, like, if you're not using, like, M Collective, Puppet, Chef, any of those, then build the package with the config using that makeosxpackage.sh that we have. Similarly, for RPMs and DEBs, we're going to have repos. These actually will work right now, so if you're, if you're copying the text that I have on my screen and you want to add them, that would be the best way. Deploy out a new— either push out a DEB into an internal repo that you have, or add our key server plus our app targets. And we give you a couple of, what do you call it, assurances that all of these are built and tested on those targets beforehand. And we've looked at every single table and made sure none of them have memory leaks. There's one table that has memory leaks, but it's It's whatever. Choose your own adventure. Yeah, it's a choose your own adventure one. But, and we also take a look at the performance for each, too, and we measure performance across memory, how long did it take, how much CPU utilization, the number of file descriptors did it create, and we make sure all of those stay at an acceptable level.
Yeah, keep in mind the standard that we try to hold ourselves to is, will, is this suitable from a performance perspective? Is this suitable to run on Facebook production? Hardware. So like newsfeed can't go down because we shipped some bad code or something. So we put a lot of effort into like automated tooling and manual testing to make sure that we don't introduce regressions that could significantly negatively influence the performance of the machines that you've deployed a query to.
Yeah, yeah. And then we have Inside CMake, which is how we build for both OS X and Linux, and how we will build for Windows once we support that, we have static analysis stuff using Clang's Analyze as well as Cppcheck and the Sanitize frameworks that they— that LLVM and Clang support too. So, we're also checking for— we're making sure everything passes all the C++ static analysis and we are building with like ASan and MemSan and Leaksan and then, you know, fuzzing that to the best of our ability.
Cool.
Does that help? Does that help? You have deployment questions?
Yeah, one more, just in case, just to make it clear. So you have a client-server, or you can have a client-server architecture where when you do the queries on the deployment server, it queries all the client systems and the logs end up in /var/log/osquery as JSON data. Is that correct?
Somewhat. We don't have the client-server model right now. Every client has its own osqueryd, and then you have to collect the logs yourself using like some, you know, some SIEM. Okay. We are working on a client-server model where you could have some service on your enterprise issue queries and collect the results right back.
Okay, so right now the logs will be on each individual host?
Yes, by default. Similarly, to have a config plugin architecture allowed you to get your JSON from either disk or an HTTP endpoint or what have you. The logging architecture is similar in the sense that if you wanna log a specific string somewhere, all you have to do is implement a function that logs a string to where you want it to go, and then the osquery framework will take care of organizing logging to that. So if you want to log to Kafka or something, 'cause you're fancy, then you could just write a quick plugin that logs the string to Kafka, to your specified namespace, and Bob's your uncle.
Yeah.
So, it's pretty—
Right.
So, here's kind of the extent of the file system logger. And, of course, because we're at Facebook, we use Thrift as our kind of like SDK extension API. So you can write any— we have our Thrift, our .thrift file in the source. You can write anything in any language. If it conforms to our— if it uses our Thrift API, then you don't have to build your plugin directly in C++ and build it with osquery. You could write it in Python and then call our API. We don't advise doing that right now. If there is something like— if there's like Mike said, Kafka or ZooKeeper that you want to log to or take configs from, that's probably in our pipeline, so talk to us first. We'll probably be developing some core module for that, some core plugin to support that.
Cool.
Any other questions?
Anybody remote, you guys have any questions? If you do, you can unmute yourself and ask and then mute yourself again. All right, looks like—
Yeah, I'm looking at the chat. Oh, if you guys— Okay.
Cool, cool.
And you can email me anytime. It's reed@fb.com for feature requests or anything. We use GitHub very extensively, so if you— for feature requests, questions, requests for comments, bug reports, any of that, issues in GitHub are our best way. To work. If you do send emails and they're pretty relevant to the development, we'll probably just create a GitHub issue to work on it. Very good.
Thanks, Shane.
Cool.
Well, that's everything. Thank you so much for letting us talk about osquery. This is awesome. I hope you guys all—
It's really cool.
We're definitely going to try to apply it to our lab when we get that finished, for sure.
Perfect.
And thank you for donating your time, uh, Ted and Mike. I appreciate it. Yeah, we just, uh, and then, uh, maybe we'll have you out again if you're interested for something else.
Cool, cool. Thank you, guys. Well, everyone have a good night. See you later.
Thank you.
Yeah, thank you very much.
More from Jon


What No One Knows the Podcast / Vodcast featuring The Tampa Bay Wave and Jon Schipp

Meeting the Exposure Management Challenge: Key Use Cases for Success | @OfficialRapid7 #SolutionSpotlight

Spot Security Control Gaps and Non-Compliant Resources Across Your Attack Surface






