OpenNSM (Rsyslog Logging Infrastructure - Jon Schipp)
Jon Schipp walks through ArcSyslog, a logging infrastructure used at NCSA that handles up to 80,000 logs per second. The system uses RELP for reliable transport, CARP for redundancy, and feeds into Splunk and OSSEC for analysis. He covers rsyslog configuration, module loading, and performance benchmarks.
Chapters
Alright, so let's get started here. Alright, again, this is another OpenNSM meeting, a weekly network security monitoring group where we talk about network security monitoring, forensics, incident response, and other related things. First things first, the group updates. We have— we're looking for sponsors right now. I talked to ACM and it seems like we can get those. So if any companies are interested or persons are interested in donating hardware, software, or anything that could be of use to us, including monetary donations that we could apply for hardware or software, let us know. We could actually review the products and place them on our website and talk about them in our meetings, as well as you might be— depending on how much you donate, you might be able to get a banner on the ACM website and access to the resume book. So we'll go right into the meeting sections. So it's been a busy week for me. I was out of town on vacation in Chicago, so we don't have a whole lot here, but there was the Ghost vulnerability, and there's two links there including the CVE that you can find more information about it. And it was a vulnerability in the GNU libc library, libc. There was a function in the older deprecated host get host by name function that has been superseded by the get address info, I think, that which allows you to use IPv6. So this is an older one that does not allow you to use that. And there's a helper function included with that function. Once that function is called, it calls like __nss_hostname something, and that was subject to a potential overflow attack. So in this particular case, the user would have to have a— be able to supply a string to that function. So it must have been cases where the application takes arguments to do a name resolution and then potentially you could overflow that. Of course, a lot of numbers, a number of systems or popular pieces of software are vulnerable to it, including OpenSSH, but in those cases you're not actually passing those strings directly. So there's not a whole lot to worry about. Also, Suricata 2.1 Beta 3 was released and it has a Modbus protocol analyzer. So you can do SCADA stuff with that if you would like. That summarizes the NSM in the news section. So now we're gonna go to the challenge corner. So there was the SANS Holiday Hacking Challenge that happens every year and put on by Ed Skoudis and a few others and Josh Wright's one of them. And it gives you a scenario and a storyline that has a bunch of clues in it that you can then You can read and get a little more detail about the scenario and then we can go from there. They provide a number of files. Put it on the very bottom here. Right here. And IP addresses that you can use to actually solve the problems. This one they give you a website and tell you can access port 80 and port 443. They also give you a USB file system image. And then the idea here is that you solve all the challenges, you write a report on it and you return it to them. And then there's prizes available for people that solve them all. And then also based on— well, they have the criteria right there. Best overall answer, best technical, most creative, etc. So my boss, Warren Raquel, actually sent us his— what he did to solve some of the solutions. And we're gonna pull that out in just a moment here. So if you wanna take a look at it, it's in our repository, opennsim-meetings on GitHub. And we're gonna go ahead and unzip the holiday challenge here. And then we're gonna go into the report directory and we're gonna open up and begin with engagement1.html. And let's increase the size here. So this is a pen test example. And so they were given a system, this IP address, and they said, hey, what is the secret on this system? Well, So you have to figure out what's available in the system first, so you just do some reconnaissance. In this particular case, um, one of us, Nmap, and to scan the system for ports that were open. He found that there was two here, this strange one, 31124, and SSH. And he said that the SSH did not return anything that was obvious to use to exploit the system, so he went with 31124, which is a good idea.. And it turns out that this was some linguistics or natural processing programming language demon listening. And she just kind of interacted. It says, hey, I am Elisa. What's on your mind? And he typed in secret and it gave him some information. He typed it again and eventually he typed visit in a URL. This particular URL was probably his URL to his service. And then the actual demon actually connected to that service. So he was able to verify it. Using his logs, his HTTPD logs, and he found this Mozilla 5 user agent string with this, and the actual secret was in this text right here, a quote by Alan Turing. And that's how we solved that problem. So let's go on. So he had to play around with it and see how the program responded.
What made him think to do that?
I don't know. It's probably something with the actual story outline. It probably gave you clues in there. So I imagine that's— I haven't read that, but we're just gonna going over at a high level what he did. The second one was another pen test engagement. And in this one, he was given the domain, uh, screwjammarley.com and the port. So in the actual outline, it said, hey, you can connect to this on 8443. He used it to obtain the certificate using the OpenSSL client program. And he noticed that there was really nothing interesting in here. So what he then did next was was that he tried Heartbleed since that was something recent, so there's a good chance they put that in there. So he used, he grabbed the tool found on GitHub, just any, there's a few proof of concept tools out there, and he tried this one and it actually looks like it was able to pull out data from memory that the SSL library was located. So in this particular case, he saw the actual secret here, website, and then the URL encoded 20% for a space, etc. And he used that, which he decodes it right here, and that was the next challenge answer. Then on the website, he spidered it and found that there was some PNGs and MP3s. He opened up the MP3 in Adobe Audition, was looking for something interesting, maybe something hidden, but did not find anything. And as well, he used ExifTool on the PNGs looking for other useful information and did not find anything. So then what happened was he noticed that using Burp Suite, the spidering tool Burp Suite, that there was a CGI bin directory, there was a submit.sh file. So from that he turned on the proxy intercept tool to actually be able to communicate directly with the server and filled out in the header, in the user agent string of the header, a Bash shellshock vulnerability example to exploit. And then he found, so he did that, he tried that, and then of course that's, he's not gonna really see anything with that. But what he did next was use that to talk to his servers. So he used Bash's method of using sockets, which is using a pseudo device called /dev/tcp, and echo text in there to one of his servers and then check on his server to see if there was a response. And it turns out there was. So in that particular case, it was vulnerable to Shellshock. And then, let's see what else did he do. So he used that same vulnerability to actually get a reverse shell from Bash, right, just using the redirection of file descriptors. And from there, he was able to look around. He did not find any common commands, like ls wasn't there, cat wasn't there, like most of the bin tools were not there. But it was a Bash shell, so he was able to use built-ins like cd and fo. And then he used this command in particular to actually see what was in the file secret, which he noticed while playing around. You can see that root of the disk, the file system here, he used echo to list everything, and it turns out there's a secret file here. And it turns out that secret file, when opened, yields website secret 2, use your skills for good, and that was the actual solution for that example. And then finally, the last one was a forensics engagement. And this particular one, there was a USB file system disk image that they had that you could play with, that you could analyze. And so he used tools of the Sleuth Kit, FLS, which allows you to look at, use common files to navigate through the file system like ls and stuff. He used that to actually view the files in the file system, so here he is using FLS. And on the actual image listing the files there. And up here he talks about how he found a number of programs like a document, here's a letter from Jack to Chuck Doc, and there is a secret text property in that one, so he got a few secrets there. But to go back into the actual analysis, then he used EICAT, which allows you to view the contents of a file based on their inode. And in that particular case, he was able to use these the inodes to actually get the resulting files from it. And then he examined each one in detail. Here's the letter from Jack to Chuck, and he found that using strings, the USB secret was listed in there. And then again, there was a pcapng file, and in this particular one, he used tshark to actually grab the, and so tshark in the expert info, it actually has some stuff that aren't in the packet. Well, actually in this particular case, I guess it's in the pcapng format 'cause it can store these, but it allows you to view comments. So in this particular, someone added a comment to the frame section and he was able to use the option of tshark just to print those. So -e frame number right here on the left and .comments so that you can actually see the comments that were added to the pcapndu file for a particular frame. And then inside that comment there was a USB, or a secret as well, and that's how we solved that one. And wrapping up here, there was an encrypted zip file and he threw it against Jon the Ripper and Password Recovery Toolkit from AccessData. He actually got the password, which was shambolic, using the AccessData tool. And so that actually resulted in a bad curtains.png file. He said running Xiftool against that file yielded this particular secret. And finally, there was a JavaScript program and he hid it inside the JPEG. And he would use this Java tool to pull it out. And the resulting secret which was in that report was Tiny Tim has died and then USB secret number 4. So he achieved that one as well. Alright, that summarizes the challenge quarter. If you want to look at those in more detail, they are in the repository. And you can just go here, github.com/opennsm/meetings, and then you go to 0202. 2015, then it's in that directory and you can download it. At this point, we don't have anything else for these 3 sessions. We're going to hand it over to Shane and Shane is going to talk about his—
I'm going to need a minute.
Okay, Shane needs just a moment here. We'll let him do that.
I got bumped off the network.
He's been playing around with ScaPy a little bit and just kind of wants to share what he's been working on.
Yeah, I just got bumped off the network, so—
Not a problem. I got bumped off the network, so— Just give it a moment. Well, in the meantime, if anybody has any ideas for future talks or would like to give a presentation themselves, or even not even a presentation, just simply show us a new tool, some command line options, show us your research or research that you've read about. If you've read an academic paper and you think it's interesting, it fits with this group, and would like to talk about it in 5 to 10 minutes, that's great. Just let us know. We're willing to accept anything, and this group really derives upon user contributions. The more that people contribute, the more information we'll have for everybody to learn from. And then finally, after Shane's talk, we'll have a talk that I'll be doing on using ArcSys log in a logging infrastructure setting. And these videos are all recorded and placed online. So we have a YouTube account and we have a Vimeo account, and I will upload those tonight probably, or How much time I have?
Okay, I need you to release the screen, I think.
Okay, let me see here, um. Okay, and then stop sharing. Okay. Also, if anybody has any questions, you can unmute yourself, but once you ask the question, do mute yourself again. You can do this while we are presenting, so feel free to chime in.
Okay, everybody see this?
There, let's minimize this one, or the best we can. Looks good, Shane.
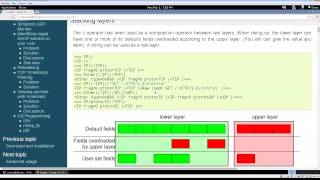
So everybody can see the Start and Escape page? Okay, so like Jon was saying, I've really just been kind of playing around with this a little bit, so this is not quite up to the Jon Schipp level of depth when it comes to exploring a tool, but I thought it was kind of neat. There's some fun stuff to do here, and I kind of just threw together a a little parser for an extra credit project for one of my classes. Somebody had pointed me in this direction. The assignment was just to parse through a pcap and pull out all the TCP traffic. And so I did some Googling and found this Scapy, which is basically just a library of Python. And it's pretty easy to get it installed. There's some stuff online, plenty of places online that will help you do that. And it can either be run as they're showing here as a command line interface, or you can put together scripts pretty much in the same way that you can with Python. So this is kind of a cool little tutorial. I'm not gonna actually type it out and go through, but this just shows that with Scapy you can actually just build a packet by hand. Like that. It's pretty self-explanatory. You can also stack layers like this. I haven't messed with that too much. Reading PCAP files, this is where I came in, and it's pretty simple as long as you point to the PCAP file and you can just store it into a variable. And then something I thought was neat, I haven't messed with this either yet though, but You can pull that, the packet apart and it will create a bunch of these PDFs or PNG files that just take the packet and highlight everything, which is I think a really cool learning tool for, okay, this is the actual data that's in this packet and this is how this gets broken down and this is, it gives a real graphical look at just a package is taken apart.. It shows you what every little bit means and where to look for, you know, what version it is or what the protocol is or anything like that that you want to know, the destination port, the source port, anything like that, or the source MAC, anything like that. You're going to find in which part of the packet that exists in. And here we find some more commands that can be used from ScaPy. It's a pretty powerful set of tools here. I haven't scratched the surface hardly, but let me show you what I did do, which is over here. Like I said, this is really simple, so don't laugh at me. Alright, so I've written this little parser, I call it Snippy. I've got a couple of files in here. This one has no TCP traffic in it at all, and that's a pcap, and then I have this other pcap here which has quite a lot of pcap traffic, or quite a lot of TCP traffic, sorry. So if I just go like this and run like that, it will tell me that it opened it, tell me that it didn't find any TCP traffic, and then it will, you can see, it will show that it created this sniffy output text and there's nothing in it. We can see that right here. If I cat that, it will just print nothing at all. But if I run that same command again, this time with this larger packet, Then it's going to open it and it's going to tell me that it wrote it to that file. And we see there's quite a bit of information in there now. Let me see if I can open that up in a way that's going to be easy to read.
I think I've got—
here we go. And so what it's done here is it's— I've had it label each packet by number and it shows Ethernet address, IP, destination, source. It breaks it down in a pretty similar way to what the graphical one did. It just tells you every information that's there. Also, let me see if I can find a good example. I got one coming up here. If it's available, it will also give me the raw data that was transferred, right? So we can see if the packet capture has the data, then it will pull that out too and then show that to me. Anyway, that's about it from this packet. I can show you the actual code and just show you how easy, how simple it is. Just walk you through that real quick. OK, so I just import sys. I import logging. And the reason I do this is because it was throwing some throwing some kind of warnings at me that I didn't like, so I get rid of it. And then we just import scapyall. We, yeah, we import everything from scapyall. And then I check to make sure that they gave me a pcap file to actually do anything with, and then here's like the little help section where if somebody doesn't know how to use it, they can find that. And then I kind of just, this is where I just kind of print out, hey, this is what I'm doing, and this is where I open up the standard output in there. Here is basically the heart and soul of the thing, which is not much, not a whole lot of lines there. We just have for every packet in this packets that I assigned up here as that pcap capture, go through and iterate by 1 and then just break it down and print out all the data that you have on it. And then down here is the main function where I just print out, hey, I did that. So that's about it. Does anybody have any questions? Looks good. No, I might look at some other aspects of this and then come back with some more information. I'd like to see what it looks like when we do pull apart some stuff and look at some of those graphical— those PNGs. In PDFs and what some of that stuff looks like.
Yeah, I'd love to see more of this KB Sprinkle tool.
Yeah, and like I said, like you saw, it was about, what, a dozen lines of code or something? And it parsed through that whole thing.
And most of them were your print statements.
Right, yeah, exactly. So I mean, it's clearly pretty powerful. And it did it really quick. You can see right there that that's a pretty big PCAP. And it pulled it apart pretty quick. We didn't really have to wait for it. Do anything. So I like it. I will play with it some more, and that's all I got.
Alright, thank you for sharing. Stuff. Alright, go back to screen sharing now for me. Okay, and then we're gonna jump into my talk on logging infrastructure with ArcSys Log. So I'm not an ArcSys Log expert or anything. I just, I helped design the ArcSyslog infrastructure at the NCSA and we're just gonna give you a brief overview of what that is like and what it does and some examples of the configurations. So first I'd like to talk about ArcSyslog a little bit. So ArcSyslog is a very powerful syslog daemon. And it's different from syslog-ng, which is also a powerful one from Bailabit. But one thing that I didn't— that I find a little bit problematic for the open source culture that I live in at the NCSA is that they actually— to get a lot of the features in syslog-ng, you have to pay for the commercial product. And they do have a nice syslog-ng daemon it's free and open source, but they have the commercial product as well, and that gives you the advanced features like reliable logging and such. But in the case of ArcSys Log, those are all free and open and available to anyone. So I always choose— that's primarily my reason for choosing ArcSys Log. That and they have RHEL. RHEL is a protocol that Rainer, the author of ArcSys Log, helped develop, or developed himself actually. I'm not really sure how many people were involved with that, but it's a reliable event logging protocol. And it takes the idea of reliable TCP connections and adds one layer on top that allows you to do things where, like in the case of TCP, where a connection is aborted and there's not tracked between, like, if there's a last message sent or there's a bunch of outstanding messages that were not acknowledged, those are lost. Those are lost. And there's nothing you can do about it. So, and that's what RELF was designed to actually help facilitate a way to keep track of all those. So actually the receiver actually keeps a counter of everything and talks to the server of all the logs that it has and logs that it yet needs. So it's a better way to handle this particular point if you need really reliable logging like you do in, say, in the financial sector, etc. So we actually in our organization, if you can if you can manage to install the RHEL plugins, then in ArcSys Log, we recommend that and then TCP and then UDP in that particular order. And with UDP, of course, it's a lossy protocol. It relies upon the application to handle that loss. In other particular cases, logs, if they do not make it to the destination, they are simply not resent. So it's always— it's typically better if you're in an environment where you can use TCP. You need to have better quality of reliance on getting the logs to the destination to use that or even further again to use REL if the system or the software you use actually supports it. And our, our ArcSysLog has been redesigned or it's actually made a long stride now where it's actually not using the older format of simple statements with a dollar sign prepended to them in the configuration file. Now it has a support for what's called RangerScript and it's a scripting-like It has a scripting-like feel to it where you can do conditionals and such, and then based on the condition, you can actually use an action, and the action may be to log to a file or send to a remote system, etc. So we'll be talking about our syslog and how we use it to do these things. And to begin with, let's take a look at our infrastructure here. I have a diagram. It shows at the top— so in the top one, that part there was redundancy. I want to focus on What happens if the central place goes down? Well, we have it designed in a way that here, all the clients, anywhere, wherever they are, on our network, on different networks, they forward to an IP address that is clustered using CARP, which is a protocol, Common Address Redundancy Protocol, developed by the OpenBSD team to allow you to share a common IP address to provide some sort of failover. And in this particular case, we use pfSense routers they have CARP enabled, so then what actually happens is the logs will get sent to either the Load Balancer 1 or the Load Balancer 2, depending on which one is up. And then what actually happens is those logs get forwarded to our two relay boxes, Relay 1 and Relay 2. And from here, the relays, depending on which relay is up, so this is pretty awesome, it adds another level of redundancy right here. So if Relay 2 goes down, logs will then be forwarded to Relay 1 because the pfSense, we have a failover that actually checks to see if the port is still open on that host. And it will send it to the appropriate one. So in that particular case, once it hits the relay, the logs are then forwarded to a storage system for retention, an indexer, in this case we use Splunk, and then also an analysis machine, which in our case we're using OSSEC and SCC, the Simple Event Correlator, and soon to be we're gonna integrate Sagan in there. To actually have multiple tools that are complementary to do analysis on our logs. So that's our architecture right now. And you can actually go to this website, link's at the top, sigmyst.net. I'll just go ahead and paste it in the chat, but this allows you to, you can actually see the article and view the details of our current configuration. And we'll see here, where's the chat? I guess I moved it off the screen. Oh, I'll just paste it in there later. So anyways, let's go ahead and move to the boxes. So here I'm on Relay 01, and this is the first relay. So after the logs hit our load balancer system, they end up at Relay 01 if everything is working. That is, if Relay 02 is not down— or if Relay 01 is not down. And then from here we have the rsyslog configuration. What we have is using the Rainer syntax, the Rainer script stuff. We have— we use the new syntax that says, hey, you can load modules in this particular way. So we load the TCP module, the UDP module, and then the RELP module, which is our event logging protocol. In this particular one, if you want to send RELP you actually need to load omrelf for output module RELF. If you want to receive RELF, then you need to load relf module for input module RELF. Is it default? Huh? Is it default? RELF is not enabled or even installed by default in all of the package systems for different distributions. So it actually brings up a good point that I need to touch upon is that if you want to have these features, a lot of the time you'll actually have to go out and compile it from source yourself or maybe they have a package, a PPA in the case of Ubuntu, maybe they're running their own repositories that you can pull from. And they do with the Red Hat systems and CentOS, you can actually use their repositories. You can Google it on their website. You can do the same thing with Ubuntu. So in those two cases, you just add theirs and then you can actually install additional modules. And another one that's really nice is impstats. And this is just a stats module. It basically, every queue that you have our syslog will generate stats at a particular time. And here's every 5 minutes, or so 300 seconds right here. I'll write it out to the stats file so that I can then use other tools to graph the data and take a look at if we lost packets or we lost log messages or we can infer the amount that were queued, which ones are going to which queue. You can do all kinds of analytics on that. And then what we do here with module parameters is we can actually say for the particular module input RELP, we can actually bind it to this particular port. And you cannot have RELP and TCP on the same port, so be wary of that. They need two separate sockets, two different services. So you'll have to use a different port, and 1514 is a common other one to use. And then from there, we actually run down into the rule sets. And, and our syslog has this idea of rule sets. You can actually take, assign logs from a particular source to a rule set.. And in this, any log that is attached to the remote rule so that it receives it, because this is where really all it is, really, is anything it actually receives, we actually forward it using this action right here to a particular system of ours. So what we do here is we forward it to our analysis system. It's just a name, it could be anything. And we give it the target IP address, the port to connect to it on, etc. And what we do is we end up using this queuing system. So our syslog has the ability to provide queues. It can do in-memory queues and disk-assisted queues. So it's important to do disk-assisted queues, especially if you go to a protocol like RELF. What actually happens is if there's a case where the syslog, the rsyslog daemon goes down on a particular client system and needs to send logs, well, from the example of SSH, it will try to write a log every time someone connects. And what actually happens if it goes down, you'll end up blocking that call. So it'll wait and wait, and eventually after enough waiting period, it will actually cause your system to become unresponsive. So this is a bad case of lock. And so a way to mitigate this is to use disk assist queue. So if the memory fills of logs that need to be sent, you add a certain threshold, in this case 1 megabyte of memory, you actually write it out to a file. Yes, Jay?
Stepping backwards in a second, did you say that you can't pass RELP and TCP traffic over the same port?
Right, you're going to have to bind it to a different one.
Is it because RELP is— is using TCP protocol?
Yeah, RELP is. That's exactly right. It is using TCP underneath. Okay. This adds a higher level of control over, above that. So to do this, to fix this particular case of lock, of locking, you would use a disk space queue. So that if the system ever goes down or ArcSyslog ever fails or cannot send to the particular destination, it'll write to a file. And you can see that on shutdown, this one says go ahead and log the state of memory to the queue, the disk assist queue, and then you give it a file name. So any file labeled analysis-stack-buffer in the disk assist queue on the system, the system goes down. And then of course you can set the resume interval and the retry, continuously retry until, and send logs if the system comes back up. And otherwise, you back off for 30 minutes. So we do this for all our— that we're sending to for the storage system, the analysis system, and the indexer. And then those machines will then do particular things with those logs. So let's take a look at— I have an example of the disk assist queue here. So it's just a file. This is what we had. A Splunk system went down at one time, and we have this queue file here. So you can see that just— it asks you to take the following line and open it. And you can just see actually each log in detail. So this is what it writes. It fills up the memory at a megabyte in our system because we have it configured that it will then write all the logs to disk until it can send them out. And you can see it's got the severity, the facility, etc., and the actual log message and where it needs to go, where it came from, etc. So this is just a large file of logs that needed to be sent out. Particular point in time, and once the system comes back, we'll resend them. So that's an example of that. From there, let's go to the analysis system. The analysis system is the one that we use that does the analysis of logs and runs the signatures against them, you could say. In this particular case, a lot of it is set up the same way except here we have the rules. We're only— we of course want to firewall this off to only allow this logs from the relay because their sole purpose is just to forward to these systems. And then what we wanna do is we wanna take those logs and do something with them. So there's a few ways to do it. You can actually pipe it directly to the binary. So in this particular case, I have this comment out. We're not doing it at this point. But it will actually send it to the SimpleEventCorrelator with these options in that way if they match the condition. In this particular case, though, this is how we're doing it now. We actually write it directly to disk into this directory called logs to analyze and put them in a file called all.log. And then anything that comes from the relays which matches these two IP addresses will then get put there and all actions are stopped after. So every time we log in, a log comes in, every single log comes in, this will be generated. And we can actually take a look at this and see if I have— yeah, I don't have—
let's go ahead.
Here are all the logs coming in live right now. And what we can do is we can do a quick count, I suppose, uh, see timeouts. Oops, can't type. All right. We'll do 1 minute and then we'll do tail all.log and we'll just do wsl. This will give me the number of logs that came in for the particular minute. And when that's done, we'll see— we'll have a graph we're going to show you later. So what ends up happening is that this goes to this all.log file, which then OSSEC, a host intrusion detection system analysis tool, actually reads from and runs the signatures on every log that comes in. And the same thing with this simple event correlator. It will also read from this file and then run its signatures or the process that we have, we've built custom in-house to actually go through those logs and analyze those as well. So from here, then we have the file system, well, You don't count the index. We all know that what the indexer does is it will actually do quick queries after indexing it. So we're gonna take a look at the long-term storage system and show you what that looks like. So what we do here is we actually have the ability to do what are so-called templates. So we write your logs out in a certain format. And we actually have a template called by host. It uses strings and for the name in this particular case. So it's gonna actually create logs for every host that it sees. It's gonna be put into the year that it would receive, the month, the day, the hostname, and then that data again in a nice format that is easily grepable using grep recursively or something like that. So you can just drill down the month, the date, etc., how far you wanna go. In this particular case, what it ends up looking like So here's February and let's look at the second. And you can see there's a lot of logs here. You can just do this to go ahead and— there are a lot of files here actually. So these are all individual files from a number of systems. Let's do it, uh, yeah, so there's a number of systems sending logs, each dated to the hour. They all go in their appropriate box. That's a way to nicely organize the logs, providing you do this templates that rsyslog provides. In this case, so that completed. In the last minute, we actually had 14,000 messages come in. Which is nice. Not a big number because, of course, everybody's off work now. There's not a whole lot going on. So now let's move over to the actual data section. Let's go back to this actually. So we're going to go back to the— take a look at the imp_stats. That's not what I wanted. I wanted to do imp_stats and then— so this is that module I told you that might have a stat every 5 minutes because we have it set that way. And you can see— let's go ahead and use ls -s so we can scroll. Here we go.. And it does it per queue. So we have the analysis queue. So every machine forwards to— has a particular queue. And you can see how many logs were sent to it, how many were dropped, etc. How many were processed from the core. You can see this— how many were processed at this particular point in time. Then here, again, CycloneNet processed 169,000 at that particular interval. And just all this is in detail as you can actually see it. And then of course, if they fail to make the queue, and if they were suspended, etc. It gives you all that information. Discarded is another one that's important. You want to know when you lose logs, right? So in this particular case, they're all zeros at this point, which is good.
What causes them to get discarded? Because they're empty, or—
They get discarded because the queue gets full, or— But in the case where— Say again?
Like dropped packets?
Yeah, it can be. In the TCP case, it's not so much that.. It's more like it's the queue becomes— yeah, it's over the socket, the buffer socket is full. You know what I mean? It has to wait. It has to— yeah. So that's essentially what it comes down to in that particular case. Then, last one I want to talk about. So I want to show you the actual graphs that we're using. So this is the relay system. And we're going to first take a look at eth traffic, the actual network interface. And you can see we're taking in this much and we're going out double or triple, which is, well, every log that comes in will be sent out to each one of the machines with a separate network connection for each one and a separate log for each one of the connections. So we're sending it to 3 different machines at pretty good points, so that should be double or triple, and it looks like it matches up pretty well with the graphs. Then, using the actual imp_stats, we actually parsed to get the fields out of the column, or the fields that we needed for every queue, and you can see organized per queue the number of logs that actually were received.
Can you blow it up a little bit?
Oh yeah, sorry. Blowing it up. Thanks. So at this particular point you can see that these particular machines based on the queue received this many logs. It just varies by day. You can see our high point is above 50,000. And we did some tests using MouseTalon, our mouse tool from the NetStiff Engine Toolkit, and TrapGen. And we were at the point of measurement, we had an area where we could not measure because we couldn't get more granular. But we did it between 80,000— it was more than 80,000 logs per second that we could do without any loss. But it could be up to a larger number, but I could not get the timing setting to go any lower, so it's not clear to me. But we may have to do some further testing in the future. And then finally, this is the number of ArcSys log messages discarded by the queue. You can see we haven't lost anything. And then lastly, This is the number of our submit messages that were actually queued. And in this particular case, we actually had an issue with the load balancer going down. It's just that the system went down and there was a huge queue right here. But of course, those were then relinquished to the appropriate host. So, yeah, for a moment while that system was down, we buffered 2.4 thousand logs. And then finally, with our— so we have a Nagios system where I've written a number of plugins for RSS logs to monitor it and just check on the number of sockets that are on the machine. We're not actually receiving all the logs from like the supercomputer and stuff because there's like 27,000 nodes. And at this point we're actually talking about if we want to receive them all and if we're capable of receiving them all. That's a current ongoing discussion.. But right now there's probably around 500 systems that we're receiving logs from. And there's a few that— I have to count them up, but there are other relay systems that people are sending up from, so the source address is all the same. So there could be some more hidden behind there.
So you're running this over NCSA, is that what you're saying?
Yeah, this is running over NCSA.
So how long do you keep these logs?
There's a few things. We actually keep them on the sec logs for, I believe, 2 weeks. And what ends up happening is that they're actually long-term rotated to an AFS share and locked down from there. And that's— I don't remember what the policy is on that, but it's much longer in case there's an incident and we need to refer back. But that's essentially it.
Because it seems like this would grow pretty fast.
Huh?
This would get expensive fast.
Depends a lot on the log tape as well. You mean the storage and all that? Yeah. Yeah, well, we're actually not doing a whole lot. There's some places that do tons. But we get about, I think it's, I don't know, about 6 gigs of logs a day. So— That's cute. Huh? I said that's cute. What do you guys have? What do you guys have? 300 to 400. Yeah, I figured it's a lot. Now, if we had the supercomputer stuff, it'd be a lot. But we aren't doing that right now. But that's a lot. It depends on the log type for retention too. For example, like NetFlow data, there's so much of that. Like, I think during the semester that expires off in 3 or 4 weeks. Oh, just— are you counting your Bro data in your NetFlow stuff? No. Okay. And so, so even with the Bro data, that's a good example, we're not bringing in all the Bro sources, right? Yeah. So because like you have some duplication rate because, um, certain things to duplicate. So like you have exit firewall logs and you can You could also have session data in Bro. So you have to decide where it makes sense to keep certain things or you could get it other places. Yeah, and see in our case, the logs I'm showing you for these systems, it's only system logs. It's not flow data or anything like that. Any questions? I think that wraps up my talk. It wasn't a very long one tonight. I was just trying to fill in because we didn't have a guest speaker. Slot. So if anybody has any questions, let me know. Unmute yourself, or actually I can probably just go ahead and see what happens.
Feedback, feedback, feedback, feedback. Some people might not want to be unmuted.
Oh, fair enough.
Wait, they have their dog barking in their lap or something.
So if any questions in chat, do post them. Um, I hope that I can help you.
Yeah, I had that question earlier.
I didn't want—
you were on a roll and I was trying to do something at the same time, so I didn't want to interrupt you. But when that, uh, that Christmas Carol contest thing, when was that? Is that an annual thing, or—
yeah, it's in December around Christmas time. Really? They sometimes do random ones as well, like, like random.
Who hosted it? And— oh, really? That was like fun.
There's one out now. It's not fantastic. Yeah, it's pretty cool. Yeah, very topical too. I've been meaning to, but I just haven't.
I just haven't. Sounds like a Louis C.K. joke. It included everything.
But yeah, so again, if anybody wants— does any of those challenges and wants us to talk about your results, we'd love to see them because, uh, definitely see different interesting approaches to different problems. There's multiple ways to, you know, to find solutions for them. So you forward them our way and we'll talk about them. So we do have a guest speaker for next week. I got confirmed today for the guys from Facebook. They're going to be doing a presentation on osquery. So that's cool. And then for the 23rd—
did you say, sorry?
The 23rd, Google's— 2 sessions on Google's Rapid Response Framework. Will be giving a talk as well at OpenNSM. So, give you ones to look out for.
So, people from Facebook and then Google, is that what you said?
Yeah, yeah, so guys that work Facebook and Google. So, that's nice to announce that. And of course, anybody wants to, you know, again, I've sent articles, things, I've been using the news. Simply just send me, forward me an email message if you think of something interesting that I can talk about. You know, any challenges, any new tools, any academic research, any presentation, just let me know and I'll I'll try to get it in here. And this talk will be recorded and up on YouTube and Vimeo later. Thank you, and that concludes the meeting if we don't have any questions. Okay, and do feel free to tweet us at #OpenNSM. We could always use more people involved, getting more people involved. So thank you and take care.
Do we have a Twitter?
More from Jon


What No One Knows the Podcast / Vodcast featuring The Tampa Bay Wave and Jon Schipp

Meeting the Exposure Management Challenge: Key Use Cases for Success | @OfficialRapid7 #SolutionSpotlight

Spot Security Control Gaps and Non-Compliant Resources Across Your Attack Surface






