OpenNSM (SniffyDB)
Jon Schipp's OpenNSM group released Contain NSM for easy NSM tool deployment and Doku, a Docker-based malware analysis system. Shane and Simon presented SniffyDB, a Python tool that parses PCAPs, stores packet metadata in SQL, and visualizes network data with D3.
Chapters
I'm with the Network Security Monitoring Group at the University of Illinois in Urbana-Champaign. We are a weekly NSM DFIR group who have— or basically conduct research projects, tutorials, training, and just kind of overall play and share NSM tips and tricks. So we're gonna move right along. Typically what we do is we go through these meeting notes that we have. It's on GitHub. There's the link above. And for every date, then we just kind of sequentially go down the line and discuss the various points that we have on the agenda. And so the first thing we have are group updates. So one big thing that we've been working on is this new project which we'll talk about later called Contain NSM, basically a Dockerized NSM repo library. And a command line tool to actually utilize them to use the various NSM images, the Docker images that is, to play and tinker around with and kind of experiment with different NSM tools. It makes it really easy to do that. We've just released, I think we're at 0.2 now, that version. I've been working extensively on this the past 3 or 4 weeks, and hopefully we'll be able to release a stable version. We're getting very close. Most of it works, so if you just pull it down and try it out, it should work for you. Moving along, for group updates we also have Doku. Doku is a project that Shane, I, and Wendy have been working on. And essentially what it is, is intended to be a malware analysis system that launches malware from containers, Linux containers and specifically the Docker implementation. And the idea here is if you have fast networks where there's multiple binaries, maybe hundreds or thousands potentially, coming over the network in large enterprises and you have like Cuckoo or something, it's hard to scale the analysis for each, where it's usually one binary that needs to be analyzed per virtual machine. And it takes a lot of time to just spin up virtual machines, tear them down, and pull data off of them. So we're trying to find a way to scale that using containers where typically you can have thousands of containers running on a commodity host concurrently. And this means potentially depending on the binary and the tools that you're using to analyze it, you could run 1,000 instances of some tool to analyze the malware. And essentially we're gonna kind of copy the Cuckoo model but just doing it for, or doing it through Docker Engine. So that's kind of that project. And Shane's also using it for his senior thesis. Moving along, we have sponsorship that came up. There's a company called Draconyx that redesigned our website a few weeks ago. You can take a look at it here. They got it up in a few hours, and now we can kind of hammer out the rest ourselves. Looks a lot better from the basic stuff we had before, which was actually pretty bad. So it's really nice. We're using Jekyll to easily deploy static HTML, generate static HTML from Markdown or other formats. And it actually turns out pretty nicely, and we can host it very cheaply on S3, for example. And final news, or final point of the meeting group, or the group updates, is that we're seeking a student chair. Shane, our student co-chair, he has been with us for a while, since the inception of OpenNSM. He's been a good contributor to the group. And he has— he's now finishing his senior work for the master's program. Is that right, Shane?
No, I'm graduating with a bachelor's a week from Saturday.
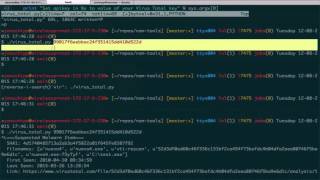
He's graduating with a bachelor's degree in computer science a week from Saturday. And he got an offer from Boeing. So he's going to go work for the defense contractor now in St. Louis. So congrats to him on that. That'll be an exciting place to work, I'm sure. Moving along, we got the meeting sections now. So networking news, where we talk about anything that comes up. New tools, new articles, new protocols. And this week what we got so far is that Suricata released 3.0, the RC2. And this is a release that is a bunch of bug fixes essentially, because it's a release candidate. Also, Snort came out with 2.9.8.0. And I haven't had a chance to play with those two yet. But NetSniffNG came out with 0.6.0 a few weeks ago, and that one I know, if anybody knows anything about the new Snort release, chime in on that, what it has. But NetSniffNG has a bunch of fixes to Flowtop, and Flowtop is a tool that uses libconnectiontracker from the netfilter framework in the kernel, which is what iptables uses to track flows flows and give you a nice graphical view of flows, as well as with the new features includes be able to chart, or I should say to graph the throughput of the flows coming through. Gives you a number of bytes and different metrics that you can pull out. It's a nice tool. They also updated Traefik with some new checksum functionality for IPv6 that actually ends up having a performance increase whenever you're trying to generate dynamic data whenever trying to generate traffic using dynamic data. If you haven't used Traefik Gen, it's actually really, really cool. It's a high-performance, multi-threaded network traffic generator that has this configuration language that supports all kinds of data types, including hex, octal, binary, and ASCII. And you can put these in these code blocks, which I could probably show you real quick if anybody is really interested. Trying to go to the blog here, because I actually— There's an article up on this. So yeah, you can see that Traefgen, you have packet data that can go here and that pretty much defines one packet between the curly braces. If we go down further, you can see the different data types and elements that are allowed to be used in the program. And then here you can actually start building out packets. And here is a packet of all 255 decimal FF hex and it's a bunch of garbage essentially. And the host kernel that it's being sent to, when it's received, will probably drop it. But you can see that this is what it looks like in tcpdump because it actually decoded all the hex. And you can do like use scripts to generate various values and so on and so forth. You can get into more detail with the ASCII, which is a little bit easier to read if you want. So you can generate a packet that just has the text "my packet, my packet" 8 times and so on and so forth. So anyways, really nice tool and they have a C preprocessor that you can pass the data through so that you can replace certain things. So if you know that this particular, at this particular offset there should be an Ethernet field, well here you can actually use this, pass it through the C preprocessor and pull out the type for internet protocol packet. So, and it gets more specific. You can gen— the dynamic stuff I was talking about where they did the improvements is you can do like DRND, do a dynamic generation of 6 bytes for the source MAC address. Here we'll fill out 6 bytes with 0xFF. We set the EtherType field. So here at this point, this is a valid Ethernet 2 frame header anyway. And we generate 64 bytes of random data. You could use this to fuzz different network applications or protocols. So just something to play around with. I'm a big fan of that tool. Moving along, there's nothing in the conference corner today. I didn't actually have the time to look if there's anything, any good conferences coming up. It's the end of the year, so I doubt that. Moving along, Opportunity Outpost is where we usually have contributed job postings. And the NCSA, the National Center for Supercomputing Applications, is looking for a junior analyst. And they're looking for a UIUC student here to work on site a few hours each week to get their hands dirty with some NSM tools and kind of work on correlation between different systems that they have over at the NCSA. And you can email jship@illinois.edu with your resume if you are interested. In addition, we got the Tool Trade. So this is the section where we talk about new tools that have come out. And not specifically new, but things we've heard, maybe we just found out. So I found out about this PyIDS Tools the other day. I came across this. And I don't know if anybody else has heard of it, but it's basically a bunch of Python scripts to actually work with some IDS data such as the Snort Unified 2 logging format. So you can, there's a number of tools in here, there's like 6 right now it looks like. So you can kind of parse and play with. And one cool one is you can do unified 2 files to JSON so you can easily input them into your programs and grab the necessary data from them. So just something to play with. In addition, I wrote some Munin plugins a few weeks ago and I finally put them up online. And this is for OSSEC. I got rsyslog ones if you're interested in using rsyslog to graph your log rate coming in. But for OSSEC, I came up with these. Just general stats by day. So across everything, then your syscheck alerts and your rootcheck alerts. And then we do top group. So this is stats generated by— it's a count of every rule category. So in OSSEC you can have like SSH category, you can have PAM category, authentication failed category, and basically for every rule that's generated, it will graph any alert that happens, it will increment 1 and will grab that data every 5 minutes and graph it up. And here you can see this big drop-off, and we actually had an issue with OSSEC for a while that we didn't notice. That's where the drop-off occurred, and it's clearly explained in the graph that, hey, we lost a bunch of data here, nothing's happening. So it's a good indicator that something's wrong. And the other one I have is you can graph the top rules over time. So the top 10 rules are pulled out, and you can see that in this case, this green line here, which happens to be SSHD authentication failed, that is our topmost hit. For rules that match against our logging data. So it's cool to see this over time. We just kind of got it deployed, so we need to take a step back and just see kind of what it looks like at a larger view, maybe at months or years, and we can just see how things go over time. But one thing that's nice is that I always like, because I'm tuning rules and I want to see a lot less crap coming through there, false positives. Once I implement the rule, a day or two later I can see it on the graph where the line has decreased or dropped off, and that makes me happy. So, 'cause I get visual proof that it worked. Of course you can do other things, but I always like that. And then moving along, NSM Tools, I actually just put up this repo today. I have a lot of scripts I need to put on it that I wrote that are just kinda on different computers, and that allow you to do various things. So I'm working on some stuff to integrate with OSSEC to, Validate your system check file integrity monitor events. So not only, I mean, people having OSSEC agent on all these machines, hundreds of them, etc., will generate an enormous amount of events. So you kind of want to be able to focus your attention to the ones that matter. And sometimes you can't analyze those very well, or at least we want a way to kind of escalate it. And so what we do with Active Response, I have a wrapper built around a few different services such as VirusTotal's API and OS, or Team Chimery's malware hash registry so that when an alert comes in for SysCheck, it spawns an active response script that happens to be one of mine. It will then pull out the hash and try to validate the binary against a public registry. And we wanna do more of this and try to work it with YARA or ClamAV in the future. So it's kind of a cool way to maybe you can escalate events further on that if you're overloaded in emails or your SIEM or whatever. So I can kind of give a quick demo. The documentation here shows you how to use it, but let's go into my terminal here. Dun dun dun. Hopefully that's big enough. And here you can see VirusTotal. I actually wrote this one today. So there's a submit hash to VirusTotal, and then you can see the argument you passed is a hash. And let's, so we got VirusTotal and I need a hash here. I thought I had, yep, here's one right here. This is one I pulled off their website. We're gonna type the hash in here. And you can see that it did return a hit from VirusTotal. Suspected malware item gives you the SHA-1, the filenames that were known to be associated with this hash. You see test.exe is one of them. As well as when it was first seen, last seen, and then a link that your analyst could go to to look up more information about, pretty much giving the entire report for that binary. So, and the other one is the Team Chimera list here. And this one's just a simple shell script. Oops, go back here. If anybody has never, haven't used Team Chimera, all you have to do to make a query is put the hash here, MD5 or SSH-1, and then do a DNS lookup to .malware.hash.chimeri.com. That's literally all you have to do. So I can do the same thing here and dig, and then we'll do short because we don't want a bunch of output. And we can do .hash.malware, or was it chimeri malware, blah, blah, blah, blah. Hash.kymari.com, or is it org? Yep, .com. And say, hey, we wanna look up A records. And that returned 127.0.0.2, which means that it was a valid, it was a valid response, it was a hit. So that means it's a malicious file. So all you have to do in a shell script, for example, is test that the response, or any programming language, the response is 127.0.0.2. Very simple to use. So that's kind of neat. And moving along. Actually, I'm gonna check the chat here. I saw there's a few things going on. Indeed, yes, Tommy mentioned that there is a Bro script that does DNS lookups for the Team Chimera malware hash registry across the network whenever Bro was able to get the hash from files that transfer across the network. Yes, that's a very useful, useful script indeed. And then paper period, sometimes we talk about research when we have it available, and I think Wendy was gonna talk about this thing she was looking at called bluffing network scans.
I can just pull it up here, just give us a brief overview of it.
Okay, I've got some slides. I don't know if you want me to try to set my computer up and stick it in one of somebody else's computer or—
Oh yeah, if you could just— do you have Zoom?
Zoom?
Yeah, if you can just connect to the meeting, then it gets recorded.
Okay.
I can come back to you if you want.
Oh, right, here we go.
If anybody has any questions right now or comments or anything, just feel free to chime in.
Sorry, I'm just installing Zoom.
Okay, no problem.
What we can do is, to not make you feel rushed, is that we can just kind of move along. I can give the demo of container NSM. So, okay, so I talked about the Docker-based image collection for NSM tools that I've been working on. So let's go to the repository for that now. You can see that there is quite a few. So essentially what this comes down to is that In the repository, there are a directory per NSM tool. It's a very simple layout. So in this case, we wanna look at DaemonLogger. We click on DaemonLogger and inside that is a few subdirectories. And each subdirectory, as you can tell, is labeled a version of DaemonLogger. And each of these subdirectories contain a Dockerfile that can be used to build this version of DaemonLogger. And this is the same across all our tools. So going to our repository, let's make it a little bit bigger. I can just do tree, and then we can take a look at some— another tool, nestifng. Very simple layout. Say again? Does someone have a question? Okay, moving along. So in this case, again, we have nestifng, the subdirectories of the versions, and then the Dockerfile. We make it really simple. So everything, a lot of this other crap in here is in my repository only because it's stuff I work on. So don't mind that. Like we don't need this patch, for example. I can get rid of that. It's a little bit more clean. We don't need this run script. Let's move it out of there. But at this point, we have this binary, or this shouldn't say this binary, but this script called container-nsm. And we can run it. This is what allows us to actually utilize all these different versions of these tools. We'll run ./container-nsm. It says there's some missing arguments, so we use dash or help. It wants us to say help. And this is the output. And so I kind of made it like Git and Docker in that you have subcommands, and then each of those subcommands have their own options and arguments. So very, very simple to do. And so I'm using this on OS X. So if you want to try this on OS X, which I know a lot of guys in NSM and then just IT in general use OS X now, you boot to Docker status. You can see that I'm using the boot2docker package. You can download that. It's basically Vagrant plus VirtualBox. Plus a Docker image so that you can run Docker directly on your system with the client installed on OS X's file system. And it basically makes TCP calls to the VM. So I wanna do something. What do I wanna do? Well, first we can try to actually build one of the tools. So that's one option we can do. So we can do continuousm build. And you can see that the argument to build is a directory to the Dockerfile. So I can be like, Hey, let's build passive-dns:1.2.0. And it's going to build that for us. And then when that's finished, we'll have a Docker image with passive-dns:1.2.0. Now these, these are also already built and online via Docker Hub. So instead of building them yourself, you could do docker pull and then opennsm/passive-dns:1.2.0. And then you would have the same image. And you notice it gives you some friendly output. It says, hey, image created. Try this. Well, if you actually want to go inside the container with that version, you could just run— whoops. The new line break got me. Run -i, pass the DNS. Boom. So now I'm inside the container. And container SM gives you some helpful output. It tells you that there was no pcap provided, that you are in this image. That you're in the home directory of the image and that we mounted the directory from the host, that is the repository right here inside the container at that location. And so now I'm in the container and I can run passive DNS. Is it right here? Yep, it's right there. Now I'm sniffing on my eth0 interface. But that's kind of eh. A lot of times I don't want to have to go inside my container to actually run tools. I'd rather be able to run it from my host. And that's where the power of this is. So again, just to reiterate, our goal here is to build as many NSM tools or package up as many NSM tools at various versions into Docker images that anyway, any operating system that can use Docker in the form that it's using can pull them down and utilize them. So if you're for training, all you have to do is, you wanna show somebody some NSM tools or you wanna play with some different versions and you're an analyst, all you have to do is pull down this repository, have Docker installed, and then all of this stuff is at your fingertips. No more do you have to go to apt-get install a package or even find a package. Because in a lot of cases, these tools are not— there's not packages available for them. And it makes it very hard to find and to compile and whatnot to find out how to do that. Because a lot of time there's not good installation documentation on it. So that's kind of the goal that we're solving. So we can do— we can run passive DNS. Let's use the run option. Remember from the menu, if you take a look here, run. Create a container from an image. So this will create a container. And you can see here that the run or group run option, these are the options available to that subcommand. And I try to make it very tcpdump-like so it's familiar to most people. So we do containerdsm run and we say, hey, I want to run passive-dns. We just give it the image name and the version if we want, 1.2.0. If you don't give it the version, it does the latest one. And then we'll say, hey, I want to pass the -r option which says, hey, we're going to be able to read in a file from the host and place it inside the container. So what I'm going to do is we have to use absolute paths. So I'm just going to say, hey, I'm in the directory I'm currently in, we're going to expand that and just do test.pcap. I have a file here called test.pcap. And we want to go through test.pcap with passive-dns. So then what we do is we run passive-dns. Anything passed after the double dash is passed to the container. So it can be whatever you want. You can just run ls if you want. It'll go in the container, it'll exit. If you want to run hostname or whatever other Unix command you want to run, it will say the hostname is passive_dns, etc. So what we're going to do now is, now you can see that you're passing stuff directly to the container and then it exits. You're going to use passive_dns. We'll say -h to figure out how we can use it. Maybe you haven't used it before. And you're going to say, well, I have a pcap file I want to read, so let's find the option for reading a pcap file. Well, it's -r. -r. And then I'm gonna use test.pcap right here. And whenever you use the -r option, it automatically mounts it into the appropriate place so that you can just pass this without the full path. And we're gonna run it. And you can see that it actually ran through it, but this particular pcap did not have any DNS information. If you look at it, there's just some multicast stuff and that's about it. So do we have another pcap available here in my directory? If not, we can use— see if I got my history— yes, this other one I have in my home directory called pcaps. It has a nitroba.pcap. It's a pcap that has malicious content in it. Let's run passive DNS through that as well as log the data to my current directory. And you can see that now we have a bunch of data that it was able to find packets, UDP and TCP for DNS. And then now we have a dns.log file that we can then go in and take a look at directly on the host. Don't even have to go inside the container really. So that's kind of the power of it. And it's kind of fun when you get into, let's do speedometer. So like the graphical tool, I want to do more graphical tools because it's fun. And I kind of see this in the future if I'm on a host that has Docker installed and I just kind of graph network throughput or something. I don't want to install any packages and already have Docker available. I can just kind of attach this, you know, download the clone the repository and run the various tools that do the bandwidth throughput graphing, etc. And the speedometer is one that does that. And you can pass the -i option, which will mount. So if you're on a physical Linux server and use the -i, what happens is it mount— it takes the namespace where eth0 is, the actual physical interfaces or whatever, how many you have, and puts them into the container so that you can then sniff on your physical interfaces from the container. So here we can do dash dash, um, spedometer and -rx, and then I think we'll specify interface eth0. And now there's no traffic going on in this, on this one. Let's see if we can, see if we can, it's a Python script, so that's why I Ctrl+C and got that issue. We'll just do this, don't worry about that, it's just the nature of the tool if you did it on the, there we go. So now I took the network settings off and just used the ones that were from Vagrant, and you can see that it's doing a little bit of graphing here, not a whole lot. But we could probably generate some stuff since we're in this window. Let's just tell it to pull down. We'll tell it to pull down another image. Docker pull, I don't know, CentOS maybe. See if it finds that. And we should see some growth of network traffic. While that's working, I want to mention a few things. So for Snort and Suricata and other programs that require some sort of detailed configuration, we don't have that done yet, and that's something that's going to be done soon. We want to be able to take a rule set and takes a custom configuration file and automatically inserts it into the appropriate places inside the VM. So wherever the Snort configuration directory would be, for example, to have snort.conf and then put the rules in the appropriate directories. All the other tools that don't require a detailed configuration like that work right now. So another thing we're going to probably do is we want to have a user-contributed repository where anybody can contribute their own Snort rules, their own configurations for different versions since we have so many different versions of these tools. And this will allow us, one second here, now we'll get the traffic, I suspect here. Yes, there it is. So now we reattached the physical interface, which because we're downloading, pulling down CentOS, you can see that we're definitely, now we're seeing more throughput inside the container from the host. Anyway, so that's just like a quick demonstration of it. But anyways, yeah, so we would like to have another repository, maybe like container NSM. Extra or contrib where people can then throw in their stuff that pretty much work with our existing container SIEM stuff and then we can just kind of pull it in. You can read it, maybe -c to read in a Snort config or Suricata or something. We'll kind of work out the kinks for that, but that'll quickly allow us to read in pcaps and run them across a rule set. So I think that'd be really handy and useful, not just only for training, but for just practicing stuff on your host and just tinkering around. You can't always tinker around with stuff in VM— well, you can in VM and stuff, but it's a little bit more complicated, and I think this makes it a lot easier, especially that we have all the versions packaged up. So, alright, well, that's my little demo of Container NSM. I could probably go on for a while. There's definitely more to it, but the big talk today is with Shane and Simon. Does anybody have any questions on Container NSM? Okie dokie. Hopefully you enjoyed that. And also, are you going to do pass-through for more than just the Snort config, but all the subsequent files, thresholds, and all those? Yeah, yeah, that's ideal. Yeah, we would just probably— I'm just trying to— I've been thinking about how to do it the best. And it might be you have an existing directory on your host is kind of what I'm thinking that has those configs. And then the directory is just mounted in the appropriate place in the container. That's kind of how I'm thinking of doing it. Once I get into it, but yes, to answer your question, yes, I will be working on that. It'll be kind of tricky, but I think we can get it done. Any other questions? Okey-dokey, well, thank you guys.
Wendy, you ready? Awesome.
So I'm gonna hit stop screen sharing, and then you should hit screen share. Is that green button on the bottom of your screen?
You see that?
Great, she's in.
So here we go. This appeared yesterday in Packet Storm Security. It was just kind of— it was kind of an interesting article. Article, not very formally written, but it was talking about just ways people could blow up or fool scanning tools. So basically, so basically they interpret kind of your available incoming data, but they could be fooled, right? Can people hear me, by the way, or no?
Can you guys hear her?
Yeah.
Okay, they can hear you.
Awesome.
Okay, so, Abel— all right, never mind. Okay, so if it's available, the data can be pulled. So for example, if you get a ping response from a machine, does that mean that the machine itself is alive, or maybe response from something else?
You're muted.
So, but if I unmute— I'll echo one.
Okay.
Because they can't hear you when you're talking.
Volume's down.
Okay. Here we go.
So if you get a ping response from a machine, does that mean the machine itself is alive or could be a response from another server? And so one thing that scanners try to do is that they try to figure out what operating system they're running. And so what they do is they tend to look at the behavior of the IP stack, and they've got sort of a signature database, and they say, okay, if we see this value, this value, this value, it probably maps to that OS. And they tend to assume that the IP stack behavior is going to be the same if it's a given OS, which usually it is if you don't change it. And so how can you trick it? You can modify the behavior that the system of the TCP/IP stack. For example, like the— there's a time to leave field in the packet.
And for—
and in this example, 128 TTL is the default for Windows. So what happens if you set your TTL value for your packets in your Linux machine to 128? Nmap— Nmap Nmap pretty much says it can't— it's not completely fooled, it says it just can't map it to anything. This is actually an example from the paper, and we've got a version of the script he put up sort of up and running on the VB box if anybody wants to play with it. Cool. Or at least that seems to be working. So basically with Nmap, it's kind of saying, well, we don't know what OS it is. If you use the OpenVAS tool, it says that it's 80% sure that it's Windows just because you change that value in the packet. And so port scanning, this just displays normal behavior like a port is open, you have the SYN, ACK sequence, and then you have the RST sent back, which means reset. And then any other behavior means that the port is usually basically behaviors behind a firewall. So they use something called a tarpit. The idea of a tarpit is that you try to just cause delay and slow an attack down. And so they, so they're basically forwarding suspicious scans over to a tarpit. And that means even if a port is closed, it will send it over to the tarpit and it will, so it'll, the tarpit will send back a response and making it look like it's open, which gives the scanner or attacker a false positive. It sort of helps— it sort of wastes a lot of your time. Another kind of attack is called banner grabbing. So they'll send a standard service request, for example, like what they used in the example was 8080, which is Tomcat. And you'll expect, and very often you'll get a response back that will tell you what service is running, what version. So they, so if you want to be really sophisticated about it, you can use honey pots and parking lot pits. If you want to be more crude, you can send random stuff back, which is what they did. So they tried this using Nikto. They didn't get a banner, but the garbage that they were getting sent back from the Dev brand eventually forced the machine that was scanning to crash, or at least force the Nikto to crash rather. And the user had to manually stop it. And yeah, and I think Randy, if somebody wants to play with it, I got the script that he published in the paper sort of in working condition or a condition on VB if anybody wants to play around with it or get it with the tools.
Cool.
Yeah, thank you.
That's good.
Yeah, for anybody who's interested in this further, Fyodor Lyon, I think it's how you say his name, the author of NMAP, has a very, very good book just called NMAP Network Scanning. I read it when I was in college and I think it, I mean, I feel like just reading that book has increased my knowledge of pretty much everything that was mentioned by a great deal. So I highly recommend that, especially if you don't have a whole lot of experience with how TCP works, the expected responses. From the stack and as well as the fundamentals and details of how NMAP works, its various databases, and how you can write your own custom scripts in NMAP. I highly recommend that book. It's an excellent book.
What was it called again?
NMAP Network Scanning.
How does the targeting concept work? Does it take advantage of TCP's retransmission timer? Does it try to fool the scanning system into thinking that it actually wants to continue to have some dialogue with it?
I've never deployed one, but I always thought they just forwarded the data. They just routed it to a different host.
Yeah, yeah, it sounds like what they're doing is they're routing it to a different host, which is the carpet, which is basically sort of— it's sort of wasting the attacking machine's time.
Like the machine that the attacking machine thinks it's communicating with, is it in essence a router if it's just passing those packets along to someone else?
Well, it could be, or whatever, I guess the software that's generating the responses. So they could have an application that once it receives TCP SYN bit set in the TCP flags field that elicits some response. Response, such as the SYN ACK to say it's open when it's really not.
So I guess like, if you're the attacker, at a certain point you're going to figure out that this machine actually isn't having a conversation with you, right? And you're going to send a FIN packet and it's just going to be over.
Yeah, I wonder how detailed they go. I don't know. I don't know. Does anybody here on the call deploy the TARPIT?
Or can speak about it?
I never really saw the value in it.
I'm thinking that like this is actually a valuable endeavor, right? I don't know, I don't—
Yeah.
From what I read about TARPITS, it isn't like that they're trying to trick the attacker forever, it's just trying to slow them down and waste their time so they have to spend time figuring out that they're not having a real conversation with me.
Right. Actually, I do, if you have a lot of low-hanging fruit, I think I can see the benefit now that I think about it.
But I don't know.
I've never deployed one or needed to.
Definitely an interesting topic though.
Well, I guess TCP has the concept of so many retransmits before it just kills the conversation. If it's sending packets and it's not getting responses.
Was it MSL?
Basically, it tells the receiver what its retransmission timer is, right? Isn't that part of the actual thing?
Yeah, I think they both do, yeah.
Well, they—
So then the receiver would have to— or the target hitting machine would almost have to basically send responses right at the end of that timer each time.
Oh, you're saying that to concurrently get them to tag along with you.
Right, yeah, like if you're scanning me, like how do I get you to keep scanning me and get you to keep wasting your time?
I see your point. How do I fool you into thinking this is a real conversation? Yeah, maybe they do do that. Like I said, I've never used it, so it's possible that they do do that.
Huh?
You said do do.
Did I?
Well, maybe they do do that. Nice.
It's the result of talking very fast. No, but I do see that.
That'd be something to explore too, though, I think.
Yeah, it just caught my attention. I'm generally familiar with the concept, I just don't know how—
Well, why don't you just establish the handshake and then send data and then just like slowly byte after byte, one byte at a time.
Right?
And have a large response and then it'll be reassembled at the host, right? I don't know how long you can stretch that. It's kind of like how the Slowloris attack worked, I believe. 'Cause it would just—
Right, there's gotta be different methods of doing this.
Right, yeah, I'm sure there is. But that's just, I'm just saying that you could do that too.
You know what I mean?
We're gonna say, you send a byte and then you wait long enough to where they don't timeout. You send another byte, keep them coming, you know what I mean? So I don't know, just kind of brainstorming there, so. Look it up. Hey, I, I, I, hey, if you look it up, you need to do a presentation on it.
That's a requirement.
Yep, thank you for sharing that, Wendy. All right, so now we have, um, Shane and Simon, they're gonna talk about SniffyDB.
You guys connect to the call?
Okay. Can you guys hear me okay? Just like this.
Can you guys hear him?
Hello?
Test?
Can you hear me? Can you hear me? Whoa.
All right. It's showing here that my microphone's turning green.
Yep, they can hear you.
Okay, great.
Because I have my sound muted so I don't— Okay, so just a little bit of background. Simon and I are in databases classes, so this is not purely an NSM tool, but it was also intended to learn about and utilize databases. So Sniffy started out— I gave a talk about this, was it last semester or the I think the semester before.
I think the semester before.
It initially started out as just me learning how to use Scapy and getting some extra credit for my digital forensics class. And all it did was it would parse through a pcap and pull out all of the TCP protocol or whichever protocol you picked and write them to another file and then I'd be able to read it. So now what we're doing with this one is and I would like to point out that this isn't really intended for production use or— I don't imagine it's very scalable because what we're doing is we're looking through PCAPs and we're using Scapy in Python which is by no means anywhere near line speed or fast at all. And it's then writing that into a SQL database. So this isn't really intended to be on the fly a CLI sort of analysis tool, but just something that we use to look at network traffic and sort of analyze it a little bit and to satisfy the requirements of our database class. So what we're doing is— did you want to pull up the GitHub for a second?
This one or the whole thing?
So this— yes, so this is the page. If you want to take a look at the code, you're welcome to do so. I think this is the publicly facing repo. Let's click the other tab there and just show kind of what I'm doing with it.
So, oh, is it not working?
Is your mouse drunk?
No, it's—
what's that?
Okay, there we go. Okay, so this just takes a pcap and pulls it all into Python and then it parses through it and if it has— I've got some different statements here, but it's just basically pulling the— creating a pcap ID and a packet number and then it's pulling the time, the IP of the source and the IP of the destination, some other information like like whether there's some other stuff in there. But anyway, it's just— and then we're creating a SQL database with those fields. And then first of all, I'm writing them to a JSON format to pass them over to— it's Simon who wrote the code that's putting them into the database. And then from there, we've got a couple couple of "advanced features" which we'll take a look at here in a moment. Simon, did you want to explain sort of like the database design?
Yeah. Can anyone hear me? Is it working? Again?
Working?
Working? Yeah, okay, okay, it's working.
So yeah, I'll go through the basic functions first. So first we can upload the pcap files, and I have some demo pcaps ready. So let's try a really small one first. So this one only has 4 packets in it. If you upload load. As you can see, there are 4 packets. And one of our basic functions is we can add tags. And if you click each row, and if you want to tag the source IP as source test, and we can change that to source IP and submit it. Now you can see you can see that any rows that has the source IP is now tagged as source test. We can do the same for destination, it works the same way. Yeah, it goes through other packets and checks if the same IP is within that packet. And on Another thing we can do is we can sort the table by each table attribute. Like, we have a few of the attributes. We can do it by the packet number or the packet time and the tags as well. We can also do some search by any of the things that's in the table. So that includes the tags as well.
And let's try another demo detail.
No, maybe talk about the predefined tag text first.
Yeah, that might be—
OK.
I will do that first. So we also have a function called upload tag list, which is if the user turns out to have a predefined tag list, So let's say I should probably show that first. How do I share the whole screen instead of just Chrome?
Just slide to your right or left. Is that— minimize the application then. Because it'll work with whatever you—
unless you—
yeah, so you just get the whole screen.
No, I think you lost it. It's only sharing the Chrome.
I think when you share your screen, you select what to share.
Yeah, you could have hit the one window too.
So then maybe stop sharing and then start again. So now what this predefined tag list does—
How's it?
Is it allows the administrator to create a list of, say, you want any traffic that contains an .exe file or something like that. We want to say that that's not allowed on our network and we want to tag that as malware. We have set right here that this is a possible malicious site because it contains the .exe extension. Or if we know that anything coming from an illinois.edu site is is going to be safe, then we can tag all those IPs like that.
All right. So I will now upload that file, text file. And upload a new pcap that's related to those tags. Oh no, that's not it. And it might take a while because it's going through all the packets and applying the tags. And this pcap actually does have one of the .exe in the payload. We specifically looked for that on Google. So yeah, as you can see now, we have new packets from the new pcap. Here, this one is marked as malicious. If you look at it, the payload does have .exe. And I think that's actually a malware. I don't know exactly what it was.
How many fields does it parse? Right now I see source IP, the timestamp, of course, destination IP. Does it do ports?
Does it, uh—
No, we don't have it configured to do ports.
Okay. But yeah, it should be a simple change. So like in the Sniffy, when it first parses the pcap file, you can pretty much add it like right here.
Mm-hmm.
And put it into JSON file.
Sounds good.
And the clear table function, it clears any packets, any rows that doesn't have the tag specified. So you're going to leave some packets if it's tagged. So if we click it, it did it with the ones that didn't have tags. And—
What web framework are you guys using here? Is it Django or—
It was—
what was it?
I don't know. The other two. There were other two members and they did like the front-end stuff. Okay. So they were using like Flask. Oh. Python.
Mm-hmm.
For the visualization data. So yeah, we show the data visualizations.
Oh, that is cool.
This one is pretty simple pcap. There were not a whole lot of IPs involved, so it looks pretty simple.
Mm-hmm.
But yeah, they use something called D3 for this visualization.
Cool.
And you can try a different pcap and then we—
Yeah, I don't know if you noticed, but when he hovered over the edges between the nodes on that visualization, it popped up a list of all of links that would show the payloads.
Okay, cool.
Something interesting that we noticed is that when I parsed the data out of the pcap, like Python could handle all of that text just fine and I could write that to a file fine. But since payloads can have any manner of characters in them whatsoever, when I tried to write that to JSON, it broke the JSON. Not every time, but frequently. Anytime it had like an escape character or anything that wasn't URL safe. So then again, even if I fixed that and then we tried to put it in the— to the SQL table, again it broke again. So what we ended up doing was encoding those payloads as Base64 URL safe, and then at the very last second we're decoding them using a JavaScript functionality that we— that we were able to to find that helped us out with that. That was one of the funner challenges that we had on this project. But Simon's about ready to show you, I think, some more.
So this one is traffic captured on my computer. So it does have Illinois.edu in one of the packets. And that was defined in our tag list. So it should show up somewhere. So yeah, this one is shown as safe because that's the IP for, you know, the ADU, and that's me requesting for that website. And another thing we did with the tag thing was— so this, just now we tried demo3.pcap, and that tag Illinois.edu as safe. And if we upload another pcap that has the same IP, the tag, the previously tagged thing is also applied to the new pcap as well.
I can't do this.
So let me try something else.
So let's see.
So I know this 101 is my host, so I'm just gonna call it host. And if we upload a new pcap that has the same IP, that's gonna show up, that's gonna be tagged as well.
So really, like, while this might not be practical for use in, like, production of net— actual network incident response, I think with a little bit of tweaking it might be a fun tool for looking at PCAPs in the context of, like, a capture the flag contest or something, something where we have, like, a more our static pcap that we're trying to find information about and be able to have a second or two to, like, analyze it and not have to worry about a bunch of traffic.
Yes. So this new pcap had the same IP and it's automatically tagged as host because of the previously defined tag. And, yeah, another thing is we can also delete the tag. As you can see, like, there are two buttons. If you want to delete the source tag, we just hit that button. And it doesn't delete all other packets that's related. It only deletes the one tag because we thought that made more sense instead of deleting everything that's related. And we can also— yeah, so the data visualization is going to look much more interesting. So we have two graphs, basically. And then 117 was basically my VM, 101 was my host, and they happened to be using the same IP at the time. And as you can see, if you go over the edge, it shows the payloads of the packets that's involved with that IP, that communication. And if we click on one of them, it shows details in the table on the left top corner. So that one was encrypted, so there was no point of showing it. So we just coded that. That one actually had plaintext payload, so it just shows— Whatever was going on.
Yeah, it looks like session setup for us is it.
Yeah.
Yeah, I think that's pretty much it.
Cool.
No, I think that's about it.
That's a pretty cool class project, I'd say.
Yeah, it was fun.
And it looks like it's pretty easy to adapt more, add more things, more fields.
You can throw it up there, busterbytes/sniffydb. Feel free to fork my repo.
Sounds good. Well, thanks for presenting, guys.
The hardest part was making it right while trying to make it simple enough. Because the network thing is not really simple. We're trying to focus on the database aspect. Expect more than network thing.
Right. Yeah, unfortunately this was for a database class, so they were more interested in us doing fancy things with databases, and we were more interested in useful things for network analysis. And they're like, okay, well, we don't care about all that tagging stuff, but the visualization looks cool.
Yeah, nice.
Yep.
All right.
So where are we at? We are at the end, I believe.
Yep.
So again, this is the last meeting for the semester, and we'll begin again whenever class resumes in January, late January.
More from Jon


What No One Knows the Podcast / Vodcast featuring The Tampa Bay Wave and Jon Schipp

Meeting the Exposure Management Challenge: Key Use Cases for Success | @OfficialRapid7 #SolutionSpotlight

Spot Security Control Gaps and Non-Compliant Resources Across Your Attack Surface






