OpenNSM (What is NSM)
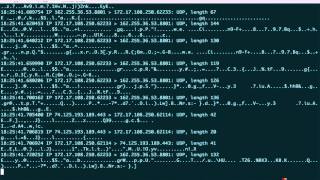
Jon Schipp introduces Network Security Monitoring, the practice of capturing and analyzing network traffic to spot threats. He walks through data collection methods like network taps and port mirroring, then demonstrates tcpdump, Wireshark, and Snort to show how to filter packets, extract flows, and generate alerts from suspicious activity.
Chapters
Okay, so yeah, we're going to talk about what is network security monitoring. I'd say that the father of network security monitoring is Richard Bayliss. He is currently the Chief Strategic Officer at FireEye, which is a large corporation that deals with defensive security. They have a lot of products you can put on your network to identify malware and attacks, etc. He before helped develop the procedures and standard, or say practices, of network security monitoring. At the Air Force where they really got it set in stone. And he wrote a book called The DAO of Network Security Monitoring. And this is actually, it's quite a few years old now, but it's still my top or my favorite book in the particular field, and I've read about every single one. It is a tome. It is very large. It's like 600 or probably 700 or 800 pages.
We can probably just find that out real quick.
832 pages. Very academic too. Huge appendix. Lots of, large bibliography and he goes into a lot of papers and stuff that kind of help formalize things. But it's interesting because this book divides network security monitoring in a number of tactical sections. Or I should say ways of approaching the problem of identifying threats. In your network data. Now we should say that network security monitoring as the field is a subfield in cybersecurity. It focuses, as the name implies, with networks, looking at packets or data that traverses your computer networks. So things that, you know, go through the wires or if you're in the case of wireless or 802.11, go through the air. And to see these packets, you have to have a device that can physically read them, right? Because it's all coming down to electricity and pulses. So they develop custom devices to be able to analyze these packets. And one of these devices everybody in this room has on their computer or their cell phone, and that is a network card, right? So it has to be able to understand this stuff, very basic, right? So it can see these packets. These packets are then passed up to the kernel through the TCP/IP stacks and then passed to the application layer, wherever, whether it's your web browser, your email client, you know, when a user sends you an email, it hits your network card, goes up to the TCP/IP stack, then gets passed to the application, which tends to be your Thunderbird or Exchange or whatever else or whatever mail software that you have. So, In the practice of when you have a large network, or not even just a large network, a network in general, and you want to see what's going on, you don't really, it's not very feasible to have software on everybody's computer. Now granted, there are companies that specialize in this, that have agents installed on everybody's computer and kind of watch what they're doing. What we typically do in NSM, we have an architecture where, let's see, let's just look up TAPs.
Online. See if we get whatever— oops, not the kind of taps. Well, da da da da da da. Let's do network tap.
Okay, this is a little bit better. So in this case, let's go start with the simple one.
Aye.
You have computers that are attached to the switch. It doesn't actually show it visually here. And these are your users or you yourself or the employees or whatever the organization is about. And then over here you have the sensor. Now this is a device that does what we talked about. It takes those packets, right? It just retrieves them and then it passes up the TCP/IP stack to some application that's listening. And we have the network tap. Now this is the device I was saying that, hey, Instead of having an agent on everybody's computer that kinda watches what they do, we have a device that is able to duplicate the actual electrical impulses and thus the packets on the wire and copy them and send them to another machine. And this is what happens. So you have Sally, Joe, Bob computers are plugged into this switch right here and they're gonna send traffic out to the internet. To check their Gmail or just their work stuff or even be internal. It could not even go out to the internet. It could be their internal mail server, etc. The network tap up here at the top is there listening for that data. And what it does is it's gonna send the actual stuff to its destination out these ports, you could say, for example, just to simplify things. They're going this way to the internet and then out these ports it actually goes over here to the sensor. And the sensor just gobbles it up, right? It collects it. This is similar to the NSA in their wiretapping program and well, specifically we talk about metadata in a little bit, but they're doing bulk collection of data, right? And they're kind of having the same idea except they do it from the telecoms, right? They get the big telecoms such as AT&T where every, like, thousands or millions rather of communications are going through there every minute and they're siphoning off copies of that data. And then they're analyzing it. And this is kind of the same thing at a small scale, one that doesn't have as much ethical concern as that as well either. Typically these are your company's network, they own the networks, they can monitor the employees. So that's kind of the basic gist of collecting the data. There's different types of ways to collect it as well. Network tap is one where you have a physical device where the cables are plugged into it and then they send it to the right destination and they copy off to the side. But you also have things like SPANs, which is just, or port mirrors, just the same terminology really, or they're different terms for identifying the same type of feature of a switch. And that allows you to do the same copying directly on the switch where you don't need a tap in line. You can actually say, Hey, I want to allocate all the ports over here, right, in this little block to copy the data out. Where it says all the employees are plugged in here. They'll go to the appropriate destination out to the internet, but everything will then be copied out to somewhere else. So they have that stuff too. If you want to set up your own TAP infrastructure at home, a cheap way to do it is to get a hub. If you're familiar with switching versus hub technologies in networking, where the hub will copy a packet out of every single port that it— once it receives it on one, it will be copying it every other port, which tends to be inefficient, and thus it's reduced down to a half-duplex communication speed versus the switch, which is full duplex, which only copies the data from the port that it's intended to go to. So if Sally is trying to send a message to Bob over here that's plugged— his computer's plugged in here, instead of in the case of the hub, where it copies Sally's message out to every single port, it only copies it or sends it to Bob's, or excuse me, Bob's port right there, and then Bob gets it. So it reduces the amount of traffic in the, you could say the broadcast domain in network speak. So that's just another way. So if you wanna get a hub, you can, I actually probably have a few hubs at home or extra if anybody's interested in playing around, I could probably give you one. Another device that's nice— they're cheap on Amazon? Perfect, yep.
Make sure though that you get an actual 10BASE-T hub though because a lot of things that are being sold and marketed as hubs are actually switches.
Mm-hmm, yep.
So you want to make sure that it's a true hub.
That is correct, yep. Do make sure it's a true hub. So if it says bridge or switch, it's not acting as that kind of technology as a hub. Another thing you can do is MikroTik is a company that sells these nice little—
I'll put a link in the Slack channel.
Okay.
Perfect.
That sounds good. This guy right here is almost $50. And I have a few of these. This is actually a switch. But the nice thing about this, this has that port mirroring or span feature built in. And then you could say, oh, packets that come in here should go to their destination here, but also should be forwarded to here, right? So you can make copies. You can tell it in the software. You plug it in, you go to the web interface, and you say, oh, I wanna copy all packets. You can do checkmark boxes from this port and then check the port that you want it to go out of, and it'll send copies that way. So that's another poor man's hub. If you have 50 spare bucks or so.
TrowingStar LAN Tap. It brings up a 4-port device where you basically plug your Ethernet cable and your destination cable just like you would your switch. And then there's 2 ports on the side, one for send, one for receive.
Ah, nice.
So I have that one on the bottom.
Okay.
4 ports on, one on each side. And so the one, one, your Ethernet cable from your computer would go into one, and then the other side would go to your destination just like, you know, it's your normal connection like a packet man. The other two would be for send and receive. So it would go to your device and it can use it. In this case, your device would have to have two network interface cards that it could receive both send and receive traffic.
Is it about that big?
It's about that big.
Yeah, nice. That's a nice way you can take care of it with you and be portable. Okay, yeah. So check that out too if you're interested. Of course, that's not the only way that we can actually— you don't have to spend money to work on network traffic and analyze it. What the common thing to do is to get a packet capture. So let's just go ahead and look up the pcap file format. So luckily, people that actually record data, record packets, release them in this format called the pcap file. We can just take a quick look at it here, and we'll go through a demo. So it's a file format that has, that Whenever you record the packet, it has a block of information, a data structure for every single packet inside it. And I have some PCAPs on my computer.
We'll quickly go over here.
Let's go ahead and open this window. I have tcpdump, which is a packet sniffer. Before I do, before I mess with the PCAP, if you're on a Unix-based operating system like OS X or Unix or any of the BSDs, et cetera, you have tcpdump probably installed, most likely. In that case, you can begin sniffing on your interface. So I'm gonna say, make it a little bit bigger so you guys can see it. I'm gonna say listen on en1. en1 is the device driver name for my wireless network card on my MacBook Pro right here. So I can say let's sniff on en1.
Oops, wrong password.
And you'll need to have, to be able to access a device like this, you'll need to have administrative privileges. In the Unix world, we call that root. And these are all the packets that my card is seeing right now. That's coming, traveling through the air, right? Hitting the, going through the WLAN stuff, then through the Ethernet and passed up to my computer. It's a network stack. So I see a bunch of packets. I can just go ahead and quit out of it here. UDP stuff, here's a TCP packet. What we can do is we can probably identify one quickly. So you can add the -a flag which will print the actual, instead of giving this little summary view, the summary is very simple. If you look here, we have a timestamp up in the left-hand corner. We have the protocol that was detected. It's using the IP which is the Internet Protocol. Almost everything we do use nowadays communicates over IP. We have the source IP address and we have the destination IP address.
So who are they going to?
Who are the callers in the party? And then a higher level layer protocol called UDP that it's carrying. And it gives you a length of how much data is there. But we can go a little bit further. We can just say, hey, give us more output. Look at that. So a lot of it's unreadable crap. But this looks into the contents of each one of these. The actual data portion. Not the metadata like the IP addresses and stuff. So let's just give you a quick demo. Let's look for my name, because I'll go to my website which is unencrypted, so I'll actually be able to pull this out.
Um, JonSchipp.com.
You can see right there, it was able to pull out, see, we see a DNS request from my machine to a DNS server on port 53, because that's where DNS is associated with. Asking for an address for jonschipp.com, and it gets a response. Oop, don't have it on here. It probably hasn't came yet. But it actually asks for another record for webmail. Let's just do it again. I stopped the packet capture too soon.
Whoops. Hopefully it's not cached.
Oh, it's cached.
That's why it didn't come up again. Um, ba ba ba ba bum.
Let's look for another keyword.
Let's look for Linux, and we should be able to get the, uh, let's do port 80 and refresh this.
There we go. So now we see web traffic. There we go. Let's see if this is the right website. Yep, this is me. Okay, so I refreshed the page, right? I added a filter to look for TCP traffic. And when you go to a website, you're communicating over TCP. And we see here, let's go to the very top.
Blah, blah, blah. Sorry, there's a bunch of crap. Where are we starting? Where are we starting here? Send, blah, blah, blah, 80.
I bet this is my web server right here, so we'll verify that real quick. Drop down a little terminal here, and we're gonna say dig, get the reverse for this IP address, and it reversed to a DreamHost, looks something on a DreamHost system. That's mine, my stuff's hosted by DreamHost, so this is in fact a request to my server right here. Okay, so is everybody familiar with the common ports For services? I don't have all of them memorized. Okay, yeah, I just wanna know if people understand the idea of logical ports for sockets.
Like cat /etc/services.
So there is a, yeah, in the Unix world you can actually see there's a file stored on the file system that allows you to see all the ports and the common services that are associated with them. It's very, very long here. Let me open that in a larger window, one second here.
Bum bum bum bum bum bum bum. Let's do it right here. Bum bum bum. All right. See services.
And we can look for www, right? And you can say the World Wide Web runs on port 80 TCP, right? So, and you can look for mail, you can look for other things. Tons of matches, probably a lot of services you've never heard of. But the other important one was DNS. Go through here. There's a lot of different types of DNS services.
Let's go to the very top and start down. Ooh, do they not have 53?
Or it's called something else, isn't it? Name cert, name, maybe?
One second. 53.
Okay, they call it domain. They call it, that's what the actual, official name is apparently. So domain or the DNS system, what you use to actually resolve a fully qualified domain name like something.com to its actual computer address, the IP address, to do that we use a protocol called DNS. And when I used that dig command earlier, I asked the local DNS server to look up for me the hostname of the IP address of my server that I gave that returned. Remember that was a DreamHost system. So when you communicate, like in the sockets interface, what we use to do communication between systems and interprocess communication in some cases, we associate a logical port that's generated and then typically a standard port. Doesn't have to be, that could be really any number between 0 and 65535 because it's a 16-bit field, 2-byte field, so it's 2 to the 16. And so you have that many possibilities for port choices. And my computer, when I make a request to say google.com, will generate a local port like this one right here, 51579. But it's going to the standard port for the web, the World Wide Web, which is 80. You can see that right here. And TCPdump has a habit of what they do in their— its output is it delimits by a a dot, a period. So you have the IP address, which is a 4-octet or a 4-byte field, or address, I should say, not field. Then you have another field, which is 2 bytes after, and that is the actual port. So first of all, I will say this stuff, if it's a little over your head, NSM typically requires network knowledge to be efficient with it. And the thing here is that we will actually go through some of the protocols and stuff and teach you various things like that. So you'll get an understanding of what goes on when you actually go out to the internet and make requests. So that's one of the goals of the group. So, but we're also gonna do right now, we're just doing a quick deep dive into actually looking at packets. So again, remember this, we're sniffing live. So we didn't actually have a tap on our network to get these packets, we can actually open up a tool on our actual operating system that allows you access to these packets that come from the network card. And there's software in the Unix world in the kernel called BPF, for the Berkeley Packet Filter code. This is what actually allows you to view these things. And this is, you have this in Unix derivatives, Linux has it, BSDs have it, they all have their own little implementation which may be a little bit different than some than others. And they all have their own features. But you can also do this on Windows. If you're on Windows, you can download Wireshark and do the same thing in a more pretty GUI way that actually gives you descriptions for every field, 'cause it knows, it has a bunch of pre-populated dissectors that say, oh well, this 80 here will say right next to it, this is HTTP, the World Wide Web. It'll let you know these things. We'll get into that later. But right now we wanna start from the bare minimum and kinda work you guys up. So continuing on, by the way, if any questions, just throw them out, seriously, just yell it, whatever. In addition, we see that the packet went to the web server and we see that there's a flag here and this is basically TCP. So TCP has flags, you can actually go to, let's go to TCP, whoops, this is not the browser window I wanted to use, okay, TCP, let's just go Google, let's say TCP header. So all these protocols have, or most of them have header structures that kind of display how they work. So here's a nice little image. You can see that the TCP flags are right here. They determine what the type of packet TCP is carrying. And that results in what, whether it is actually has to deal with how it's processed by the operating or the TCP stack. So in this case, you saw the S, we're looking at this bit right here. That's set to a 1 when the packet came across the network. So if we go back, you see the S. This stands for synchronize. This means in TCP parlance that a system wants to synchronize TCP to another system. TCP is the Transmission Control Protocol, and it is considered— called a connection-oriented protocol where they keep track. You have two points in a TCP connection, the source and the destination. Develop a connection. And so that actually goes further than just source, like actually, you know, this to there. It's there back and everything in between that particular stream of data. Because TCP actually tracks the bytes. That way if a packet I sent gets dropped, maybe there's a miscommunication in the router that gets hit as it travels across the world to its destination, TCP will know, it'll say, hey, I never, the server will say, hey, I never really got the acknowledgement for that packet. And your client will send it again. This happens very fast, in milliseconds usually, especially if it's across the country.
Is everyone familiar with TCP and UDP? You've heard of these a little bit? So for instance, you wouldn't want to use TCP in a, right, you've got a phone call, so say you're on an IP phone, you're gonna use UDP because you don't want that to be sent. You say something and it gets dropped, you would just rather have that not be sent.
And the reason you do it for, like he said, with the voice calls is because of jitter and delay. You don't want a word that was carried in a data packet to arrive 10 seconds after you said it, right?
Audio is a lossy protocol.
Yes.
The other thing is too about reliability with UDP, that UDP as a transport doesn't provide reliability, but applications that UDP can provide that reliability. So like just because it's using UDP as its transport doesn't mean you won't have reliability built in. It'll just be a function of the application at the endpoint.
Right, yeah, so programmers have to just decide how they're going to handle that loss.
So for example, DNS uses UDP as its transport, transport, obviously when you make a DNS query, you get a response back from a DNS server, right? But if you think about that in terms of UDP, the traditional, right, with UDP, you don't expect to get responses back. Well, if you're getting a response back when doing a DNS lookup, that means that something's giving you that back. It's just not the transport, it's the application on the listening side, right?
Yep, exactly right. So that's why we have these two different things. It's like there's no set One of these communication doesn't work for everything, right? It depends on the specific purpose. So back to the website example, we have the SYN that was sent and eventually we get a response back. We're gonna skip a lot of this because we don't have a whole lot of time and we're already 30 after. But eventually the actual communication happens. The synchronized, the 3-way handshake in TCP which actually says, hey, this is an official TCP connection, you synchronize with the server. And they say synchronize, what actually happens when you send the data to the server, you fill out a field called the sequence number. And it is a number that is a base number that you use in your packets to track the number of bytes that were sent. So you synchronize with the server, you give it your base number. They also generate their own base number and they acknowledge your synchronous, your ability to synchronize with them and they send a packet back that instead of having the, the S, it has this, the S plus a dot, and the dot in TCPdump will be the acknowledgment bits. They're acknowledging my request to them. And you can see here TCPdump says, hey, they actually have a sequence number field right here. This is a 4-byte number, and they also have an acknowledgment number, so they're giving that back. Now every time a piece of data is transferred, they increment the number based on how many bytes was transferred. And that's how you know whether data was lost or not. So going back down to the actual website example, which is a little bit more interesting, not all the details, you can see that my web browser made a request for HTTP packet that said, had the host field set to jonschipp.com. It had the user agent string Mozilla on Macintosh Intel Mac OS X. So the user agent string is identifying my computer because it pulls it from the operating system. It has a bunch of other crap that are specific to HTTP such as encodings, cookies, etc. And then the server comes back right here, the server Apache responds and says, "Hey, I'm an Apache server. We're gonna establish a keep-alive so we can actually keep the session open." And a bunch of other encoding mechanisms, the options that they can set. And then I send more data and this time my packet to the server again to port 80 on the server. Asks for pics/jonlinuxcon.jpg. So whenever I go to the website and the HTML is represented, it has to go all the way down and it reads all the data in the HTML, and one of the things it sees is a link, an image source link to the, the jonlinuxcon.jpg, which happens to be this picture right here. So it had to make a request to get that image to display it in your browser. And that's what the GET HTTP method does. It obtains a resource via HTTP. That resource could be a page, an image, a video, whatever. And you can see that on the bottom, in the HTTP header, remember we pulled all the data, it has a MIME type of image and a few other parameters passed to the image among other things. And then we can go down, blah, blah, blah, and eventually it'll start passing the HTML back and you'll see all that crap. But that's kind of the gist of the packets as they come across your network. And the best way to learn this kind of stuff, if you're interested in networking stuff, is literally just to open Wireshark. Download Wireshark, it's free and open source, it's a great tool. And then just turn it on right now. See what traffic is going across the network. Do it at home, I don't know if there's policies at the school, I really don't know, but you can listen on your own machine so that anything that hits your NIC can be presented and shown. It's really interesting because you can also see what kind of data your applications running, your processes running on your operating system are actually making calls out to. That you can find processes that are going to some server that you did not know. And that's one way you can identify, you know, spyware, adware, blah, blah, blah. Of course, that's one of the goals of NSM is to identify malicious things. But it's an easy way to do that. Now to get back to what I was talking about, this isn't the only way to gather data. We can gather it via via a pcap file. So we can generate a pcap file really quickly, right? So I'm gonna take that data that I just made, I'm gonna write it out to a file called john.pcap. Oops, so syntax error, what did I do wrong?
Port 80, www, we don't really need this by the way. Let's just go ahead, I bet this, yep, it's the ordering, there we go.
So it prefers the filter as the last argument. Okay, so now any data it's finding, we'll go ahead and refresh the page again. Refreshed. It's writing out to a pcap called jon.pcap. So I'm gonna quit. It says 42 packets captured. So then we can see this pcap file in our system called jon.pcap file. This is a tcpdump capture file. We can see that there's data in there, 7,839 bytes, and then we can just tell tcpdump to read it in. To do this, we use the -r option. And voilà, we got the same data in the file. And so for your—
Can you talk a little bit about why you might want to use the -n option?
The -n option is for name resolution. We turn off name resolution when you specify it. By default, name resolution is on. So the idea here is for every single IP address that it sees inside that file, again, let's print the first 10. It will do a lookup for this guy, for this guy, for this guy, which is all the same at this point, to the local DNS server. So you actually generate more traffic. So it actually takes longer. We can do a quick demo of that too. You wanna verify how long it takes, do time. We'll do -r, right? So 0.033 seconds. And if we do it with the -n option, we have 0.007 seconds. —so much, a lot less time that was used to actually read the pcap file because it doesn't have to wait for a call to maybe, I don't know, getaddrinfo, a libc function that returns the address information for every packet it sees. It just skips that. So that's the idea of pcap files. And you can get them online. If you wanna play with pcap files that have malicious content, you can just look it up. Malware PCAPs. Many people, such as this guy Brad, who has an awesome website, has these resources available. Let's take a look at his 2016 posts. So we can look at an infection from the Angler EK infection. And he actually shows you the Wireshark, that Wireshark tool I was talking about, makes it really nice and easy to see things. Parses out the URLs and he has PCAP files you can download from the website and he shows you how to analyze it and find the vuln— or the exploit— or the bad code in the stuff. A lot of it's obfuscated, etc. But this is— you can actually pull these things down and play with them. You can actually have that recorded traffic of these malicious URLs. So that's one thing. Alright, so quickly go over the file format and then we'll get into the big topic— or the big— again, the NSM as itself as you understand the networking stuff. The file format for pcap is very simple. It has a global header. This is the header right here. This is the structure in C, the data structure that's used to store the various information like the version number, timing, timestamp, et cetera. And then for every single packet, there is a per packet header. And that records the actual packet information as well as the timestamp for the packet. And of course, if we do, if we go up here, you see the timestamp right here. This data is stored for every packet and again in this data, these two fields of this data structure, right? So timestamp seconds, microseconds, and it just pulls it out. So this is for every packet, it records this. So breaking away, let's go jump into network security monitoring as a method of analysis. So, Based on what I'm using in this case, I'll be referring to Richard's book where he divides it in 4 different sections. So again, network security monitoring is about the practices and procedures to identify threats on your networks. And there's 4 big branches that we can use for the analysis. You have what is the heart, the most expensive, but the most useful and that is full content packet capture. That is, you record every piece of data that comes across the network and you store it. So if your company does that, your organization, and they get owned later, they can go back in time, take a look at that storage, and pull out all the events that happened and identify the attacks in that data 'cause you stored it. But the problem with this is, especially in large networks, is the amount of disk space it takes to record all that content. The next thing that we do, or the next method is for collection of data, is the collection of flows. So a connection-oriented collection. Let's take a look, go out to the internet here and find an example. So NSM, let's take a look at SILK or Argus or something, an image. So these are tools that are used Ha, continuous SM showed up in that search, nice. Some weird stuff, or some stuff that I would not have thought would have been coming up in there. Network security, let's try that. NSM, okay, yeah. So here we go, perfect. So this is an example of flow data. I'm gonna make it bigger. In this you have only the metadata is recorded. It's not all that data that we saw. We went to jonshipp.com, it pulled out like, you know, the actual contents of the website and everything. In this case, we just store the metadata. Tools like Argus and Silk will do that, and NetFlow. NetFlow is a standard for recording this information that's used in network devices such as Cisco routers, and there's sFlow, I think it's HP-based, etc. But here we actually record the source IP address, the destination IP address, the source port, destination port, the number of packets that were sent, the number of bytes throughout the whole connection, et cetera, and timestamps. And this data is very small because it only records a number of key pieces of information, that is the metadata about a communication between two parties. This was what allows us to store data in a smaller way, in a smaller format because there's not as much data and that allows us to keep it longer. Thus, this kind of mitigates the expensiveness of recording every packet to come across the wire. So in these cases, you don't have as much data though. If there's an attack, you can't see the contents of the attack, but you can identify who the attacker is potentially and who the victim is and how they communicated. And then you could use that to leverage or make better decisions about future information. And that's the idea with recording connection-oriented data. Next, we have the idea of statistical data.
Let's look, let's try to find, what's a good tool?
Barsh can do it. A lot of times you use graphing software and store the data there, but what is the, let's look at ipsumdump maybe.
Nope, not what I wanted. But statistical data is, No, no screenshots here. Blah blah blah. One second, I have something I think I've done on statistical data. Statistical. Yeah, TCB stat, I think, maybe. Nope, that's not the one. Um, stat. Oh, DSTAT, TCPDSTAT, okay.
This is an example of statistical data here. This program, it's a very small, simple program, but here we go. So this will actually read in network data and it will generate some sort of distribution of packet sizes. It would do a protocol breakdown so you can look and see, you know, of the 54% that was IP, this many protocols that IP was carrying were distributed in this percentage. So the idea here is you can use this kind of data, for example, to track base differences from your baseline. If you know that on a given day that you'll see 30% TCP traffic on your network, but say a week later somehow it's 80%, so 50% higher, what, you know, that's an anomaly. You need to look into that. So with that much more data, you need to investigate that. Tools like this will allow you to easily see that kind of information. So maybe it was a botnet compromise and they were sending tons and tons of data back and forth. Maybe there's exfiltration of data going out to the network, leaving the network. Maybe these users are downloading lots of files because you had some big production release that came out or some media campaign, downloading tons and tons of images. I don't know, just kind of ideas. It could be anything. But once you have this kind of information, you can kind of figure out why this is the case. And that's the use of statistical data in network security monitoring. And then lastly is the application data or the session data. Let's take a look at session data.
So TCP session data. And images. Whoops, not shopping. Images. Bum bum bum bum bum bum. So let's see what this guy has.
So here's an example of session data. So we are able to pull out the contents again of the data and represent it in a form that we can read. This is an ASCII, left-hand side is the hexadecimal representation, right side is ASCII. This is one way to look at it. You can see this is a Windows 2000 workstation. You can see directly inside the red text W2K workstation Microsoft. So that you can see that machine's identifying itself. And this is communicating over, I guess, NetBIOS TCP probably. Oh, maybe not. I don't know what 1433 is. But anyways. It's a workgroup computer. So that's a way to look at session data. You also have tools like Bro, which can give you session data in a log format. It doesn't give you the full session data, but it definitely gives you some useful information.
So let's take a look at Bro. That's Intel stuff. We don't want that. We want— What does this have? Lame, I want to see Bro's SSH log. Is there an example of the SSH log somewhere? Maybe here?
Yes, well this will do it. This is software.log. So Bro is able, this is a, Bro is a tool that's developed next door at the National Center for Supercomputing Applications. It's used at Facebook, Google, Amazon, a bunch of other places. Really cool tool. It's also half the team's here, half the team's at the International Computer Science Institute at the University of California, Berkeley. And it's a really cool tool for, uh, and useful tool that provides a scripting language to analyze network data. And it generates logs by default. And you can see that in this case, if you look at the logs here, an HTTP browser was detected in the software.log, which lists and identifies any software. It's using PortSnap. So this is probably a FreeBSD system. And, yep, 8.3 release, there it says in the corner. It was able to parse out the version. It also found that someone was using wget on the network. Someone was using Mozilla 5 browser, unspecified WebKit, etc. And then finally we can do one more example of session data. And that is to use Wireshark.
Let's take a look at images again. What we got here? Hopefully someone has a nice image available that kind of gets at what I want. Here's one. Okay, so this image right here— we'll finish up soon here—
this is an example where you get to pull the session data from Wireshark. And you can see here it's using HTTP. But what's happening is, it's actually, instead of seeing all that crap you saw with TCPDump, like all the metadata and stuff, this actually just grabs the session data. So the red is the originating host, and the blue is the server responding. In this case, the server responds with HTTP/1.0 200 OK, so it accepted the request, and it served it back to the client. In this case, the client's subscribing to this UPnP URL. Which will give them events. So that's kind of an example of seeing the actual data. Some of this is the most practic— if you're new to NSM, something just looking at this kind of data, which you can read, it's easy to read, can yield lots of useful information. So that's kind of the 4 basic tactics for, or methodologies, or approaching them that way for NSM. Well, actually I forgot one. Intrusion detection. So the alert data, this is actually a really important one. So let's take a look at a Snort alert. And this, instead of going through all the packets like we did with looking at TCP dump and stuff, there's just too much crap there. Sometimes you want something automated that can look for patterns in the data. And in this case, we use an IDS tool to actually alert you on things that are of interest and that you can then look into further with all those other methodologies or means of looking at the data, of analyzing the data yourself. 'Cause you don't waste time looking at every single packet that comes in. Across the wire. It's impossible. So take a look at this image right here. This one, Snort detected that there was an ICMP echo reply, which we don't really care about. That's not really interesting at all. That's normal traffic. What's here? So here's a little better one. So here, people ran Snort on a pcap or on their network, and they found that there was an Nmap scan for the Xmas or the Christmas Day scan. Which is a specific combination of flags. Snort found that and alerted and said, hey, someone's trying to gather information from us. So you have that in this information right here. It includes the source, the destination, and some other information. And with that information, then you can go look up in that NetFlow data, or you can go look up in that full content packet capture and investigate it more if you need to. This is common though, not really that interesting. The other thing we have, a Unicode shared access from NetBIOS SMB. So this might be looking worth looking at if you wanted to lock down your systems from sharing access, assuming that's what it means with NetBIOS. I'm not really a Windows guy. But there's an attempt to access a share on the network. So you can do stuff like that. There's also rules to detect all kinds of viruses, etc. So that's kind of the smallest amount of data is with the alerts. Because you just get a point in time, a picture. An alert describes a point in time that it matched a signature and saw a thing. And then you have to determine, your analyst will look at it and either escalate it or something to decide what to do with it. Whether it's a false positive, something we don't care about because the risk is really low, or something that needs to be analyzed further. And then they go back to the other means of, all the other data that you collected, and they look into that and see if it was indeed something that was worth, or something that is a critical threat. Or I shouldn't say critical, but a threat to the environment. So again, NSM, to summarize, it's really all about the procedures, practices, methodologies to protect your net— your assets from threats and to identify them. So it focuses on a detection methodology. There's also a prevention methodology— or I shouldn't say methodology, but a prevention approach in where we just block that shit as it comes in. So You can run Snort inline mode. All your users are on the internal network, they make requests out to the internet, Snort decides whether this, or Suricata or whatever, decides whether this packet should pass or fail or reject it and it goes out. But university environments like this, we have to rely on a detection methodology because we have to keep the campus open for research and for people to allow them to do things that they need to do in their daily lives. Yeah, so basically campus has to keep a very open environment so you guys can send your data wherever. So that requires a fundamental, or an approach that relies solely on detection. We can't just block everything that you guys do. So that is in contrast to how a lot of businesses do it. Businesses will only allow certain things. Like I had, I worked at a for— industry for a little while and our systems were set up so that we blocked everything except what you were allowed to use. And it was a pain in the ass for a lot of things. When someone needed access to something, they had to put in a request and we had to approve it and we had to implement the firewall rule to allow it. So, but that way they were locked down. That's kind of an approach in a lot of businesses too. So it just kind of depends. So, but that's NSM in a nutshell. So yep, that concludes, I guess, the meeting 'cause we're a little after now. So thanks everybody for attending and we'll talk about more stuff. If you have any questions, feel free to, to ask them and make a request for things you want to talk about. Thanks for coming, guys.
More from Jon


What No One Knows the Podcast / Vodcast featuring The Tampa Bay Wave and Jon Schipp

Meeting the Exposure Management Challenge: Key Use Cases for Success | @OfficialRapid7 #SolutionSpotlight

Spot Security Control Gaps and Non-Compliant Resources Across Your Attack Surface






