Packet Capture Basics - File Format 2
Jon Schipp explains pcap-ng, the newer packet capture format that adds nanosecond timestamps, OS information, and comments to the older pcap standard. He walks through each block type, shows how to parse files with open-source tools, and demonstrates how Wireshark lets analysts embed annotations for collaborative forensics work.
Chapters
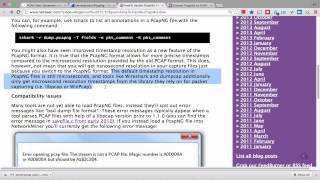
Let's look at a more modern implementation of a file format that is used for storing packets that were captured. Originally, we had the pcap file that's been around for many years and is widely used and adopted. Later, Sometime around the early 2000s, a bunch of guys set out to create a new standard called pcap-ng, or pcap Next Generation file format. This format was intended to supersede the pcap file format because it had a number of limitations. Examples of the limitations of the pcap file format include not having nanosecond timestamp resolution, and also not being able to store extra data such as data from the operating system or network card, and even storage of comments, because sometimes it'd be really nice to, when you're looking at a long packet capture file and you want to pass it along to your team, to be able to annotate specific packets so you can, when you read it in, you can see a message. All this stuff is very useful for analysis work. Once the standard was created, and I know there was the copyright was in 2004, and I think it expired that year as well, the— for the RFC anyway. The WinPcap team led an effort to create the NTAR library, the Network Trace and Archive Library. If you want to write a tool to use the NTAR format, also known as the pcap-ng format, you would use the NTAR library in your program. So let's go actually down to the pcap-ng Next Generation Dump File Format, open up into a new tab here. And if we go down here to the table of contents, we can see a lot of stuff. But first off, you may have noticed this is actually a lot more complicated than the pcap file format standard. So things are organized in different blocks. In the standard pcap file format, we only had the global header, the per-packet header, and the packet data. For each per-packet header. So in the standard pcap file format, we have one global header and a per-packet header. Here we have a lot of blocks. Each of these blocks store different data that can be used to describe the pcap file or the packets in it. Let's go ahead and scroll down into the— take a look at the general block structure and see. One thing you might notice off the bat is that is that we have length fields. So this actually means that we can keep track of the block size. So the actual block body and such, these are variable length fields. So you can actually store more than just a fixed set of data. You can, you just, you can keep storing, storing data. And that's one of the limitations of the traditional pcap file format is that each field was fixed. If we go down the different block types, we can see that there is a Section header block. This one is the important one. This is kind of like the— if we're taking a look at pcap, this is kind of like the global header, its equivalent. First of all, it has a block type to identify that this is a section header block. It has the length of the header. It has the major and minor version, just like we saw prior, a section length, and a number of options. Take a look at the options here. A few different things are available that are pretty neat. Such as the hardware, the OS, and the user application fields, which actually store the operating system, the platform, and the version number of the application that was capturing the packets. So this is really cool whenever you— so that when you can see what the systems were using whenever they captured the packets. Also in the pcap file format is the interface description block. This is a mandatory block used to describe the characteristics of a network interface. So here you got the link type field, just like we had in the pcap file format to say, hey, we're capturing on Ethernet or whatever other type there is, uh, such as PPP and various other types. And we have the snap link field just like we had in the global header format of the pcap file format. But in the options field, we have more interesting details. We have the interface name, we have the description of the interface, and gives you an example here like net Broadcom NetXtreme. We have the IP address and subnet mask of the interface, and we have the same thing for IPv6, the MAC address, the interface speed, time resolution, even the filter that was used to capture the packets. So here's the actual BPF that was passed. That's really nice so that when using a pcap-ng format, we can actually get a hint into the environment and the settings that were used to actually create the packet capture file. Next, they had the packet block, but this is now obsolete. So this is like— this is equivalent to the per-packet header in the pcap file format, where you have the timestamp and a number of length fields describing the length of the packet that was stored, etc. However, you can see that it's obsolete. There are two other options that replace this. You have the enhanced packet block, which is the same thing except with a few extra fields. And you also have the simple packet block, which is just another container describing the packets that are being stored. You can see in this one we actually have many less fields, probably about 7 less. Scrolling down, we have a name resolution block. This is so that we can actually store the names of IP addresses that are in the packet capture file. That way we don't actually have to look things up all the time. We can avoid issuing a lot of DNS requests if we can keep the resolved names inside the pcap file. Moving along, we have an interface statistics block, which is really nice. I like this one especially. This is so that we can actually store the capture stats inside the pcap file. This is so that we can actually store the capture stats inside the file. This tells us important things such as when this pcap file was created, how many packets were lost, how many packets were captured, what is the drop rate from the network card. Etc. After this block, we have a number of experimental blocks. The compression block can be used to store compressed contents, and the encryption block can be used to store encrypted contents. In addition, the recommended filename extension is .pcapng, as you would— you could have guessed probably. So going back to the top here, This new format offers a lot of improvements over the standard pcap file format. With the new amount of data that can be stored in the pcap-ng format, analysts will be better able to share notes and keep track of the type of systems and the metrics that were used during the collection of the packets. Now I want to make a few notes regarding the use of pcapng files. The NetraSec guys who develop NetworkMiner and CapLoader, a number of other really nice NSM and pcap-based tools, have a nice blog article out on how to handle pcapng files. I'm going to quickly scroll down to one of the points they make that I, that I should note in this video, and that If you're concerned about the improvement with the timestamp resolution, 'cause remember the pcap format uses microstep timestamps, but the pcap-ng format has support for nanosecond timestamp resolutions. But just because you're using the actual pcap-ng format does not mean that the program that you're using to capture the packets will generate the nanosecond timestamp resolution and place it in the file format. It supports it, but the actual application has to be able to do that and the corresponding operating system. Just because the field is available, that doesn't mean that you're gonna be able to store or get those nanosecond timestamp resolutions. The piece of code that will do that is the library that you're relying on for packet capturing. Another thing to point out is that many tools are not capable of loading pcap-ng files. And they spit out a number of errors. We're gonna switch over to pcapng.com, which has a free pcapng to pcap converter. Now granted, you can also use other com— some command line tools such as, uh, editcap, which is included with the Wireshark package to do this, and there are a few other tools available that can do the conversion. But if you wanna do it online, check this website out. Scrolling down to the software that's able to use PCAP-ng. Right out of the box you have Wireshark, CapLoader, and tcpdump. All three of these applications have support for PCAP-ng and can read PCAP-ng files. However, that doesn't mean they can all write files in the PCAP-ng format. tcpdump, for example, does not have the ability right now to write to the PCAP-ng format. But on OS X there was a patched version that's included in the operating system that has support for pcap-ng. Wireshark, on the other hand, does have support for writing to the pcap-ng format. Wireshark writes to pcap-ng by default. CapLoader does have support for reading and writing pcap-ng data. Moving along, a number of popular applications that you would use in NSM to read in pcap files do not support pcap-ng. And below you have a number of popular NSM tools that are able to read pcap files, but when presented with a pcap-ng file, they give some sort of error. Just a few popular ones right there. Now we are going to play with the pcap-ng file format a little bit. So let's move over to the Wireshark wiki. They have under development a page called pcap-ng, which has more details about the format as well as some test files that you can use to play with. And if you scroll down far enough, there's this ntar-test program, a simple program written in C that allows you to parse the header blocks that we talked about in the header section of this video. So we're going to click on the link here. If you go to the download link, you can actually go ahead and pull it down with curl, wget, etc. I'm gonna go ahead and switch over to my terminal window. And I have the C source code already here. So I'm going to go ahead and invoke the GNU C compiler, specify an output file of ntar_test, and then specify the C source code. It's going to compile, got a bunch of warnings. But if we take a look here, we do have a— oops, extra T— an ELF executable ready to run. So if we go ahead and run ntar test, we can see that it takes an argument of the file name that we want to load. I created for this video a sample pcapng file with Wireshark, so I just ran Wireshark on my, on my Mac and I saved some packets to a disk. And it, by default, Wireshark uses the pcapng format, so I'm good to go. And you can see here, file was able to detect using the magic number that is a pcapng file format. And version 1.0. Now we're gonna run the ntar test program on our pcapng file and pipe it to less. So ntar test actually started pulling out the blocks and printing them out. So you can see that block 1 is the section header block. If you recall, this is the block that contains the magic number. The major and minor versions of the pcap-ng file, along with the optional fields for the operating system, the application, and the hardware platform. Next we have the block 2, which is the interface description block, and this contains various network-specific settings, and including the, um, BPF that was used to capture the packets. After we have block 3, and this is where we start our first header that describes a particular packet. So packets actually start after this block. Remember in our prior discussion on the headers, there are two types of packet block headers. There is the simple one and the enhanced one. Wireshark went, when recording this pcap file, with the enhanced packet block header. And this was a version that stored more metadata for each packet. Next we have block 4, which is again an enhanced packet block. So for every packet in this pcap file, there will be an enhanced packet block. And we'll go ahead and skip to the end. You can see that the final block was block 20. So if we account for the section header block, which is the first block in this file. Then the second file was— or the second block was the interface header block. That is 2 blocks, and if we subtract 2 from 20, that means there'll be 18. So that means there must be 18 packets in this pcapng file. Let's go ahead and verify that. We can use tcpdump to read in this, and we're going to pipe it to word count and tell it to only count the number of lines. And here we got 18 lines that were written, so there were 18 packets written to stdout. Awesome. So we can— we just verified the structure of the file was consistent with the data that we— that it contained. Now I wrote a little tool called metacap-ng. It's just more of a proof of concept sample code to use in this video. And what it does, it actually reads in the pcapng file and prints out some data that's stored in the section header block. It does this by reading in the pcapng file and first checking some conditions. It tests the— it tests for the block type. If you go over to the documentation here, we can see that the block type is 0A 0D 0D 0A. And we have that value here to compare against. And if that's true, we then seek into the file format for the magic number, and then we compare the magic number. And if that is what we grab, whenever we parse the file format, then it is a PCAPng file. Once we do that, we open the file And then we start reading in some bytes from the file, specifically the fields for the operating system and for the application, and we print those out. So let's go ahead and give that a shot, and we'll go ahead and pass our file format here. Okay, so it detected the magic number for the pcap-ng format. You can see it says it is a pcap-ng file. It was able to parse out the operating system used to capture the pcapng file, and that is my macOS X workstation. Also, it was able to grab the application. Now, I told you earlier that I used Wireshark, and you see DumpCap here. Well, just so you know, when Wireshark runs a capture, it actually forks another program called DumpCap it actually handles writing the packets to disk. Wireshark then reads those packets in from that file and does the analysis on it. So essentially you have two different programs running whenever you're running Wireshark. That is, DumpCap does the actual packet capturing and writing to disk. So that's why I detected DumpCap. Awesome. Next, what we're gonna do is we're gonna go over to Wireshark and try to get some more information out of this PDF. This pcapng file. So I have the sample.pcapng file loaded here and you can see that's just a bunch of DNS queries. So first off, what we're going to do is we're going to go to Statistics from the menu and click Summary. We'll go ahead and pull this up. And for the capture, Wireshark was able to tell us again what the application is, DumpCap. It also tells the operating system used. It has a comment field specified in the file that Wireshark was able to grab, and that's something I put in there that says sample capture testing for the pcap-ng format. It also has one thing that I really like, which is the capture filter. It can tell us that UDP port 53 was used when the capture took place as the Berkeley Packet Filter. So that's why we only see DNS traffic here. Go ahead and close this out. Let's do a filter for comments. If you do frame.comment, it's a Wireshark high-level filter, not a Berkeley packet filter, but a specific Wireshark display filter. And they are different. You can see that it actually listed the number of— or matched the number of packets that had comments. And if we go down here to the packet comments for the first packet, that is number 7, it says that OpenNSM has a Slack team. And if you actually look at the query, let's open up the DNS name system query, you can see it was a query for opennsm.slack.com. So whenever I created this packet capture, I mean, I requested the IP address of opennsm.slack.com. And in this packet capture file, I made a comment just to indicate, hey, this query indicates that maybe OpenNSM has a Slack team. Go to the next one. So here's a query for goip.nola.com. I'm not really sure what application on my computer made that request, but I said this needs to be investigated. And this is kind of what you can do whenever you're actually working with the the pcap-ng format on a team of analysts, some packets you'll understand, some you won't. And if you need to, you know, do investigations later or do further analysis later, you can put these little comments in here to make it easy. And finally, we have someone may want a new kernel, and that is because the request was to kernel.org. So going back, let's go ahead and clear the display filter. If you want to actually make your own you can right-click on the packet and you can put packet comment and just type something in. This is a test comment. And then Wireshark will then write this comment to the pcap-ng format inside the, the area for comments. So now if we do, um, the filter frame.comment, we now have that new file here, or the new packet here that matched the query now. And this says, this is a test comment. So awesome! This gives you some insight into a few different fields that were recorded in the pcap-ng program. I demonstrated this by using 3 different programs, so hopefully you're more comfortable with it, and now you can actually learn to utilize and parse some of the data yourself. Thank you.
More from Jon


What No One Knows the Podcast / Vodcast featuring The Tampa Bay Wave and Jon Schipp

Meeting the Exposure Management Challenge: Key Use Cases for Success | @OfficialRapid7 #SolutionSpotlight

Spot Security Control Gaps and Non-Compliant Resources Across Your Attack Surface






