Tcpdump - Basics 1
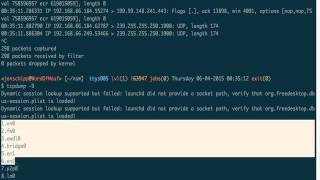
Jon Schipp covers tcpdump basics on macOS: reading capture files, understanding packet output columns (timestamps, IPs, ports, TCP flags, sequence numbers), and how name resolution works via /etc/services. He shows live capture, packet counters, timestamp options, and warns that DNS lookups during analysis can slow large captures and alert attackers.
Chapters
Now it's time to get familiar with tcpdump. So first off, I am on an OS X system, and I have this file available in my directory called nitroba.pcap, which we'll be reading from. And this will be the OS X version of tcpdump, the one that is installed by default, and its version is 4.3.0. Let's begin by reading in this pcap file. So we're gonna pass the -r option for read, the pcap file name, and then what we're gonna do is we're gonna specify a count. This is so we can limit the output to the screen because there's actually a lot of packets in this file. So we're gonna print the first 5, and then tcpdump will exit. Okay, so to get familiar with it, let's talk about the few fields that it prints out for each packet. So every single line is a single packet. First thing to know, and each of these are fields on the line. So the first one is the timestamp, hour, minute, seconds, and microseconds timestamp of when the packet was seen by the system's clock, specifically by the kernel, whenever the kernel timestamped it on the host system that actually received or create— received and created this pcap file. So someone else created this pcap file, right?, and whenever they saw that first packet, their kernel timestamped it and passed it to the TCP/IP program, and that is now the timestamp that is listed here. So this was seen at this particular time from when the person first saw the pack— or the person's computer first saw the packet. Second, we have a protocol identifier here, so this is IP using the Internet Protocol. Next, we have a 4-byte IP address followed by a port. And these is— this is all dotted decimal form. And then next we have another IP address, which is the destination. And you can see that instead of the actual port number, as we saw over here, it says HTTP. And that is because by default, tcpdump will try to resolve ports and IP addresses for you. So 80 would be here, but TCPDump, what it does, it actually looks up in the /etc/services file and replaces 80 with HTTP, which is a field that shows you how to identify a port mapping to a service. Next, we have some specific fields. In this case, this one's only particular to TCP, and that is it shows the flags that are used, are sent in the TCP segment. We have a FIN flag for finish the connection, and then we have this dot, which represents an ACK. Next we have the sequence number, the acknowledgement number, a window size, and a bunch of other options. And more notably is the length 0, which is the length of the payload, and there is not any in this particular packet. And we'll go into further details with the protocols because everyone will be a little bit different. That's the basic structure. You'll have this right here for the actual connection information and the timestamp, and then you'll have the extra protocol-specific data after. So first note that about the name resolution, we'll get started on that because that's actually really important. So let's actually turn that off. So we specify the -n option to say no resolution, and that is does not do resolution for ports as we saw with here, and it does not do resolution for IP addresses to a domain name mapping. So let's run the same command again with the -n option. Now you see that HTTP is no longer there, it is 80. So let's go ahead and change the /etc/services file just to demonstrate how this works. And let's go down to 53— or no, 80, I'm sorry, I want to do the HTTP. Okay, so what we're gonna do is we're gonna change this for the HTTP— for the TCP part. This is a TCP packet that we saw. We're gonna say OpenNSM, just any text. Now if we run this again, you'll see that— oops, I'm gonna need to do the back to the resolution. So now you'll see this .OpenNSM, right? So that's how that works. So if there's ever a case where you need to add your own services, because they're not listed in this large file, because there's stuff— there's things that this will be missing, then you can do that. You can add your own to do the mappings yourself. Okay, I forgot that. Okay, anyways, moving along. The other thing to think about with this name resolution that's really important to know is the time it takes to actually look up are to actually resolve names. So for every time that it has to see a port, TCP/IP actually has to look through the /etc/services file and do a mapping. So it has to read the file each time it sees a packet, and it has to do a name lookup. And DNS requests can take a while. So just to illustrate the time difference, let's just do— let's do, I don't know, um, 1,000 packets here. Mm, and you can see that was 24 seconds. That is without name resolution. Now to do it with resolution, see that we're already hung up here, and we had 3 seconds. There's many more packets in that file. A large packet capture file, that could mean the difference between a couple— it can mean the difference from— so we saw like a couple seconds, but rather in in minutes or even hours. And it's also bad practice. You always want to start with the pcap file with the -n option, especially if you're doing analyst work, because it is possible for— if you have a newly detected attacker or a piece of malware or something, you need to— and that you have the packet capture for it, and it actually does that reverse or that name lookup, it could actually contact one of the attacker servers potentially. And then that would be a way that they, they would know that you made, that you're actually analyzing the file. So that's something to be wary of or be aware of. Okay, so next, let's actually do a further demonstration. So with that, with that, we can actually— you won't see those DNS lookups in here, but you can open another pcap file and actually see it because tcpdump filters it. So let's open up tcpdump. We're going to listen on— you don't actually need two ends, just one. I'm going to listen on my en0 interface, just my hardwired network connection. Card here on my laptop. And then we're going to sniff for port 53, which is DNS. Go ahead and do that, and you'll see there's nothing really coming in right now. But if I do this, then you can see I'm already getting the requests for DNS resolution from this pcap file. And now it stops again. So that is why I want to show you it takes, it takes more processing power for your computer, and it can alert an attacker. So no need to do that. So these same rules for resolution apply to the online mode, which is what we call to sniff on a live interface. So from here on out, on all the other videos in this module, I will be using tcpdump with the -n option to not resolve names or port numbers, and I recommend you do that too. So let's go ahead and list the available interfaces on this particular system. And you can do that directly with tcpdump. You don't need to use ifconfig on OS X or BSDs or ip link on Linux systems. You can use -d, which will look it up. And you'll find out here that I have a number of different interfaces, some virtual, some not. This one right here is my hard interface, my hardwired network card. That I have an Ethernet cable plugged into, and this one here is my wireless interface. So I can then specify en0 just like I did earlier to sniff on that particular one. Okay, now let's look at the output of sniffing on a live interface. You'll notice there's 3 fields at the bottom, and they— the first one says the number of packets captured. That is, that is the number of packets that tcpdump was able to process. Also, when sniffing on a live interface, that is when you are capturing, not reading from a pcap file, you will see this packet received by filter, and that is the number of packets that were received but were not able to be passed off to tcpdump for complete— for a completion of processing. And the difference, discrepancy here between the 16 and the 14 is that I press Ctrl+C to quit tcpdump, and there were 2 more packets in the buffer waiting to be processed, and that's why they do not show up as being captured. So we captured 16 by the filter, but only, but 2 did not quite make it to the status of being fully processed, thus packets captured. And finally, this last one is packets dropped by kernel. And this is a case where if the buffer in the kernel that's storing the packets temporarily ever overflows, then this number will increment. And on some systems, including I think True64 Unix and Ubuntu, I believe has a, has a patch out that their versions of tcpdump actually have a packets dropped by NIC. So it's actually a fourth field out there, and that specifies packets that due to a hardware issue such as maybe buffers in the NIC being low and overflowing, there'll be packets dropped there. So the packets can be dropped at multiple places along the path from the network card through the kernel to the user space application. Next up, we have— I have a discussion of the timestamps. So let's go ahead and go to open the manual page for tcpdump and just search for Oops, search for timestamp, not tcpdump. And the first option we have is don't print a timestamp on each dump line, and that helps you reduce the number of fields on the screen so that if you're not really concerned about the time for a particular case that you're looking at or pcap file that you're browsing through, then you can omit that. That way you'll save a whole field. Next we have the— that's important, I would say, is the print a delta between the current and previous line on each dump line. And then we'll actually look at this etherprint delta between the current and first line on each dump line. So these are nice because they can help show latency information between packets, which could indicate a problem with your host or the network or somewhere in between. So we're going to read from that nitroba.pcap file and I'm going to do -ttt. Whoops, actually I want to do -c for 5, of course, reduce the output. And you can see that we have a relative time here of complete zeros, and then the second packet was seen at— remember, this is the delta, the time between— 0.00845 seconds before or after this line. And then this pcap file was then seen 0.011169 half seconds after this, this particular file. And then this one, this much longer after, 0.02 seconds after this one, and so on and so forth. The other one is— shows the difference or the delta between the first packet, which is a relative, a point with, of 0, and each other packet. So it won't be the difference between the two next to each other, but the first one sent and then the last most one that you're referring to. So you can see between here and the last packet in this one, it took 0.2 seconds, and for each one a little bit less because we're incrementing after each time. So particularly this one over here, this one, this particular feature, the -ttt, which is the difference between the first, the one packet and the one packet and then the one after relative to it, is that can tell you where particular issues of latency could come in. So maybe the question where maybe this one took an entire second, so just imagine this was 1 right here. Why, why was that? Why did that take so long? It could have been the server side on the from where the response is coming from, or it could be the time it took to reach from your router or switch inside your network to your machine, or it could have been a delay actually on your host station, on your host. Maybe your system is bogged down. So it kind of gives you the ability to sense where things are. And one way you can use this is to find patterns for that particular problem that you're keying in. Maybe there's a particular connection or a particular host you're talking to where the latency time is actually— or the delta time is much higher than all the others, and that could indicate an issue with that particular host or the route to that host. So that's something to be aware of.
More from Jon


What No One Knows the Podcast / Vodcast featuring The Tampa Bay Wave and Jon Schipp

Meeting the Exposure Management Challenge: Key Use Cases for Success | @OfficialRapid7 #SolutionSpotlight

Spot Security Control Gaps and Non-Compliant Resources Across Your Attack Surface






