Tcpdump - Extensions 2 (OSX) - Draft
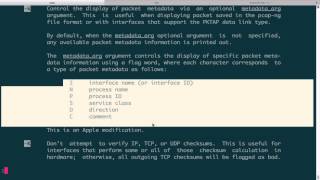
Jon Schipp shows how to use tcpdump on macOS to capture network packets tied to specific processes. The PKTap link-layer header type records process ID, command name, and packet direction. Use the -k flag to display PKTap fields and -Q to filter by process name or PID.
Chapters
Let's take a look at some of the extensions or modifications that the tcpdump application has on OS X. To begin, let's start off with my version of OS X. I'm running 10.10.3, and the tcpdump application is 4.3.0, which is a little outdated. And you can see that Apple tags their own versions here, so when they make modifications, they do put their additions there. So first off, open tcpdump, the man page anyway, and search for the word "apple." You'll find out there's a number of things that match "apple," and these refer to their modifications in most cases. So you can check those for more information. To begin, we're going to talk about the pcap-ng format, which is supported on OS X. So go ahead and start tcpdump, no name resolution, -i for specifying my interface, listen to my wired interface which is en0, and then I'm gonna use the -P to say, hey, let's do the pcap-ng format, and then I'm gonna write it to test.pcap-ng. Okay, I have macports installed, so it's actually picking up from that version. As you can see, there's no apple-modification tag here, so I need to actually use the full path to specify, um, the specific options for the Apple version. Oops. -P -W test.capng. There we go, now it's working because this version, the Apple version, has this option. Okay, that should be enough. And they had 61 packets there, so now we can take a look. And it just says data. Well, this is actually because my version of OS X doesn't have the actual magic header number or type for that file in the file database. So we can just test some things real quick. So what I'm gonna do is I'm just gonna go ahead and move this file to my VM that's running. I'm not permitted. Okay, so it's there. Now let's check it out here. So it's now in this, um, Vagrant directory. There it is, test.pcapng. Let's do the file on that from Linux. You can see Linux was able to verify because it has a more up-to-date file database for the magic numbers, and it's able to say, hey, this is a pcapng capture file version 1. Awesome. OS X has this really cool link layer header type called PKTap, or packet tap. This is just a more complex data structure— I shouldn't say complex, but it has a larger data structure that fills in more information that's pulled from the OS and the network level. So let's go ahead and tcp1.org and click on Link Layer Header Types. Then we'll go ahead and search for PKTap. You can see we found it right here. It says it's an Apple PKTap capture encapsulation. Here's the data structure here. And first off, um, just a bunch of fields that are filled out with interesting information. And then below that, you actually have the payload information, which is all the normal regular, data that would be there. Probably it would be IP because this is abstracted out and this is encapsulated. Um, so the Ethernet packet would be in here and the IP and so on and so forth. So essentially this just adds more on top. So what's really cool about this is the fields like process ID or command name or service class, interface type, etc., that can be stored. So this is a way that we can actually use to associate packets to processes, which is very, very useful. So we have this, all this extra data available to us. So first off, PKTAP is not a real interface, it is just a link layer type, header type, that TCPdump supports because, and then that the OS X operating system can, has the PKTAP infrastructure or the code that will actually store these values, and then with this link type that TCPdump is able to read from those, this data structure. So let's go ahead and go to the terminal window and begin starting with tcpdump. We're gonna use the one included with OS X, and when we specify -i, we're actually gonna specify the pktap interface, which by default just listens on all interfaces, and we're gonna run that, print the first 30 packets, and you can see that the data link type is pktap. And right now there's nothing too interesting, just looks like the normal data that we typically see. Um, so what we can do to specify, hey, only I want to run pktap, but I also want to have pktap just listen on en0. By itself, it just listens on all the interfaces available. If I specify pktap, en0, it just opens a pktap link type over en0. Again, it's gonna be about the same. So now what's cool is we can specify this -k option, which actually starts printing out some of these fields that were stored. You can see with this packet right here, actually it's a— let's wrap it around 3 lines now. So let's just go ahead and pass the -q option to put it in quiet mode. It'll print less data. There we go, much easier to see. So we have the en0 interface, you can see it started with the packet. Also the process, and here it says Slack, and which is the chat client I'm using, and then it has a number after which I imagine is the process ID. Let's double check that. Yes, the process ID is 11513, and that is it right here. A service type and the direction, or service class and then a direction, which is really cool. So this is going out. So this is some of the information they can provide, but we can also specify filters for this. So let's go, um, with a -k, you can pass or specify an optional argument, and -i is for interface. We'll just print the interface. There you go, you can see it's just the interface now. And you can do, um, -p for the process ID, and there's a few of them available. Go to tcpdump man page and go -k And here they are right there. You can take a look at all those. Yeah, so that's, that's a really cool way to do these things. Also, you can do— you don't actually have to use the tap interface. You can actually get some basic information that OS X stores, but not as much as you do up here. But you can just use cat or the -k by itself on the en0 interface. And you can see that it shows a little different format, but that it's, uh, this packet came from Google Chrome, a web browser, on, um, process ID 1803, and it shows you the service class is BK, etc. But you can't, in this particular case, you can't, the filters do not work because it doesn't have the full PK, um, tap structure to work with in this case. So, but that is actually a really cool, so, um, one of my favorite features of this. This extension across all of them. There's a few more pseudo-interfaces that OS X comes with that you may not know about. So on Linux, to listen on all the interfaces, you have the any interface. Well, on OS X we have the all interface. That's one way to listen to all information. And Linux also uses the pk— or uses the cooked link header type, but in this case it's using pktap to take advantage of this, or packet tap, to take advantage of these, this feature to be able to do a little abstraction across all the interfaces. Also, you can do the same thing with just listening on pktap that also will do listening on all interfaces by default. And there's one more that's kind of interesting, it's iptap, which just is a pseudo interface only for IP traffic, so other traffic will not match that. Will not be available on that sudo interface when you're sniffing. Another really awesome feature that extends the capabilities of the pktap data is the ability to perform filters on them. Let's open up the tcpdump man page, search for METADATA, metadata in all capital letters. You'll find a section called packet metadata filter, and this is what you can use to analyze the pktap data or data that has fields, those fields that are stored in a pcapng file. So we can see that there's a few different ones we can use, different primitives to actually pull out the information we want. So first off, let's start off with working with the process name because that'll be easy, an easy example to key in on something you're wanting to see the traffic of. So go ahead and Start running tcpdump here, and I'm gonna say "pktap interface," and then what I'm gonna do is I'm gonna say "-k," and then I'm gonna use the "-Q" option, capital Q, to actually specify the filter. I'm gonna do "proc=" and Slack because I want to listen for packets that are from my Slack application, which is my chat service that's running in a different window right now. Voilà, we already have a few. See, proc is Slack, proc Slack. Excellent. And then let's try or proc equals TweetDeck, so I also have TweetDeck running. Okay, so we see a bunch of Slacks right now. There's TweetDeck there. So now we have TweetDeck and we have Slack stuff right there. Awesome! Let's further build out the filter. Let's go ahead and add a grouping, and we'll say AND direction equals in. So this will only match packets coming from the outside to my 192.168.66.183 machine at this time. You can see that if you look at the right-hand column, it's all just my IP address. That is working. Also notice that there is a metadata filter drops too. Actually, more, more processing has to be done there, so just be aware that you can drop packets from the metadata filter, which is separating it from the traditional PPF filter here. But this is mostly probably because I hit Ctrl+C and didn't really— it had a bunch of packets in the buffer that weren't processed quite just yet. So take a look again at the metadata packet filter. I believe it was the exact match. Nope, metadata filter— nope— metadata packet. Really? Let's just search for metadata again. Okay. And you can see there's a number of different operators you can use. We used a couple of them like OR and AND. And you can also do a few more for the interface name and the PID and the effective process ID and name or the service class. So there you go. Now I do have an example you can use to build on, but essentially what we were doing right there is building our own. So yeah, that's a really cool way to find— to make filters that are associated with your application. So instead of doing it on ports where you have multiple ports potentially and you need to just look for traffic that goes to one particular process running, then this is a great way to do that because it solves the problem.
More from Jon


What No One Knows the Podcast / Vodcast featuring The Tampa Bay Wave and Jon Schipp

Meeting the Exposure Management Challenge: Key Use Cases for Success | @OfficialRapid7 #SolutionSpotlight

Spot Security Control Gaps and Non-Compliant Resources Across Your Attack Surface






