#2 How Data Science is Impacting Telecommunications Networks (with Chris Volinsky)
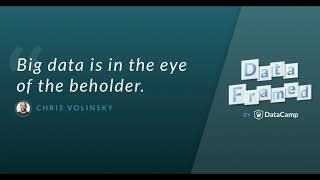
Chris Volinsky, AT&T's Assistant VP of Big Data Research, discusses how machine learning powers telecom networks. Predictive modem reboots cut customer-care calls by 15-20%. He covers fraud detection, churn analysis, 5G placement, and why simple techniques like linear regression often beat complex models in production.
Chapters
In this episode of Data Framed, a Data Camp podcast, I'll be speaking with Chris Volinski, assistant Vice president for big Data Research at AT&T Labs and a member of the seven person four country team that won the $1 million Netflix Prize, an open competition for improving Netflix's online recommendation system. We'll be discussing the role data science plays in the modern telecommunications network landscape and how it helps a company that services over 140 million customers and what statistical and data scientific techniques his team uses to work with such large amounts of data. I'm Hugo Bown Andersen, a Data Scientist at DataCamp and this is DataFrame. Welcome to DataFrame, a weekly DataCamp podcast exploring what data science looks like on the ground for working data scientists and what problems data science can solve. I'm your host, Hugo Bown Anderson. You can follow me on Twitter HugoBown and you can also follow DataCampattaCamp. You can find all of our episodes and show notes@datacamp.com community podcast. Hi there, Chris, and welcome to Data Framed.
Hi, Hugo. Nice to be here.
It's great to have you on the show. I'm really excited today to be talking about how data science and statistics are impacting telecommunications and your work at AT&T. But before we get into that, I'd like to know a bit about you. So my first question is, what are you known for in the data science community?
No, I don't, I don't know how well known, I am actually. But, you know, I've been here at, at&t leading the data science research group for 20 years and, well, I've been leading the group for, for five years. And, you know, I think we're, we're, we're one of the, you know, few remaining industrial groups that still put some energy into publishing and going to conferences and stuff in addition to providing value to AT&T. So I like to think that our group is known for being a good, solid research group and doing some really good data science. I guess the one little bit of fame that I had is I was part of the team that won the Netflix Prize, which was back in 2009. But I think that had had some impact in the data science field and I'm really proud of that experience.
And so when you say industrial data science research group, what do you mean by industrial?
Well, we're run by, you know, a for profit company. It's not academic or a government research institution. You know, at, AT and T, we have the heritage of Bell Labs. And even though a lot has changed since the days of Bell Labs when companies would have large scale research firms that were like little mini universities. That's what Bell Labs was like. We still have that heritage. So, you know, we still are a research organization. We hire PhDs, we publish papers, go to conferences. We're not the only ones who do that. But I think it's perhaps less common than it was years ago. And you know, I think it's really exciting to be part of a company and an organization that has that heritage of Bell Labs.
And how did you get into data science originally?
Well, you know, my history is in statistics. So I was going to school in statistics at the University of Washington and I was kind of taking the regular old route of going to get my PhD and assuming I was going to be in academia in some field of Bayesian statistics, which is what I was studying at the time. And one summer I got the opportunity to do an internship here in New Jersey at AT&T. And I didn't know much about what the group was doing, but you know, it was close to, close to my family and I thought, why not take that experience and see what it's like. And the first day I was on the job in my internship, I went into my mentor's office and he said to me that it stuck with me forever. He said 90% of what you learn in graduate school is completely irrelevant to what we do here. I didn't understand what he meant and I thought that was kind of amazing. What do you mean by that? He said, because the scale of the data that we're looking at, this was back in the late 90s, so this was before Google and Facebook, before big data was a thing. But at the time, AT&T had some of the largest data sets in the world, just by nature of the telecommunications business. And he said to me, the scale of the data we look at here, a lot of the things that you're learning, they either don't scale up or you can't apply them at this scale. And we have to invent new technologies and we have to do perhaps create ad hoc things that haven't been invented before. But the things that we're doing are impacting customers and impacting the business in a daily fashion. And so I spent that summer working on fraud detection problems and churn analysis. And I just found it, I found it terribly exciting to be looking at large scale data sets that were based on real customers interactions with the network. And it was really, really exciting to me. So that worked itself into a job. When I got out of grad school and I've been here ever since. And you know, at the time we just called it large scale statistics or you know, that was when the KDD conference was just starting. So we used to call it knowledge discovery in databases. And then that, you know, turned into what we now call data science and big data and machine learning. The name seemed to change every couple of years, but for the most part I've been working in large scale analytics for the last 20 years.
There's a lot of interesting stuff in there. Something you spoke to that I find really compelling is the gap between what happens in education and what happens in jobs, in business, in industry. And do you still see a large gap between education and what you need people to do when you hire them?
Yes, I do, in fact, and I think a lot about it, particularly in my field of statistics. I think that some universities have figured out that they need to change their way of teaching in order to equip students for the workplace. But many statistics departments, I think are still taught in kind of an old school mathematical way. Teaching asymptotic theory with small data sets in a way that is great for academic thought and bringing forth new methods, but not necessarily training people for the jobs that are out there today. I think computer science is doing a better job of it in some places. There are machine learning organization machine learning departments or even physics departments or other quantitative departments that are training people in data science fields. But I think that's why we see a large growth in machine learning and data science master's programs out there right now. And I think it's because some of the traditional academic departments are not adjusting well enough to train people for the jobs of today.
And that's really training people to analyze data, which may not happen in statistics departments.
That's right. Or not analyze real data. You know, the statistics departments, there's a lot of, and I'm speaking generally now, obviously there's a big variety in what departments do, but often things are taught with data sets that have been used forever. You know, if I had a dime for every time someone looked at the IRIS data set, I'd be a rich man now. But you know, there's a lot of really interesting and fascinating large scale data sets that can be use to build courses around. And I think the departments that get it are starting to use some of those.
So what are some of the biggest challenges facing telecommunications networks today in your line of work?
Well, you know, the challenges of running telecommunications network at scale is huge. Right. So we have at AT&T, we have over 140 million subscribers on our mobile service. So trying to make sure that each one of those customers has a great experience is really, really important to us. And so managing a large, complex network entails a lot of interesting data analysis that kind of keeps us busy. In particular, we're trying to change our network from a hardware based network like it's been forever to a software defined network. And you know, AT&T has led the charge in the industry to, you know, build out a software defined network that can be nimble and, you know, serve our customers for years to come. And the reason that's interesting from a data science standpoint is that once you change your network from hardware to software, then you can do a lot of things at the edge of the network with analytics that you couldn't do before. So in the old days, if I wanted to make a change, if I built a model to look, some anomaly detection model to look for say, cyber security issues and I needed to make a change, I might have to go and install a new piece of software and some switch out in the network. Now with a software defined network, I can sit at my desk and make an update to a machine learning model and have that implemented within minutes. So that's a really exciting change for us. And the ability to have adaptive machine learning models that can learn from the data and adapt as it sees data and change as the data changes is much more capable now with a software defined network.
And do you run experiments around these types of tests at all?
Yeah, again, once everything's running in software, it's much easier to do things like AB testing and just constantly test and learn so that you can make those, those models as good as they can be and learn from the great machine learning algorithms that are out there.
How about, I mean, you said 140 million million customers, was that right?
Yeah, yeah.
What about customer care?
Well, customer care is a huge, a huge area where we do a lot of, a lot of work and so we receive. There are hundreds of thousands of touch points that we have with our customers on a, on a daily bas, whether it's someone walking into a store or someone calling one of our customer care lines, or someone engaging with us on a customer chat online. It's a challenge to make sure that we can serve these customers as quickly as possible and get their issues resolved as quickly as possible. One example of a really neat problem where we use machine learning to aid our customers is in our broadband service. Our customers who have Internet with at&t when they call in with a customer care issue, often problems can be solved by a simple reboot of the modem, you know, when the service is coming into their house. And so we ran an analysis where we looked for, you know, predictive signs that, you know, based on the diagnostics we see in the network, that a particular customer might have one of these problems that we could fix by rebooting their modem remotely. And so we ended up getting to the point where we could predict it well enough that we would do a predictive or proactive reboot of their equipment. And we could show that in those cases we could reduce the. You know, first of all, we would solve their problem before they even bothered to call in or even might even have known that they had a problem in the first place. And we could reduce customer care calls by 15 to 20%. And we could reduce dispatches by 15 to 20%. So by by implementing a really good predictive model, we could both improve the customer's experience and impact the bottom line for at&t. So that was a really good example of a win win.
And so it sounds like machine learning is playing a huge role in what you guys are doing.
Yes, yes, absolutely. Although, you know, it's hard to draw the line between what's machine learning and what's statistics and what's AI. I don't want to try and do that. Other people have tried to do that. I always find they're pretty. They're pretty bl. The pretty blurred lines. But, you know, the idea of building a model that can learn from repeated from additional data or can take action and then learn from and get better from understanding whether or not the action that it took had a benefit. I think, you know, those are definitely techniques that we use regularly within the telecommunication space.
Yeah. So building models, model building, running experiments. I presume you have a lot of geodata as well. So is there certain inference you do around different locations and that type of stuff?
Yeah. So look, location data is something we work with a lot. There's a lot of location data from the mobile devices in our network. One thing that is something we're working on very much in recent years is a rollout of our 5G networks. So 5G networks are going to roll out by 2020. And one thing about the technology in 5G mobile networks is that you need more transmitters of the signal in order to get it to the customers. So in order to roll out 5G, one thing that we need to do is augment our network with a lot of what are called small cells. So these small cells are smaller antennas. They're smaller than your standard telecom pole that you see on the side of the road, maybe covered with pine branches. These are small cells that can go on top of buildings or on top of ro, apartment buildings, things like that. And we need them to augment the signal that we have out there so that we can serve all of our customers when we roll out 5G. So understanding where we need to put these small cells in a cost efficient way that can give us the maximal coverage. This is an opportunity to use spatial analytics and spatial statistics and other geospatial methods as well as visualization methods to help the business understand where to put these small cells.
That really leads me to wonder when you bring results to either business managers or people in product who make these decisions, how it's actually implemented. So I suppose my question is how does the statistics and data science team, how is it embedded in ATT such that your research is made deliverable or productized?
Yeah, it's a great question. And it can be, you know, every, every project is unique. You know, we, we sit in a, in the labs, in a research arm. And so I don't have any production resources at, you know, at my disposal. So I have to work closely with, you know, our technology development teams or other teams that build production systems or in the case of the network, work with the network organizations to make sure that the insights that we learn and the models that can get implemented into, you know, into the business. And I think that research to development process can be a really messy one. And I think anyone in an industrial research organization will tell you that that's a real challenge. And because the way that a labs team or research team might address a problem is very different than the way a production team might. So you need to get those groups together as early as possible in the process so that they can understand what we're doing and we can understand how things might need to get into, to ultimately get into development. Because if we use a tool for our research that the production team isn't familiar with, then there's very little path to get the insights that we get into development in the business.
Yeah. So your team works in research. There is a model though in which data scientists are embedded in other teams as well. Does that happen at, at and T all?
Yeah, it does, it does. So I think what you're finding nowadays is that teams are hiring their own data scientists. We've also got a business unit in AT&T called the Chief Data Office, which has a whole bunch of data scientists that get dedicated to particular problems with particular business units. And so in some cases, that's a great model for work to get done because you really need to have somebody embed themselves with a team in order to get that subject matter expertise to benefit the business.
Now for something completely different, we're going to dive into a segment called Stack Overflow Diaries with Data Camp's very own curriculum lead, Cara Wu. What's up, Kara?
What's up, Hugo?
What are you going to tell us about today?
In this segment, I'm going to bring you interesting data science questions that come up on Stack Overflow, which is a website where people can ask questions about programming and get answers from the community. So today's question comes from the R programming section of Stack Overflow and the question is how do you reshape data from long to wide format in R? So I'll explain a little bit about what long and wide format means and why you'd want to move between them. So let's say you have data on the daily air temperature in two cities. In wide format, you might have two rows in this data set, one for each city and then separate columns for the temperature on each day. And so since you have all of these columns, the data is very wide. In long format, there would be a row for each city and date pair and all of the temperature values would be in a single column, which results in a data set that has fewer columns overall, but more rows. So we call it long as opposed to the original wide version. So the question is, how do you switch the data from long to wide in R? And I picked this question because it's a really common scenario that data is not in the format that you need. And there are actually lots of different ways to reshape data in R. So I'm not going to go through every single answer because there are a lot on this question, but here are a few. The top answer to this question uses the reshape function in R, which is a built in function that doesn't require any external R packages to be installed. So it's handy from that standpoint. And to do the reshaping, you call the reshape function on the data and specify some arguments to the function that tell it exactly what you want it to do. So in our example, we'd want to set an argument called IDVAR to the city name and then set the timevar argument to the date and then the direction argument to wide, indicating that we're going from long to wide. Another answer recommends the spread function from the TIDR package. So TIDR is a package specifically devoted to doing exactly this type of operation of converting data from long to wide and vice versa. The spread function makes long data wider and then there's a corresponding gather function that takes wide data to long. One other option that is mentioned on this question is to use the datatable package, which has a function called dcast again to do this exact same operation of moving from long to wide. Data Tables functions tend to be quite efficient, so this can be a good option if you're working with a huge amount of data. So there you have three answers to the question of how to reshape data in R and I'll post a link to the question in the show notes so you can take a look at these answers and others.
There you go. Three ways to make your long data Wide data rarely comes in the shape you need it, and these tools are a valuable part of any data science toolkit. Thanks Cara, for reading a page from your Stack overflow diary.
Thanks Hugo, and see you next time.
Let's now return to our interview with Chris. So you've spoken to, as we said, a number of techniques, whether it be working with geolocation data to building models to experiment statistical inference. And, and you've been doing these things for, for a significant amount of, amount of time now. Are you still learning new tech techniques and finding questions that you're not sure how to answer? So you need to build, build new methodology, methodologies and techniques?
Yeah, I think it's, you know, if you're not, if you're not always learning right, then you're doing something wrong. I think, you know, you know, especially with the explosion of deep learning techniques over the last, say five years. Obviously neural nets and deep learning has been around for a long time, but certainly I think they've come into the mainstream in the recent years. And so it's not a technique, to be honest, that I personally was familiar with or even that my team had done a lot of. So you make sure that you take whatever courses you have to and you learn the technology, you read the right papers, maybe you hire people who are more knowledgeable in that field and you make sure that you're constantly learning and understand, understanding what problems it can be relevant for and understanding what problems it's not relevant for is probably the most important thing. You know, you don't want to just something like deep learning can be a hammer that you try and, you know, pretend everything's a nail for, but you know, you need to understand what, what it's really suited to, to, to help you with. And you know what? It's not. Yeah.
So one of the things that's been a running thread through this conversation is the scale of the data. Whether it be 140 million customers or petabytes of data coming in every day. I want your help to demystify this concept of big data in some ways because it's a buzz term, it may contain some meaning, which I'd like your help to get out, but it's something we hear a lot about. So I'm just wondering what your take on in inverted commas big data is and what role it plays in your work.
Yeah. So, you know, I think big, big data is in the eye of the beholder. Right. You know, big data for one person or one team might not be so big for someone else. I mean, if you have a, you know, a researcher in a particular scientific field and they don't have access to, you know, the scale of computers that I have access to AT&T, then, you know, big data might mean something different. But I think the way I define it is if you can't do the analysis on the machine that you own, on a single machine, it's big. If it requires some kind of parallelized infrastructure like Hadoop or some other cluster system to store and analyze your data, then that's pretty big. Because what it means is you have to alter how you analyze the data because of the size of it. Once you have to start amending how you would analyze or study the data based on how it's stored, then we're starting to get into the realm of big data.
This is something you spoke to earlier that when you started your internship, your boss said, what you've learned at college doesn't scale to what we need to do here. And I was just wondering what type of methods was he referring to that someone would learn at school? That just doesn't apply when they work with the size of data that you do.
Well, you know, in statistics you learn a lot about hypothesis testing and estimation and P values and, you know, when you get to large scale data, everything is significant right there. Your P values are always going to be small and almost every hypothesis you test is going to, you're going to reject that null and it's going to be significant. So that's not the right way to think about the problem, probably because it's not very informative to just determine whether a certain parameter estimate is significantly different from zero. For instance, since then there have been lot of new methods. But you know, things that you do, like clustering, right. You know, clustering and the naive methods are, you know, you need to invert matrices and you need to, you need N squared operations, and you just can't do that with large, large data sets. So you have to think differently. You need to. Sometimes you might have to come up with an ad hoc method, some scoring method whereby you don't necessarily know what the asymptotic properties of that method are, or you don't necessarily know how theoretically rigorous it is. But, you know, you can justify some things based on simulations or permutation tests and hope for the best and maybe try something that you don't know if it's theoretically valid and, you know, do some A B testing to see if it helps you, say, fight fraud or reduce churn and take this iterative path of trying one thing, learning from it, and trying something else, as opposed to sitting down and understanding the math and the asymptotic properties before you get started.
So could you give an example or two of where you would find this type of application?
Yeah, I think in a fraud detection application, sometimes you just need to understand, try and understand where you're seeing anomalous behavior. And there's not necessarily any model that's going to point you towards finding anomalous behavior. And when you're looking at billions of records on a day, sometimes you just need to apply some ad hoc method to find something that looks weird and then go explore the weirdness and see if it, you know, dive into it, go back to the raw data and see if it looks like fraud.
Something you also spoke to was that when you get big enough data or enough data, anything will be statistically significant. And this is actually a topic close to my heart. I previously worked in applied math in the biological sciences. And so that's a field in which hypothesis testing, I personally think, is overused consistently. And the fact that people are looking for significance as opposed to first reporting on the effect size, which I think you're also speaking to, is a big challenge that we want to know how you do an experiment, right. And you want to know what, what the effect actually is, if it's statistically significant. That's, you know, you need to state that afterwards, but you want to know what the effect size actually is.
Yeah, yeah. And of course, you know, in academia there's so much that's driven by being able to publish. And in order to publish, you need that, you know, that significance test and, you know, in the field of statistics, there's a little bit of a revolution going on right now because there's a lot of discussion around is P, you know, equals 0.05, the right method to use or the right limit to use, or should we be using p values at all? And I think, I think those fields are starting to come around, but there's a lot of institutional inertia around these, you know, the old methods of significance testing, and it's going to be hard to break.
So I don't want to get too technical, but I actually can't help myself half the time. You mentioned at the start of our chat that you're working in Bayesian statistics. I'm wondering if you see a future in which Bayesian statistics can help us actually out of this challenge, this P value challenge.
Yeah, well, I think the Bayesian framework of thought is very, very powerful and with the idea of having prior beliefs and then updating them through data. Back when, when I was in school, there was a raging debate between Bayesians and Frequentists. But I think, you know, now I think the Bayesian thought has permeated a lot of, a lot of science. And I think that, you know, Bayesian methods do help you thinking about large data problems, you know, and the idea of a posterior distribution and updating priors through data. So I think that it's certainly one method that helps us in this world of, of massive data sets.
And do you use any Bayesian inference thinking statistics in your work at att?
You know, currently I don't. I mean, there's some, there's some Bayesian projects sprinkled around that I know about, but I don't currently use any. I can't say that I'm working on any Bayesian projects right now.
We all know how much data there is growing daily at the moment, and I'd just like to have a conversation about ethical considerations to your mind, about the concentration of data about all of us, you, me, every other civilian in the hands of big businesses.
Yeah, you know, I'm just like anyone else as a, as a consumer, you know, with the concerns about where my data goes and who's using it and who has access to my personal information. And, you know, I think where I, where I've kind of fallen in that, in that realm is obviously there's a lot of companies out there that have information about our searching or our friends or who we talk to or who we communicate with. In most of those cases, I'm willing to let them have that data because I'm getting a service back from them and I don't want them to use it for things that I don't want them to use it for. For me, the key word that I always think about when I think about this topic is transparency. If I know what a company is doing with my personal data, then I'm a lot more comfortable with it. If they have a clear privacy policy, I might have to go to their website to look it up. But if it's written in a clear and concise way that I can understand as a consumer and I can see what they're using my data for and they're willing to tell me what they're using my data for, and if I have a clear and easy way to opt out of any uses of the data that I, that I'm not comfortable with, then that's, you know, that's a bargain that I'm willing to make as a consumer. And I think, you know, in today's day and age, consumers need to be educated about how companies are using their data. And companies need to build trust by having clear privacy policies and having easy ways for consumers to know how they're, how they're using their data.
And as we see this proliferation of, of data, we can see that it could actually be used to tell us a lot of things about society. I mean, social network data, we see all types of trends, trends emerging. How can the data big businesses have. But you've for this type of social research to your mind?
Yes, yes. So we were, we had, we had done some research years ago on using location data to try and understand how people move through cities. This was research where we were using location data in a completely anonymous and aggregated to understand, you know, how people move through cities. And the goal was to provide services to cities and municipalities so that they can make their cities more green and more sustainable by understanding how to make more efficient the flow of people and vehicles through their towns. And so by using technology or using data from like a telecom network, we could understand how long people were spending in commutes and how long they were stuck at red lights and how long they were stuck in traffic. And also where the kind of growth areas were in terms of where businesses and residences were opening in a particular municipality and that would help them develop their 5 and 10 year plan so that they can make their cities more efficient.
So you mentioned something there which I just want to hone in on. You said data that's totally anonymized. What, what does that mean?
Well, so, for instance, if you're trying to understand the. The flow of commutes from one town to another, Right. If you're doing that analysis, it doesn't matter. There's no identifiers that matter on the phone. We don't need to know who owns the phone. We don't need to know the household or person phone number, any account identifiers. We just need to know that there's a device that went from Morristown, New Jersey, to New York City on a daily basis. Right. And so as a researcher, I don't need to have access to any of that private information, so I don't get access to that private information. I can just use the aggregate information that doesn't have identifiers on it and use that. And so companies like AT&T have very strict processes to give access to sensitive data for research purposes, very similar to what you would see in a irb, in a university.
So you're also known for winning the Netflix Prize.
Yeah, it's kind of an old story by now, but it is a good one, I have to admit.
Can you just give me the elevator pitch on this competition?
Sure. So back in. I think it started in 2006. Netflix was a much smaller company then than it is now, and they realized that giving people recommendations, good recommendations, was going to be crucial to them growing as a business. So they did something very clever and very novel. They released a whole bunch of data on their customers, again, anonymized data on their customers, how their customers rated certain movies. And they released that to the public, and they had a competition to see who could build the best recommender system. So they released a training data set of about 100 million ratings, and then they had a holdout set of about 2 million ratings. And you had to use the training set to make predictions on the test set. And they knew what the answers were. So if you could build a recommender system that predicted what the people in the test set, how they would rate those movies, and you could get, you know, below a certain error threshold, you'd win a million dollars. And it was. It was. It was great fun. There were thousands of teams that participated from around the world and industry and academia and people who were just, you know, hobbyists. The competition went on for three years, and we had a team at AT&T that collaborated with a couple of other teams, and we ended up taking home the grand prize.
This strikes me the type of data science or statistics or modeling that you do in a competition like this just seems to me really distinct from the type of work you do at, AT and T. Is that the case or am I incorrect?
Well, you know, it's funny, I was going to say earlier when you asked about the challenges in telecommunications companies. Telecommunication companies are a lot more than telecommunications these days. So at, at and t, we merged with DirecTV a couple years ago. So now we're a TV provider as well, in fact the largest in the country. And we've also had our U verse service with a couple of million households delivering TV for a couple years now. So recommender systems are actually really important to us here. And so back at the time of the Netflix prize, I think we realized that it was a technology that we wanted to be really good at in order to help us grow into the space of being a TV provider. And so at the time, it did make a lot of sense for us to compete in this competition. Now, the modeling that we did, I think we learned a lot of really valuable things and I think helped to advance us and the other competitors. We helped to advance the field of recommender systems. As a result of the prize. There was a fair amount of what we did during the competition that was very specific to that data set and maybe didn't generalize quite so much. But a lot of what we did learn by participating in that competition ended up being valuable to us as a TV provider.
My understanding is that like a lot of machine learning competitions, though, your model that won the competition was not implemented, is that right?
No, that's not exactly right. So, you know, the competition had a few stages. I'd say in the first year of it, we were really developing new models and doing some novel things and to analyze this data set in different ways than had been done before and in ways that ended up being very valuable to Netflix and did get implemented in their system. The later stages of the competition was really trying to squeeze blood from a stone. And one of the most interesting things that came out of the competition was the power of ensemble methods. And so by the end of the competition, we were combining and averaging together literally hundreds of different models in a huge ensemble that was weighted by some complex neural net in order to just very much get 0.001 off of the root mean squared error. Those methods, those massive ensembles, are not really, they're not really appropriate to use in a production system. So those kind of last minute methods that used to actually win the competition and kind of bolt ahead in the last day, those weren't very valuable to Netflix. But the things we did in the early days. Some of the work on matrix factorization and nearest neighbor methods were very valuable to them and did get implemented in their system.
Yeah, cool. That's actually what I meant, that the final solution wasn't used in the way that it was developed because it wasn't productizable. And I suppose I was, as you are speaking to the fact that the incentives of such competitions aren't always aligned with the incentives of what companies need to put into production.
That's right. And I think the Netflix prize was the first of its type. I think if they were to do it over again, they would have had a time limit on it as opposed to a threshold of the error. And you'll see that those types of competitions that are done now have learned from that. They have a competition that runs for three or six months. Kaggle competitions are typically on the scale of a couple of months. And that way you learn something and you hopefully provide some value and then you move on to the next problem.
And now it's time for a segment called Data Science Pitfalls with datacamp's very own curriculum lead, Spencer Boucher. What data science pitfall are you going to tell us about today, Spencer?
Today I'm here to talk about social bias in machine learning algorithms. Algorithms often get a lot of praise for being more objective than humans are when making important decisions. But this turns out to not always be necessarily true though.
For example?
Well, one high profile example was a study out of Carnegie Mellon from 2015 which revealed that women were actually shown fewer instances of one particular ad relating to high paying jobs than men with identical browsing habits. Which ads to display to which people. That's a perfect example of a decision that no human made explicitly. But even so, something like gender bias can still sneak in. Another analysis in 2016 by ProPublica demonstrated bias in the recidivism risk scores that were being used in some judicial settings. These risk scores were algorithmically generated likelihoods that someone convicted of one crime would go on to commit another. Black individuals who never committed another crime were actually more likely to be categorized as high risk, while white individuals who actually did go on to commit another crime were less likely to have been considered a risk.
So what can cause things like this to happen?
That's the thing with black box models in general, Hugo. You don't always have super great visibility into what exactly is causing something like this to happen. One way though, that we can get biased models is simply if the data that we feed it is biased. But that's not even the end of the story because those models will then go on to make biased predictions which result in biased decisions that are going to be affecting people in very real ways. Those biased decisions are then going to go on to produce even more biased data and then we're even worse off than where we started.
Can you give a concrete example of this feedback loop?
Yeah.
So here's a hypothetical example to illustrate how something like this might happen. Say you've got a model that predicts where crimes are likely to occur in the future, then it would only seem natural to direct a larger proportion of police resources into the neighborhoods deemed higher risk. Unfortunately, that means that a larger proportion of the crimes that are happening in those already high risk neighborhoods are going to be detected and recorded. So now we've got a self fulfilling prophecy because the response variable here isn't actually crime, it's crime that has also been detected.
So what's the takeaway here, Spencer?
We all dream about our models resulting in concrete actions that affect the real world. But as a data scientist, it's also part of your job to be on the lookout for bias creeping into your models and to figure out how to deal with it appropriately. Because if you're not doing that right on the front lines of your data science, then it's possible that nobody will.
Thanks Spencer. And listeners. If you found this segment thought provoking, be sure to tune in to the next episode of Data Frame with Claudia Perlich, chief scientist at Distillery, in which we dive deeper into algorithmic biases in the context context of online advertising and discuss potential causes of such biases. Spencer, thanks once again.
Thank you, Hugo.
Time to get straight back into our chat with Chris Volinski. So recommended systems are everywhere now. I mean, even when, you know, we have different apps, push things to our phone constantly that hopefully we'll enjoy and like, a lot of the time it works. A lot of the time it doesn't. But personalization is becoming more and more important. What does the future of this landscape look like for you?
I think there's still a long way to go in the space of personalization and recommendation. I mean, I still sit down on my couch and want to watch TV or watch some content and it's almost like there's still too much to choose from. I mean, I could go to Netflix and get their recommendations, or I could go to DirecTV and get their recommendations, or I could go to Amazon and get their recommendations. I want a service that's just going to tell me what I want to watch. I want to have to think about all of the different channels that I have to go to, I don't think that that exists yet. A service that kind of goes across the top of all of these. So I think there's an opportunity there for growth in the future. But the other space, I mean technically where I think is very exciting is contextual recommendations. So if we can try and understand where people are when they're consuming content and use that in how, what we serve up to them. And a recommendation, because I know that I took a 45 minute train ride into work today, the type of thing that I would want to consume on that train ride is different than what I would watch. If I'm sitting down on my couch on a Friday night with time to kill and want to watch something different or what I want to watch when I'm on vacation is different than what I'd want to watch when I'm home or even in the morning versus the evening. So I think these kinds of contextual recommendations and learning how people consume content, I think that's the next step for recommender systems and I think could really provide value.
I love that idea of contextual recommendations. What type of techniques do you think could be used to develop this type of, these type of recommendations?
I think that you have to do some kind of maybe clustering of a person's viewership just to understand what they watch in different contexts. You could also do it by engaging the user to help you understand by asking them questions and obviously having them opt in to collecting certain data set. Ask them what kind of mood they're in and what they would want to watch in a particular case versus a different, different scenario and hopefully not ask them too many questions as to be annoying. But just ask them enough so you can get some information and feed that information into a recommender system and give them what they want to watch.
Yeah, I like that type of user onboarding idea because I signed up to Netflix a long, a long time ago. I can't remember, but I can imagine that it would make a lot of sense. When you sign up for a service such as that, they ask you a few questions at the very start. Like three to five questions that help calibrate the service to you personally.
Yeah, that's right. I mean Netflix now, you know, in the beginning they didn't even break up amongst the different people in an account and they tried to figure it out but ultimately they realized if you have different accounts for different people in the household or on the account, they'll do a better job. So there's always A balance between asking the consumer for information and trying to figure it out. But we shouldn't shy away from asking the consumer information. You want to keep it short and snappy, but it can be extremely valuable for sure.
So for Netflix in particular, my wife and I each have our individual logins on Netflix and then our joint one where we watch shows together. And those three seem to do a pretty good job to cover us all.
Yeah, that's a great example.
So we've talked about a lot of different techniques and methodologies for data science and statistical research. What are some of your favorites or what are the things you enjoy getting your hands dirty with the most?
You know, I'm always amazed at the. This is going to be kind of a boring answer, but I'm always amazed at the power of some of the old school techniques. You know, good old fashioned linear regression is still a really powerful and interpretable and you know, tried and true technique. And it's not, you know, it's not always, not always appropriate, but often works well. Decision trees are another old school technique that I'm always amazed at how well they work. But you know, one thing I find, you know, I always find really powerful are well done, well thought out data visualizations. And you know, I'm a big fan of the type of data visualization that I see in media companies particularly the New York Times does a great job with data visualization. They can present a complex data set in a way that doesn't even require modeling or analysis necessarily. But if it's broken up the right way, it tells a story, it allows you to learn from the data and particular the way they use the web to create interactive visualizations and you can play with it and understand the data by poking around a little bit. I'm always very impressed with a really well thought out visualization where multiple variables are presented to you using shapes and colors and appropriate, appropriate visualization techniques. And I still get very. When I see a really well done visual display of data like that, that's what that gets me pretty excited for sure.
And you're right, the Times has a lot of interesting stuff. I remember during the last primaries they had, they showed what was reported in terms of who was ahead in the primaries. But then they showed it varying, they were doing some sort of resampling it varying with respect to the sample size and showed that interactively it wasn't actually clear cut, which I found very interesting.
Yeah, I mean just this past weekend I was playing around with my family. They have one thing where you can they ask you questions about how you say certain phrases like whether you say soda versus pop or whether you say garage sale versus rummage sale. And they ask you 20 questions and then they can kind of figure out what part of the US you're from. And it was quite accurate for the people that did it in my household. But you think about the, you know, the text mining that goes on behind that. There's probably some sophisticated data, data set, data collection and some text mining models that go in behind it. But the way it's presented is very easy to understand, easy to digest, it's fun, and it ends up giving accurate results. And I think that's great example of a quote unquote modern analysis that doesn't, you know, it doesn't require deep learning. It just requires good statistical thought and data collection and understanding.
And it speaks to the fact that as data scientists and statisticians, we're also storytellers.
Yeah, exactly. That's why we got into this, is to tell stories with data. That's what makes it interesting.
So something we haven't touched on is what actually you use in terms of languages and libraries and technologies. What do you like to visualize with?
Well, we're mostly an R shop, so we use a lot of the R tools, certainly ggplot and various R tools and the Tidyverse and other packages that are out there for R. I like to use Plotly for some simple interaction and visualization. We developed here at, AT&T an open source tool called Nanocubes that we developed because we saw a need for very large scale geospatial analytics. So with nanocubes you can visualize billions of points on a screen because it's being stored in an efficient and computationally efficient manner. So, you know, sometimes we use things out there, sometimes we develop our own as part of our research. But you know, we'll try anything.
Awesome. So we've discussed a lot about what modern data science looks like today. What does the future of data science look like today?
You. Well, I think, you know, I've been, I've been really fortunate to be in a field that has kind of taken off during, during my professional life. You know, when, when I started here at, at&t and you said you were a statistician or a data analyst or. No, nobody used the phrase data scientist then. It was kind of a niche or fringe field. But you know, I've seen now it, now it's pretty mainstream. You see data science everywhere. Every company has data scientists now and you know, people who are Going to school in all kinds of different fields feel like it's necessary to take a data science course. There's Great, there's great MOOCs out there. I'm a big fan of the Coursera courses taught by the Johns Hopkins faculty for helping to train people in data science. And so what ended up happening is that there's a great democratization of data science. You don't have to be a PhD in statistics anymore to do really good data analytics. You can learn it from taking courses online and using your own laptops, and you can go and collect your own data and do great analytics out there. And there are some really fantastic blogs and Twitter feeds out there from people who are doing great things with data. So I see this lowering of the bar of the data scientists, and I think we'll be seeing a lot of fantastic work coming from, you know, not necessarily from the, from the AT and T's and other big corporate labs, but from, you know, the average people in their, in their, in their basement doing data science.
Yeah, And I wonder what else we can do from this side of the data science divide, because I know people who are journalists, for example, who think to get into data journalism, they need to learn about hierarchical linear regression, Right. Or they need to have done six years computer science. So what can we do as educators and practitioners to help bridge that gap?
Yeah, well, I mean, I think it's a balance, right? So I think people need to. Well, so for instance, I think, you know, statistics classes help, right. So I think having some statistical thought and understanding the, how data, understand the uncertainty in data, how data is generated, maybe a little bit of distributional thought is good. You don't have to take it to a huge level. But I think a combination of understanding some of the basics and some of the theory, along with just immersing yourself in data and trying to solve problems with data is the best way to get people started in this, you know, in this industry and helping them to contribute to the great data science that's out there.
As we move from modern data science, what's happening today into the big future of data science, what's a final call to action for all of us?
I think we all really need to push for openness of data. I think there's an incredible opportunity if governments are open with data, given all of the data science talent that's out there right now, I think there's an incredible opportunity for regular citizens and they use this phrase citizen science or citizen data science. There's an incredible opportunity for people to help make society better and to make society greener and to help understand how societies work. If government data is made available and you know, it's made, and then people are free to use their skills to analyze it and find great insights. I think there's, I think it's really exciting to think about all of the great insights that we, that we could be exposed to if the data is exposed to everyone and people are given the opportunity to analyze it.
Yeah. And I think a good example of that is, I mean, we spend a lot of time in New York and the fact that the city makes all its subway data open. Right. So civilians can go in and probe and use the MTA API to check out how the subway's working and these types of things.
Yeah, that's great. And I think, you know, that extends to, to all realms of government data, whether it's economic data or financial data or health data. Of course, with the right privacy, I think that the types of efficiencies that we can extract out of that data will be tremendous.
Chris, it's been an absolute pleasure having you on the show.
Thank you so much, Hugo. I enjoyed the conversation.
Thanks for joining. Our conversation with Chris Volinsky about the role of data science in the modern telecommunications network landscape. We got insight into the scale of the challenges they're facing, how necessary it is to develop new techniques to deal with the masses of data coming in every day, and how one of the big advancements has been that AT&T has led the charge in the industry to build out a software defined network that can be nimble and serve their customers for years to come. Come make sure to tune in for our next episode. A chat with Claudia Perish, chief scientist at Distillery, about the role of data science in the online advertising world.
More from Richie

#359 My Best Friend is AI with Valerie Tiberius, Professor of Philosophy at University of Minnesota







How AI Agents Will Work While You Sleep | Ruslan Salakhutdinov, Professor at Carnegie Mellon

#358 How AI Agents Will Work While You Sleep | Ruslan Salakhutdinov, Professor at Carnegie Mellon

