20160711 boston ml meetup
Alex Franks presents a framework called Expected Possession Value that uses NBA player-tracking data to predict points remaining in any basketball possession at any millisecond. The model combines player acceleration, passing and shooting probabilities, and defensive matchups to create new metrics like player value added and shot satisfaction.
Chapters
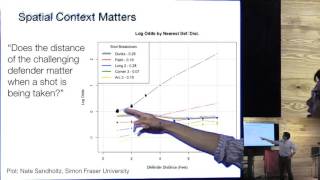
Hey, thank you all for having me. This is going to be a sort of highest level talk. If any of you want any sort of more nitty gritty details afterward, we can certainly talk about those. And yeah, this work is done jointly with a group we call ourselves XY Research. We're a bunch of people who are at least at one point, affiliated with Harvard. And I'll show you guys a slide of these folks in a second. All right, so when I present Sports Work, there's like two groups of people who respond to that. The first group of people say, of course you're talking about sports. That's great. Why are you studying math and statistics? There's another group of people who are like, math and statistics is awesome, but why are you wasting your life on sports? So I'll answer the more fun question, why sports? Actually, these two things have been very interrelated for me. Me, when I was an undergrad, I was a terrible statistics student. But my roommate read Moneyball our sophomore year and then discovered in Moneyball that there was a professor at Harvard that he wanted to talk to named Karl Morris, who's a pretty big deal in statistics. And then from there, he ended up roping Carl into starting an undergraduate sports analysis club. In that club, I ended up working with Carl on a paper for estimating baseball park factors. So how different baseball ballparks are sort of more favorable for hitters or pitchers depending on their shape. For example, Fenway park has this giant wall that makes it very easy for hitters who hit to that side of the field to hit a ball off the wall and get a double. So we ended up working on a project there, and then I realized that I actually really like statistics, but by that point had already committed to a job at Lehman Brothers in 2008. But luckily I already had the light bulb, so managed to sort of get right back on the academic track earlier than expected. Yeah, but on a less personal note, sports, I think, is a great laboratory for learning about statistics. So, for example, this is a figure from a 1977 Scientific American article that Carl depicted on the previous slide wrote with Brad Ephron, who's another big statistician over at Stanford. And this actually is about estimating a player's batting average just starting from the first. I think it was the first 10, 20 games of the season and trying to estimate what their batting average is going to be at the end of the season. So I think most people here are familiar with this fundamental idea of regression to the mean. And the basic idea here was that at the very beginning of the season, you're going to see some hitters who have really unrealistically high batting averages. You'll also see some hitters who have unrealistically low batting averages. And if you want to have a good estimate of what their true batting average is going to be over the entire season, you actually need to sort of pull these estimates together. And so this is an idea in statistics and machine learning that's now very popular, called shrinkage, where you want to shrink a bunch of these estimates together so that they are actually reasonable. It's a form of regularization that's also data driven. And it's great that a fundamental example that came from one of these major developments in statistics was actually phrased in terms of baseball. Of course, a lot of people also know shrinkage from Seinfeld instead. All right, so if we fast forward a little ways, I went from being a B minus student in statistics to being in a Statistics PhD program. And there I met a group of great people who are also working on sports data. One person, if you're a real sports nut, you might know, is Kirk Goldsberry. He was a columnist for Grantland while it was still around, and now actually works for the San Antonio Spurs. It was also three other students, two statistics grad students, Dan Servone and Alex Franks, who are now postdocs at NYU and University of Washington, respectively, and Andy Miller, who's still in the CS department at Harvard, and a statistics professor, Luke Bourne, who's now at Simon Fraser University. So Kirk was able, through his connections and through being an analytical voice in the basketball community for some, he was able to get very early access to this player tracking data that they have now installed in all the arenas in the NBA. And so from there he recruited Luke, whose specialty was in spatial statistics, and then they recruited a group of grad students to start working on some basketball problems. And so the work that I'm going to show you today has come out of this collaboration, which is now a multi site collaboration, but at one point was a Boston collaboration. The work here that I'm presenting has been presented at the Sloan Sports Analytics Conference several times. And so if you also follow that community, some of this might be stuff you've seen before. All right, so what is the big deal about this player? Tracking data in every NBA arena. Now, starting from the 2013-2014 NBA season, they installed these modified security cameras in the rafters of every NBA arena. And so there are, I think, six cameras that are tracking the players as they run around on the floor. And what this gives us is a 24 frame per second track of all 10 players. They used to have the refs, they took the refs out and XYZ coordinates of the ball. So there is a whole lot of data there. And what it gives you is this. Whoops. Come on, guys. Gives you this very cool sort of high resolution picture of what's going on in a basketball game. So this is what we end up being able to work with. So it is XY coordinates. There's some information that we're missing. These dots don't have arms. We can't see which way a player is facing. But there's still a lot of very good information that's here. And a lot of the work that we've been doing is to extract some signal here and get some actionable intelligence that teams or players might be interested in. Great. So I don't know if this thing skipped ahead and gave this away. I think I'm touching this anyway. But this is one thing that the player tracking data actually gives us a lot of insight into. Right. We want to. Well, in basketball statistics, we've been able to collect a bunch of statistics. Right. If you think about it, a game is basically just a. Right. There's the famous XKCD comic that this is just a weighted random number generator that we tell stories about. So a game is already generating statistics whether it's scoring, the number of fouls, the number of rebounds, et cetera. But spatial, the spatial aspect of the game is something that we obviously know is critical from watching the game. So how can we start incorporating that spatial aspect into the way that we analyze the game? And so the importance of the spatial aspect is something that you can see very clearly. If you think about aggregating statistics, just integrating out all the spatial information, you can actually end up misleading yourself very much even if you think that you're doing something that's very data driven. So this is one great example that just came up in our group this week. The question is, does the distance of a challenging defender matter when a shot is being taken? And so if you plot the log odds of somebody making a shot conditional on the defender distance from 0 to 8ft away from the player, what you would expect is for this probability to be going up. But if you just look at all the shots that happen in the NBA. Right. Very large sample size that we have here, you see that the line actually looks pretty flat. So does anyone have an idea of what's going on Here, is it the defender closest to the shooter that you're measuring? Yes, it is the defender closest to the shooter. The defenders are closer when the player is closer to the bat. Yeah, that's exactly it. Right. So there are these like, whenever we're dealing with a system where there's something very complex going on and we perform an aggregation where we're aggregating over different states, some of which are more common, some of which are less common, it's very probable that something like a Simpsons paradox is going to come up. Right where the correlations at the aggregated level are very different from the correlations at the much more specific level. So here you can see that if you actually break down the shots by how close they are to the basket, that defender distance actually has a huge effect on the probability the shot is going to go in. So this line up here shows dunks. So if somebody is eight feet away from you and you're dunking the ball, you're probably on a fast break. Or if the nearest person to you is eight feet away, and down here you have different long range twos and different three point shots. The size of the dot here is how common each of these situations is. So when you're dunking the ball, it's very common that the nearest defender is one foot away from you. But if you're taking a three point shot, it's very common that the nearest defender is 5ft to 8ft away from you. So because of the way that in three point shots a far away defender is more common, but in close up shots a nearby defender is more common, when you actually perform this averaging, you end up with a flat line. So this is just one clear example of how having data that's at the resolution at which you want to be making decisions is incredibly important to make sure that that data is actually steering you in the right direction. If you aggregate your data the wrong way, you can end up fooling yourself into thinking that something that is untrue is actually true. I thought this was a great example of how spatial context matters. And it's not just for answering new questions, it's for answering old questions. Okay, so with working with this new data set, there are a bunch of new challenges that come up. There are also a bunch of great tools that we have to deal with this. So on one hand, right, we're dealing with a very complex process. We're trying to understand the entire game of basketball. We're not trying to, or we're trying to make to understand aspects of basketball that will have real impact, right? So we're not trying to look at a very small corner of basketball. We're trying to answer some fundamental questions there. And that means that we really have to understand this game that is, that has these discrete events, for example, shots or passes, happening in continuous time, where there are a lot of heterogeneous agents that are actually engaging in this process, that are creating this process. And so to deal with that kind of process, the sort of modeling tools that we're using are spatial process models. These are ones that describe how discrete events happen in a spatiotemporal support, temporal evolution models that describe how a system evolves in time. So you can think about, like, hidden Markov models, time series models being examples of those. We also need random effect models or models that are able to estimate individual effects in a way that doesn't end up overfitting. Right? So we need some sort of regularized estimation of individual effects. And because this is such a complex system, there's not going to be a single method or model that we're going to be able to use to sort or a single algorithm that we can throw at this to answer all of our questions. And so thinking about how to compose different models, thinking about how to factor the problem into pieces that are actually tractable so that we can feed them into each other, is a major part of how we think about how we think about modeling this process. Now, on the other side, when we think about what we're trying to get out of these models, the queries that we are demanding of these models that we're fitting are actually also very complex. We want personalized inferences. We don't want to say, we don't want to recommend to a GM that they should go out and trade for the league average player who doesn't exist. We want to say that you should go and trade for this particular player. You should go and try to get Kevin Durant. I'm headed to Berkeley, so I'm super happy. Yeah, right. You also want to be able to say something about how teams are going to perform even after the context changes. So, for example, if we want to understand how Oklahoma City is going to play next year besides weeping horribly, we can. Right. We're going to have to perform some kind of extrapolation. We have to understand how the different components that are part of that team are going to be playing basketball in a situation that's very different from what we've been able to observe before. And then finally, if we're actually using these Models to do something like player evaluation, we would like to be able to point to what we think changed the value of a given moment in a game. We'd like to be able to attribute changes in our estimates to something that actually happened to some new information. And so these actually form a set of very interesting requirements that sort of inform what tools we're going to end up using. So in order to do personalized inferences, we're going to use priors that share information in ways that reflect the similarities between different players. And we try to use data to inform how we determine that one player is similar to another. We have to do some form of dimension reduction or representation learning. If you think about it, if we just think about how a player behaves on the court and we're trying to make a spatially referenced decision about what a player is going to do, we're already talking about an uncountably infinite space because inches matter in basketball. So you have to actually be able to share information spatially in order to do that. And with all the inhomogeneities that there are on the court, really the only way to do that in an effective way is to find some nice representations of the space in a sort of reduced dimension form. If you think about the actions the players are performing, you want to be able to represent those actions very, very parsimoniously. And so representation learning is also very important. In order to extrapolate, we need to think about how to factorize a problem in a way where we can take a profile for a given player and stick it into a new lineup and have that actually predict fairly well how that lineup is going to perform. That's still a really hard problem that we are not near solving. And then finally, in order to be able to make attributions, right, we need to have. We need to be making predictions that not only reprodict very well the things that we observed, but also that predict counterfactuals very well. So this is something that's very important for thinking about strategy and also for making sure that if you try to. Well, this is actually something that I'll talk about in the next application a little bit less abstract way. So this is an overview. I'm just trying to give you a sense of the many different tools that we're using here. This is not the kind of problem that fits very neatly into a regression or a classification setting. So it's something that does require a lot of tools that aren't necessarily in the standard machine learning toolkit. Did you add other sources of data on top of this? Data layers? Not a ton. Yeah. In fact we. So the, the data that we ended up using were the player tracks. There were annotations of the events that happen in a game. So like this person passed to that person and things like out of bounds, foul, that kind of thing. But you know, there, there were a lot of things that we didn't include. For example, player height and weight is available. That's something that could be very useful for looking at energy expenditure or something like that. So what we looked at was almost all self contained in the tracking data itself. Great. Okay. Whoops. Let's see here. This is. Well, let's watch some basketball first. So we can watch this a couple of times. We're very partial to the Spurs. We really like how they play basketball. This is from the 201220 or 20132014 season. I think this was a buzzer beater. Cleveland was ahead by two points against San Antonio. There are nine seconds left in the game. And Matt Bonner inbounds the ball to Tony Parker who drives towards the basket. Tony Parker then notices that Kawhi Leonard is wide open in the corner three. He passes the ball to Kawhi Leonard. He shoots it. Right. Now when you're watching this possession unfold, depending on how much basketball you watch, you may get very excited long before Kawhi Leonard actually takes this open three point shot. Because you sort of understand that as soon as there's a man who's open in the corner three, who's a good three point shooter, then good things are probably going to happen. And so we had this idea that there should actually be something like a stock ticker for a basketball possession. Now that we have all this spatial information here, we should be able to encode that sort of gut feeling that you have as a fan where you say, ok, I know exactly how well my team is doing right now. And so we want to be able to turn it into a curve that looks something like this. So when we start at the very beginning of that possession, the point value is close to the baseline, which is about one, a little bit less than one point. Then as Tony Parker drives to the basket. Actually I have this sort of annotated here. So Tony Parker is now driving to the basket, going around a screen. He enters the restricted area. So he's much closer to the basket now. This is where he's got the basketball. And so the possession value's already gone up because it's very likely that he can take a Shot from here. And it's actually a very high value shot if he decides to take it from that close to the basket. At this point, Tony Parker notices that Kawhi Leonard is open in the corner three. So he passes the ball to Kawhi Leonard and suddenly there's this huge uptick in value. Even before the shot is taken, there is a large uptick in value. And then this entire region here is where Kawhi Leonard is actually gathering the ball and taking the shot. And the contest is too late. And at the moment that he shoots the ball, the expected value is something like 1.6. So the general idea here is that just by moving around the floor, by making decisions that aren't necessarily terminal decisions, decisions that are going to end the possession, a lot of value is created and destroyed in a basketball play. And what we'd like to be able to do is to attribute that to actions that are actually occurring on the basketball court. This accounts for the situation. Two point extends the game. Three point wins it. This one doesn't. So this isn't a win probability. This is just possession value. So we're looking at just this individual possession. Although we did get into long discussions with people about this and it turns out that the, that maximizing possession value in this case will probably also maximize your win value. As Tony Parker is going close to the center, you should have like a decreasing expected value. Because he's missing the three point shooter, he exhibits less probability of actually giving it to the thing that is going to actually most likely close the deal. So, so what we actually have going on here is that as Tony Parker is moving moment by moment, we're calculating the probability that Tony Parker is going to pass the ball off to the three point shooter versus take his own shot. And so the fact that this isn't that there appears to be a trade off happening here where it's not going straight up in his proximity to the basket accounts for that trade off. And that's a very good point and something that we'll actually talk about at the end of this. I was wondering actually if tension would be going up sooner as soon as he got open. Yeah, so that's another thing that I think that there are a lot of different EPV curves that you can think about. So like if you live in the head of Greg Popovich, the Spurs coach. Right. Perhaps even at the moment that Tony Parker goes around that screen and you sort of see the positioning of the players. Right. Maybe that's when the EPV should actually be spiking. So the time at which the possession value spikes depends a lot on your representation of how the play is unfolding. What we used here was a very rudimentary, very basic representation of the possession that basically just looks at the positions of the players, the open passing lanes. And this is something I'll talk about in a second. The most informed way to think about this is that a basketball play is actually a sentence that has a bunch of words in it. And these are sort of actions that can be grouped together. So by the time an action starts, you already know where it's headed. And then that makes the basketball possession look more like a tree instead of looking like this sort of continuous time thing. Once you can break down a possession into a tree, then you can start seeing EPV spiking at much. Right. Much longer time ranges, because these motifs are actually tying together things that are separated in time, but, you know, are going to occur that way. Actually, I just want to confirm. Is this a quantitative curve here? Like there's some function. Okay, yes. Why does the value go down between the time the tutor gets the ball? And so we choose the. So that's actually because Dion Waiter is here, who actually is responsible for most of the value in this play. Because he was just sort of hanging out in the key over here instead of guarding Kawhi Leonard during this play. He notices once Kawhi Leonard gets the ball and starts running toward him, far too late. Actually, what's really funny about this play is that in the previous play, Deion Waiters was the one who had put Cleveland up by two. And so he was still sort of celebrating at this point and thought that he had won the game for his team and decided not to play defense. Yeah. Which is why Kwai Lantern was there. But this here reflects that Dion Waiters is trying to close out the shot. So in this expected position value function, are you primarily looking at the position of the ball and how the ball moves, or do you ever account for the distance between players of both teams? Absolutely. Yeah. And that's something that I think we should get into because it's kind of cool. Okay. Yeah. These are figures from. We actually managed to get a basketball paper published in the Journal of the American Statistical association, which we're super proud of. But these are figures from that paper that show a different possession that has a little bit more meat to it. And. Yeah, so we're excited about that. Okay. So I think everyone sort of understands the expected possession value idea that it's the number of points the offense is expected to score, score by the end of the current position, given all the information that we have now. So the idea is that the number of points the offense is expected to score is, if you think fatalistically, that all uncertainty is just the fact that we don't have enough information to know exactly what's going to happen in the future. This is sort of a fixed event. The only thing that's changing over the course of the possession is how much information we have about that event. So if you think about that this way, then the expected possession value curve is actually reprodicting the same event over and over again, millisecond by millisecond. And so if you want to formalize that, we're writing the full resolution annotated player track as Z. If you think about the history that's generated by that entire player track, we can write it as a filtration. The history of Z up to time T, capital T is the time that the possession ends. We don't know when that's going to be while we're watching the possession. So that's also a random variable. And then at the end of the possession, the analysis here simplified things. So we're only looking at 0, 2 or 3 points that are scored. So we're not looking at free throws. And what we can do is write the expected possession value as the conditional expectation, given everything that we know up till now, of the random variable X, the number of points that are scored at the end of the possession. If we write out all the uncertainty that we're integrating over, it's a double integral over the or. Well, one way to represent it is a double integral over the time at which the possession is going to end and then the state at that time. Really what this is is an integral over all the paths that the possession can take. So one thing, if you sort of work with machine learning in a practical context, instead of working for several years on a single problem to get a paper published, you might ask, why are we doing something that is so complicated? If you look at this outcome here, there are three classes of outcomes. Why aren't we just using a standard machine learning classifier to figure out whether it's going to be 0, 2 or 3 given the snapshot of the players at a given time? I think this is sort of an important point that what we want to be able to do with this is to evaluate player decisions, right? We want to be able to say that if the value changes between time t and time S, that's because of Something that happened on the floor between time t and time s. Right. And so there are several examples where if you don't use a coherent estimator, one that is itself a martingale, so its expectation only changes if there's additional information that's added to it. Well, it's a special kind of martingale. Then you can end up in these sort of weird, paradoxical situations. So one that I completely made up says, okay, let's say that we look at all the situations during a season where Tim Duncan, God rest his soul, is at the corner 3 at time T. This is a very rare event. He usually didn't have the ball in the corner three. And we look at the next time point, the next person to possess the ball. So here we're looking at the. Let me see here. Okay. Yeah, yeah. So here we're looking at, in parentheses, the total number of possessions that you actually observe this occurrence. So in the 20 possessions that Tim Duncan had the ball at the corner 3, 10 of the times he passed it to Tony Parker in the restricted area, 10 of the times he passed it to Kawhi Leonard in the mid range. Right? And then in each of those 10 possessions, a total of 12 points and 10 points was scored. So if we just look at this side of the table, it's summarizing all the times where we saw Tim Duncan in the corner three, and it enumerates all of the downstream outcomes that happened after that. Right. Now what we can also do is look at all of the other situations that led to Tony Parker having the ball in the restricted area, and all the other situations that had Kawhi Leonard having the ball in the mid range. Right. Now, if we just look at these situations and we try to compute the expected value of Tim Duncan having the ball in the corner three, of Tony Parker having the ball in the restricted area, and of Kawhi Leonard having the ball in the mid range. If we just use unbiased estimators of all those things, meaning just taking this number, dividing it by that number, then what you end up with is a very weird situation when you're actually trying to draw out the EPV curve. For a given possession, you have Tim Duncan in the corner three aggregated over all the possessions where that happened, 1.1 points per possession were scored. But then he has two choices to make, and each of those choices has a higher value than the original state. Right. Now, this is something that if you are going back in the game film and you decide that you're going to look at the value of every moment of the game. No matter what happens here, you're going to end up saying that Tim Duncan made a good choice and that's a problem because that should already be factored into Tim Duncan holding the ball in the corner. 3. So what this means is that there's an artifact in the way that the data were collected in order to estimate the value of each of these situations that you're going to end up attributing to actions on the floor. So in order to avoid this kind of situation, this kind of paradox where the value of something that can only lead to higher value things. Right. Is lower than the average of these higher value things. This is not in the convex hull of these things. That's a problem. But doesn't he have other choices as well? Yeah, he does have other choices as well. And in this particular case we're looking at what the in sample EPV curve would tell you. So in sample he had these two choices. But yeah, going forward we will talk about all the different choices that somebody has. This is, yeah, a very simplified example. How do you test this EV curve against some kind of ground truth? What makes you think that it even makes sense? Yeah, so the way that we test it is to look at the individual components and then we can also look at moments in different possessions and look at how the EV at that moment sort of compares to the actual outcome of the possession. In truth, it's sort of an open problem. Right, because there's basically we are predicting one outcome a million times. Maybe not a million, but 24 times. 24 times if they play out the entire 24 second clock. And so figuring out a good way to actually just compute validation statistics is still a sort of difficult thing if you want to look at the end to end performance. But one thing that we did a lot of is look at the internal components of the model and make sure that those actually validated. Well, ok, so let's actually talk about that model. Okay, so one way to get a nice coherent estimator where the estimated expected value at time T is going to be the average of the estimated expected values at time S, which is greater than T, is to actually build a model for the entire stochastic process and then integrate that stochastic process model, because we have defined a stochastic process, then if we integrate forward in that stochastic process, we're going to end up with a coherent estimator as well. And so this is sort of how we ended up defining the stochastic process. This is another game. This is San Antonio spurs on offense again against the old look Oklahoma City Thunder. And so if we just look at the raw data, this is what it looks like. What we do is we add a layer of dynamics onto that. So we estimated acceleration surfaces for all the players when they have the ball, when they don't have the ball. And that gives us a way of doing a very short range prediction of where they're likely to be given their current position and velocity. We think about the accelerations as being drawn from a random field, and we call these micro transitions. So this is where the players are likely to be positioned next. This is something that we integrate over. Then we have a second layer that looks at the probability of a discrete action actually occurring. So the discrete actions that we define here are passing the ball, shooting the ball, turning the ball over. And so here you can see all the different options that Kawhi Leonard has with the ball up here. He can pass to Danny Green in the corner three. He can pass to the Tim Duncan, who's setting a screen for him. He can pass to Matt Bonner, who's at the 3, or he can pass to Tony Parker at the corner 3, or he can take a shot himself. Right? So we have a model that looks in continuous time at every moment, conditional on deciding to take a ball action like this. What is the probability that Kawhi Leonard is going to take one of these actions? So when we combine those things together, what we end up doing is calculating with very high precision what the next action is likely to be, when the next action is likely to occur, integrating over these motion surfaces. And then once we predict that one of these actions is going to occur, we then pass the stochastic process off to a sort of lower resolution Markov chain, whose expectation is very easy to compute. And so what we can do then is say, OK, at this moment, Kawhi Leonard has a 29% probability of actually shooting the ball if he shoots the ball. Right now, it's worth 0.68 points if he passes the ball to Danny Green here, He has a 29% probability of actually passing the ball to Danny Green. Danny Green here has an EPV of 1.08 points if he gets the ball in the corner three. And so each of these options here has both a probability of actually moving to that option and a value associated with that option. And so the value that's associated with each of these endpoints here is computed using a sort of simpler model that makes this whole problem Computationally tractable. But in terms of predicting the next decision that's going to happen, we're using the full resolution spatial data. So there's a sort of trade off that's built into the algorithm. But we are estimating a complete stochastic process for the basketball possession. So this is a figure that shows that in non cartoon form, this is a possession where very similarly to that, to the original one, we have a point guard who drove towards the basket, ended up being discouraged from taking a shot, decided not to pass to the corner three and instead passed it to a man who was on the wing three here, that man passed to someone named LeBron James, who then drove into the basket and scored two points. And so our analysis of that entire possession at every moment sort of looks like this, where every player has a little spray cloud showing where they're likely to be in the next second or two, and then every option that's available to that player, which takes into account where defenders are located relative to each one of those options, and each player's propensity to perform an action in different parts of the floor, sort of informs the probability that they're going to pass to the next person. And we have a coherent model that's then calculating the value of each of those options. So to give you an example of how we work with that sort of high resolution decision model, right, like what a player is likely to do, we think about the player's location on the floor. This is what we get from the raw data. And what we want to do is to give a rate. So per unit time that a player spends in a given location, how often do they actually make this decision? Right. So here we're thinking about taking a shot. So we start with the player's location. We ask, am I going to shoot? From here, we calculate a spatial surface for each player that indicates how likely they are to shoot from different regions of the court after accounting for the spatial situation that they're in. So that means the placement of other defenders. And I forget what the. Yeah, there was distance to nearest defender. That was the big one here. For shots, for passes, there was a little bit more that was going on. I wish they'd go away. Okay, great. So this surface here indicates a spatial effect. These are where players are more likely to shoot than the average player. Given all else being equal, we add these situational effects and then we make each of these effects specific to each player. Right. So this becomes an extremely high dimensional problem, both because of the spatial aspect and because we are Estimating these services for every player, this is actually the easiest part of the problem because we have. This just involves one player. Once we start thinking about passes, we actually have a passer service surface and a receiver surface that indicate how often a given player receives a pass in a given area and how often a player originates a pass from a given area. So there's a lot of computation that goes into actually estimating these spatial surfaces and those are what end up feeding into the sort of high resolution decision model. Okay, so what can you do once you have an EPV curve? I think that they're pretty entertaining on their own. They give us a lot of insight. But you can start actually summarizing the EPV curve. And we think that this can become very nice engine for developing a lot of different metrics. So, for example, you can start thinking about omnibus metrics, like if I replaced the player who has the ball now with the league average player, how many more points would I be expected to score over 100 possessions? And you can sort of rate players by that counterfactual question. So from the 2014, 2015 season, obviously Steph Curry is at the top. You can think about this, right? So this means that in any situation where Steph Curry has the ball, if you were to replace a league average player, or if you were to put a league average player in his shoes per 100 possessions, Steph Curry would give you 2.85 additional points. Right. Chris Paul is the next one on this list. You can see that. And LeBron James also shows up here in the top 10. Klay Thompson is up there. Kevin Durant is up there. Yeah, I mean, three of the five starting for the warriors next year are up there. So yeah. Right. This is a nice omnibus statistic, but there are some weaknesses to it as well. Right. Luckily this year we ended up with players who sort of are all around players up here. It weights shooting a lot. Because if you're thinking about EPV added as a sort of decision making metric, like, are you making the right choice? Very good shooters have a choice that very bad shooters don't have, which is to shoot the ball, to decide to shoot the ball. And so often we end up with very good shooters at the top. We also end up with the sort of the worst decision makers on the other side. Poor Rondo is close to the bottom. I still have a soft spot for him in my heart. And Ricky Rubio sort of shows up here perennially as well. Great. So another thing that you can do, we've computed this Entire model that looks at all the different options that a player has at a given moment. So we can start comparing, looking at whether the player is actually taking or making the best choice in a given situation. We have this entire tree that's available. So this stat that we call shot satisfaction looks at the value of the shot that the player took minus the value of the next available pass. Right. So the highest valued pass they could have made at the moment that they shot the ball instead. And so if you have a high value here, this means that when you take a shot, you're actually generating surplus for your team. If you have a negative value here, then that means that you should have passed the ball instead of shooting. So this is one way to quantify selfish shooting, although it's very local. Right. Most of the time a selfish shooter has sort of dribbled himself into a situation where he has no choice but to shoot. But you'll see here that DeAndre Jordan is at the top here. Because if you have a dunk and you're much bigger than the person next to you, then you should take it. Yeah. And then on the other side here, you have a lot of very bad shooters, but you can see that even when you're very bad, your shot satisfaction is relatively small. I think that's really a function of the fact that players get themselves into a situation where shooting is the only thing that they can do. So at that very moment, there aren't any open passes for them either. Ok, so this concludes talking about epv. I do want to talk in much less detail about a few other projects that we have, but are there. So could you look at like the maximum value of player passing along the curve? Yeah, no, I think that's exactly right. What we should be doing is looking at the moment that that player actually got the ball in his hands, and then, yeah, looking at the best pass that he could have made versus the decision that he ended up making. Why only two? A lot of times the player is going to be able to pass either direction. Yeah, that was a choice that we made purely for convenience. I agree that it might also make sense to look at basically the sum of all four passing options that are available. Yeah. And the way that we think about these metrics now is that they're sort of. They are very much proof of concept metrics. The idea was that the EPV curve should open itself up to a lot of different summaries. I think that's a great point. Decisions made by a guy with a call or all the other Four players as well. Sometimes two decisions are available because somebody thinks about something. Yeah, absolutely. So we are taking into account all of the. Okay, yeah. Actually, so there are two things here. So first of all we do pick that up, right. If somebody becomes open, then that opens up a bunch of options. So that is integrated into the EPV curve. There's a separate question of how you attribute the changes in the EPV curve to the individuals on the floor. And yeah, that's something that we're still unsure about exactly how to do. Right. And I think having, having an idea of what the playbook looks like would be a good way to sort of get insight into that. And we actually have a project here that is trying to get at exactly that question. Does it also predict on substitutions at all to sort of hold coaches accountable for who's on the floor in the team versus other players that are not on the team? Yeah, so we can, look, we can do a limited amount of that. We haven't tried to validate the model by taking a player who has never played with the four that are on the floor right now and stuck them in. Because a lot of our inference here is it ends up being pretty dependent on the lineups that somebody ends up sitting in. I think that there's probably some limited ability to do that. Certainly for players who end up being the last ball handler in a possession. Very often that's a much simpler question. For players who are actually playmakers, like if you're going to switch in a new point guard or something, that's a little bit more difficult. But we think that some of the summaries from this could be used there, but we need to make them a little bit more portable. Do you guys have enough data to train the EPV curves for players and especially for passes robustly? Yeah, yeah, absolutely. So the way that we end up doing that is we have to apply a lot of dimension reduction in order to get that right. And so we have a pre processing stage where we actually divide the court into five to ten spatial bases and then using those spatial bases can then reduce even the four dimensional passing surface to a much smaller number of parameters where we're just looking at loadings on these bases instead. The other thing that we end up doing because there are a lot of players that just never show up in some bases. So one season we looked at, Dwight Howard was actually the highest percentage three point shooter in the league because he took three point shots and he made two of them. So he had the best season average. So there's a lot of shrinkage that also has to happen to sort of pull in those extreme events. And the way that we do that, we look at the different spatial bases that players tend to occupy. So their placement on the floor is something that's completely ancillary to this model. We use that to inform a prior distribution of how similar different players are to each other. And then that distribution sort of controls how all the players shrink toward each other in a very structured way. Yeah. So we. Some of it is information sharing and some of it is dimension reduction. How does your model account for a player's ability to gain possessions through steals, rebounds, so forth? Yeah, this model here treats all possessions as being independent of each other. So generating new possessions is something that we haven't really thought about, but it's a great point. Right. The team that has more possessions often ends up winning. Cool. Okay, I'm going to go very quickly through a couple of the other projects. This is the one that I worked on the most, so I spent the most time on it. But there are a couple of other pretty cool ones that I think are worth looking at. One thing that people got really excited about once we had player tracking data was that we could finally look at defense. Because almost all of the box score statistics for basketball have to do with offense, except for rebounds and blocks, which are super rare. Steals also much rarer. But if you want to be able to evaluate defense on every single possession, the player tracking data gets you somewhere. And so up till now, when we think about defense, we sort of think, well, we know good defense when we see it. So James Harden a couple of years ago was a great example of bad defense. Here. He just sort of falls asleep in the key. Kawhi Leonard runs around the other side of two men. Tim Duncan kind of catches him, and then Kawhi Leonard gets a nice open shot when Harden panics. On the other hand, if we look at Chris Paul play defense, here they are against the warriors and they still had David Lee. So Chris Paul here is on Steph Curry. He stays on his hip the entire time, makes Curry take a contested shot. So you'll see it again. Watch these two guys up here, right? Even after there was an offensive rebound, Chris Paul still stays on his man. And so that's something that we would call good defense. One issue with the player tracking data is that we don't know who's guarding whom. We don't know what the defensive assignments are. So that's something that we have to incorporate. So finding the matchups is a very important question. And then there are two sort of sub questions that we started looking at, which is shot suppression. So if you think about how good a defender is, a good defender can be somebody who doesn't even allow a shot to get off in the first place. Right? But you can also have very good defenders who are good at disrupting shots. So we started looking at disruption and suppression as being sort of two axes and defense. So this is sort of animation of the raw data from that play where Chris Paul stayed on Steph Curry. Here we can go forward a little bit. The way that we end up deriving who's guarding whom in that situation, because we don't know what the matchups are, we think about the sort of basics that they teach you when you're starting to learn basketball, right? You should be guarding, thinking about this triangle, the ball, the person you're defending, and then the basket. We use a hidden Markov model to figure out how players are optimizing in this triangle. We get a very stable estimate. We looked at a bunch of different random subsets. We ended up with constants that look very similar to this. 0.62, 0.27, 0.11 for man basketball. And so from there, we can train a hidden Markov model that at every moment is telling the probability that this guy is actually defending any one of the five opponents. And so that allows us to superimpose these lines here to say, okay, this is the person you're most likely guarding. And so as a play actually unfolds, we can see things like likely double teams. And even when players sort of run past each other such that they're not necessarily the closest defender to the offensive player, they're following the lines still manage to follow them. So the hidden Markov model provides a nice sort of temporal smoothness that allows that to happen. And then based on that, there are a bunch of statistics that you can derive from this who's guarding whom model. We can start looking at, make something that we call a matchup box score, where we say, ok, if we look at the percentage of time that you're guarding somebody, and we divide all the points that that person scored proportional to the time spent guarding, then you can sort of get a box score that says, like, James Harden scored 6.9 points, or rather, sorry, Kawhi Leonard scored 6.9 points on James Harden during that game. And then you can start looking at how players end up rating and shots that they faced versus the points that were scored against them. But you can also Go a little bit deeper here you can start modeling how good players are at shooting, how likely they are to shoot from given areas of the floor, and then how much being the defender assigned to them actually changes those tendencies. So we have a shot selection model and a shot disruption model whose coefficients end up corresponding to a player's ability to disrupt shots, a player's ability to suppress shots. And we can actually start plotting spatially for every shot that a player faced, whether that shot occurred in an area where that player is relatively good at defending or bad at defending. So here the size of the hexes have to do with the frequency with which shots happen against this player compared to the league average. And then the color corresponds to how likely that shot is to go in, given that this player is defending. So you see here that James Harden was getting beat a lot and drives to the basketball because people were shooting very often close to the basket, and they were making their shot much higher than the league average close to the basket. Basically, there was just this area here where he was doing a good job of actually suppressing the shots that he was facing or disrupting the shots that he was facing. And so you can compare James Harden to someone like Kawhi Leonard, who was facing a lot of shots. These black dots here indicate areas where there are very few shots that he was facing, but he was doing a pretty good job of actually contesting the shots that he was facing. There are some really nice comparisons that you can draw on the basis of this shot chart. So this was Roy Hibbert's last good season, where the Pacers were playing a strategy where basically they would just funnel all the players into Roy Hibbert. And so it was expected that he would be the one contesting the shot in most possessions. And so you can see here that he faced a ton of shots on the inside, but these are dark blue, indicating that he was doing a very good job of disrupting those shots. Compare that to Dwight Howard, who was able to basically just scare people out of the middle of the court. So he faced almost no shots in this area. So these are two very different strategies that become very apparent when you have something like a. A defensive shot chart. Okay, these are some more sort of speculative projects. I'm not going to spend a ton of time on them. But there are two really interesting questions that have to do with how we represent basketball that we'd really like to start answering going forward. One of them has to do with spacing. The other one has to do with representing actions that players are taking on the court. So in terms of spacing, one thing that we can think about is the NBA court like a real estate market. So if the NBA court is the real estate market, where's Tribeca? Well, it's right here in the restricted area. Obviously, that's the highest value space on the court. And so we can think about players in a play trying to get ownership of different parts of the court that are more or less valuable. And we can think about them as exerting more ownership at points that they're closer to. And we had this model, or we have this model where we're thinking that when a player gives up a piece of space, when a player decides to put the ball into a new part of the court, they're actually conducting a transaction. They're selling this part of the court that they own right now for the part of the court that the guy receiving the pass is going to own. And so, based on just tracking these transactions, we can calculate the relative value of different parts of the court. And we actually see some very nice sort of summaries of how the court is valued by different players. Red here means that they value it a lot. Blue here means that they don't value it as much. So, for example, LeBron James here doesn't value the mid range very much, but on the outside, he was doing very well. And then also values being close to the basket a lot. You look at Klay Thompson pretty clearly values the three point area a lot. And so what you can do then is start looking at plays in terms of the value of the court that is owned by different players and the sort of total portfolio value that the offense has, the total portfolio value that the defense has. And we think that this can be a very nice way to start thinking about a little bit more about how to compute summaries like expected possession value, where we now start looking at how a given player ends up owning a little bit more court space. And we can start attributing changes in possession value now to the court space that they actually own. So this is one way to get the question that you asked back there. And in fact, we had a project that we were working on in soccer where it was like EPV for soccer, where we started using this sort of real estate representation to get some traction on that problem. Okay, this is the final thing where we want to represent actions that are taken by players. We call this project Stealing the Playbook. And the idea is that there are a lot of actions that are very right that teams do over and over again. So this action here is called the weave play, or the warriors, when they call it out, they say 54. And the idea is that there are players who run in opposite directions at the top of the key or at the top of the arc, and they end up just passing the ball to each other. It generates a lot of movement, and then usually they either get a shot at the top or somebody ends up driving into the middle once the defense is sort of disorganized. So we can watch several instances of this play occurring. One interesting thing is that when this play happens, it's not always the same players who are doing it, but it's the same actions that are happening every time. So what we'd like to be able to do is to identify when these very clear idioms occur in a basketball game. So there are a few questions that you want to ask here, right? When you try to attack this problem. A big question is, okay, what detail here is important? Like, is it important that. Like, which, is it really important that when these guys are crossing up here with the ball, say, is it important that Andrew Bogut is doing what he's doing there? Like, which players are actually really involved in this play? A second question is, like, which actions happening simultaneously are actually important here? Right? And like, is the timing really that important? If they ran this at, say, 3/4 speed, would it still be the same play? And so we started thinking about discarding a lot of information so we could get a clear signal in terms of identifying when certain plays are occurring. And so the way that we end up looking at this is, is by identifying the players that we think are the key to identifying this particular play. And we track their paths and the ball's path throughout the entire play. So this here shows from the top the beginning of the play, the placement of the players, and then where they end up moving all the way to the end of the play. You see, the ball normally ends up snaking its way to the basket. So on the bottom here is the weave play. And then there's a post up decoy play that we were looking at also. Now, one of the biggest sources of discrepancy here is the speed at which the play is run. Sometimes there are little pauses that happen also. And so what we want to be able to do, the sort of piece of information that we wanted to throw away was any sort of misalignment, really. We thought that the sequence was the important thing, not necessarily how long each element of that sequence ended up taking to unfold so if you look at two instances of the weave play here, we end up using a dynamic time warping algorithm very similar to. It's a dynamic programming method for aligning two sequences. And we end up getting very nice matches once we use the dynamic time warping. So this encodes an assumption that relative slowdowns or speed ups in a given play, as long as the sequence of actions is the same, is those are unimportant. The sequence of actions is important. So we end up aligning the plays relatively well once we apply the warping. And then what we can do once we can identify plays is actually start breaking down the game in terms of how successful a given play was. So now, instead of saying, okay, how successful is this shooter when he's the last person to touch the ball? We can also say, okay, whenever the warriors ran this particular play, where did they end up taking a shot? How often did it result in a made field goal? How often did it result in a missed field goal? How often did we draw a foul or commit a turnover? So this gives a nice way of sort of slicing up the game, especially if you don't have access to the playbook. So if you're trying to figure out how to defend a given team, you can start looking at individual plays that the opposing team is running. So far, this is a supervised algorithm, so there's still some work to be done to make it unsupervised. So we can actually really steal a playbook. But that's another piece of ongoing work. Okay, cool. So very quick takeaways, right? This is a really exciting data source for an area that people have been trying to analyze for decades now. And we feel like the new data give us access to old questions that we wish we could have been asking, but we only had box score data. So we started asking very different questions that don't necessarily speak to all of the strategic questions that you would like to ask about basketball. And one of the big things that became very apparent while working on this is that the big data that we were dealing with was actually just a bunch of really small data sets, right? We were looking at individual players and individual patches of the court. And as soon as you get more data, you realize that the question that you really wanted to ask was more detailed than the one that you were asking before. That was hamstrung by the data source that you had before. So it's very interesting. We have very large data set by academic standards, but we ended up still slicing the salami really, really thin, having to come up with different shrinkage strategies and smoothing strategies. Yeah, there are often some requirements that are more complex than just a naive prediction problem. Like for example, the one I talked about in the EPV case where you want to be able to do attribution. And then finally, there are a lot of interesting latent quantities that you may want to extract that will actually answer very interesting questions to you. So, for example, looking at revealed preferences from that real estate application or looking for purpose specific invariances, like saying, okay, I really don't care about time warping when I'm trying to identify plays. So I think that there's a lot that we ended up learning here about how to reason about problems even before we started thinking about the math. So again, I think it was a great instance where sports and statistics could work well together. All right. I think I've gone way over time at this point, but thanks so much for listening. After doing all this analysis. What's an example of a player you appreciated more and then one that you. Yeah, so in one of those EPV added calculations that we did, we ended up seeing that Jose Calderon was super valuable when he was on the Mavericks. And so that made us go back and watch a bunch of films and see that he was actually doing something sort of uniquely good for a bench player in his position. So that was a player that we ended up identifying as being way better than we thought he was. For players that ended up showing or ended up looking a lot worse than we thought they would, at least for me, there were some scrappy point guards that I really liked, Rajan Rondo being one of them, where it finally became clear that he was actually really costing his team more than he was providing. Ricky Rubio was another one. Russell Westbrook actually ended up sort of all over the place in this analysis. The first year he ended up looking pretty bad. The next year he ended up looking amazing. And you know, I mean, some of that has to do with the sensitivity of our models that if you are a player who plays on a team with a lot of other very good players, then if you have a bad shooting season, you can end up looking really bad because you didn't give the ball to the people who were making baskets at a higher rate. But I don't know, it gave us a lot to think about. In that sense. Dwight Howard was someone that I also ended up respecting a lot more once I saw that defensive shot chart. So what do you think about coaches? Do coaches vary the outcomes of the player data or coaches are complaining About. Yeah, I think that coaches bring a lot of value to teams. And so actually one very interesting example has to do with how coaches use players. So Marco Bellinelli is a. He was like a three point shooting role player for the Bulls and then went to San Antonio and then went somewhere else after San Antonio. I forget if you looked at his three point percentage when he was at the Bulls versus when he was at San Antonio, it was like night and day. And it had to do with the fact that Popovich was actually running plays that would get Marco Bellinelli open shots, whereas on the Bulls he was taking a lot of contested shots. So I think that there is a lot that goes into the playbook that a given coach decides to run that can affect player outcomes a lot. In fact, we see that when players move from team to team, a lot of the attributes that we think are very stable in a given player, like, this guy's a very good three point shooter, that guy's a very bad three point shooter. And it being much more sensitive to context than we would think. Sort of naively so, yeah. I mean, being able to run strategies that get open shots, I think is by far the most important thing. So going off that question, can you talk about just like convincing coaches that this is worthwhile? I remember there's this famous clip of Mark Jackson and kind of shrugging off analytics and just saying, you know, we have this great group of people working on this stuff. I somewhat believe it. But yeah, just. Do you have any stories about that? Yeah, well, I mean, there are. So I think the big thing is to make sure that you're not approaching a coach with the method first. Right. So there's another, like, there's a talk where Stan Van Gundy just went off on analytics. He was talking about a paper that was in the research paper competition at Sloan. So the authors were probably in the audience at the time just like, oh, there's people, they have this machine learning that can identify pick and rolls. I watched all those plays and like half of them were pick and rolls. And you know, like, I wouldn't even consider that thing a pick and roll, you know, so there are like a lot of it has to do with language and how presumptuous you sound when you go to a coach and say, hey, I have a machine that can do what you do, you know, versus, you know, coaches do end up coming up with questions that have a very empirical flavor to them. And a lot of it has to do with seizing onto those opportunities where the need has actually been articulated and answering that question well without necessarily showing what the machine underneath that's actually doing all of the analysis is doing. I think going forward coaches are going to be more interested in actually how that's working. And I think basically incorporating coaches early, making sure that their logic is what is underlying the assumptions that's going into your modeling can also be a huge thing. So the spurs for example, are very open minded about this kind of thing and they make their GM available. They actually just posted a job for somebody to liaise between their analytics team and their coaches. So they actually really focus on that link. I have a question for you. What can you recommend for those of us who have like family friends who are too conversed with, like fantasy football, fantasy basketball, fantasy something, you know, as far as like best approach to being productive about that and take that and actually translate that into. Yeah, no, I think actually fantasy sports present an amazing opportunity to getting started in statistics. Who like to watch sports. I think that would be a much greater market. Yeah, lack of knowledge, understanding this type of tools can. Yeah, I agree. And in fact a lot of there, there are a couple of startups that have popped up in the, in the sports analytics space and almost all of them start by trying to generate some credibility by going to teams and then immediately take a turn and go towards like mass media market and entertainment. And yeah, I think that they're one, one thing that I really like about this as like somebody who thinks about themselves as an advocate or an ambassador for statistics is that this can be a great sort of gateway to get people into statistical methodology. And so yeah, I think that there's a lot of this stuff. We're actually trying to develop pipelines for so that we can start publishing more regularly to get sort of average fan involved. The mashup box score, for example, was something that we started posting a lot of during the playoffs this year that started getting some conversations going. So yeah, we are sort of, we're trying to think about how to interface with that market as well. Yeah, exactly. I think it can really make the game a lot more fun to watch. If you can say like you should watch this player on defense. Right. That can give somebody something to talk about with their friends. So I think it's probably safe to say there's way more people in the world who are interested in sports than there are people interested in statistics. Yeah. So in your opinion, what would be the best way to get those people to start working with data to get them interested in statistics? Because clearly the work you've done here is fascinating, but this is over the head of most people. Yeah. So where do you start with them? Yeah, I think baseball is a great place to start to give a, an answer that's maybe like very specific in a category you weren't thinking about. But basically I think that there's a lot of data available there where people can just start getting their hands dirty very quickly. A lot of the queries that you think about there, because they're so individual, are things that you can get access to even if you just know SQL. There are a lot of sort of naked averages in baseball that you can start looking at that I think can really get you excited about what sorts of insights you can get as soon as you start playing with data. So I guess that's a long winded way of saying that. I think the best way to use sports as a gateway to more data driven and mathematically driven thinking is to help people get their hands dirty as quickly as possible. And while they won't be able to get the player tracking data necessarily, there's a lot of very interesting data out there about a lot of different sports. And my recommendation for baseball was because there aren't as many aggregation problems in baseball as there are in basketball. Like that plot I showed at the very beginning. Yeah, but I mean, it worked for me. The first data sets that I worked with were baseball data sets when I was deep into college. And it sort of turned me around in terms of doing a data intensive field. Very nice talk. Thanks. Alex, I have a question. I'm curious. What are some of the biggest open questions or challenges that you guys are facing now? Sort of, if you had a blank check for research, where would it go? Yeah, I really think this play representation thing is huge. I'm very excited about it. I think in general, finding good representations can make a very difficult problem very trivial. I think this is something that is getting a lot of people excited about deep learning because suddenly there are these nice internal representations that show up out of nowhere that actually seem very intuitive and then their final classification problem is very easy. I think that in basketball a really cool thing would be able to string together the words of a basketball play into the phrases of a basketball play, into the sentences that compose a basketball play. So being able to identify a particular shape of cut, being able to identify a particular screen that's happening, and then to start from the bottom up, building a dictionary of different actions that occur in a basketball play so we can actually represent a play as a tree instead of Just player tracks. That to me is I think the most exciting thing because it makes everything else that we're doing so much easier. Yeah, I think the space thing is also something that I'm very interested in. Yeah, those are very specific technical things. The other moonshot is to get better models that can actually look at. If you traded this player for that player, what would your team look like? How would your team be able to play? But I think that we have to get to sort of like simulation levels basically to. To get there. Let's take one more. Yeah, sorry. So has there been any collection for space data for soccer? Yes, there has. There are a couple of companies that are doing that. One is called Opta, one is called Prozone. Prozone just merged with Stats Inc. Who does all the basketball stuff. And I know that some teams have actually made their data available. Other teams haven't. Major league clubs or is it. I'm not sure about Major League Soccer. Yeah. But EPL definitely has it. Yeah. So if you guys have other questions, Alex will probably hang around a little bit. I'm sure he's going to go to bed at some point today. But yeah, also Clay. Clay will be hanging around if you have questions about locallytics Wheel. Yeah, like we're probably going to want to clear the space soonish just because it's like 8:15. We can probably hang around till around 8:30 if you want to grab a piece of pizza or whatever. But thanks so much for coming out. This is.
More from Richie

#359 My Best Friend is AI with Valerie Tiberius, Professor of Philosophy at University of Minnesota







How AI Agents Will Work While You Sleep | Ruslan Salakhutdinov, Professor at Carnegie Mellon

#358 How AI Agents Will Work While You Sleep | Ruslan Salakhutdinov, Professor at Carnegie Mellon

