#22 Robust Data Science with Statistical Modeling (with Michael Betancourt)
Michael Betancourt, a core developer of Stan, explains how robust data science requires building statistical models that faithfully capture how data are generated. He describes Stan's tools for Bayesian inference and walks through a malaria-vaccine study where careful modeling revealed hidden experimental flaws that simpler analyses missed.
Chapters
In this episode of Data Framed, a Data Camp podcast, I'll be speaking with Michael Bettencourt, a physicist, statistician and one of the core developers of the open source statistical modeling platform Stan. Mike also works as an educator and consultant across many disciplines, helping working professionals and researchers to build statistical models to make better business decisions and discover things about the world, collaborating on analyses in epidemiology, pharmaceutical pharmacology and physics, amongst many others. We're going to talk about the pitfalls of model building, which is the bread and butter, well, almost the entire sandwich of a lot of data science work. Whether you're making predictions or understanding data collected in the world, we'll also dive head first into why data science is such a dangerous term. In the spirit of total transparency, I'll tell you that Mike and I are good friends and that this conversation I is a sober culmination of many late nights and heated discussions in New York City bars and we're proud to make it public. I'm Hugo Baun Anderson, a Data Scientist at DataCamp and this is Data Framed. Welcome to Data Framed, a weekly datacamp podcast exploring what data science looks like on the ground for working data scientists and what problems it can solve. I'm your host, Hugo Bown Anderson. You can follow me on Twitter hugobown and datacamp@datacamp. You can find all our episodes and show notes@datacamp.com community podcast before jumping into the interview, I want to remind you all to subscribe to Data Framed on itunes, Google Play, Overcast, Stitcher, Spotify. We are everywhere. Do subscribe and everybody wins, including you. Also write us a review on itunes. It will help us to keep on keeping on. I may even read your review on the show in the future. I'm going to read one review now before jumping into the interview with Mike. This review is by somebody called Nick33825. The review reads, Hugo is the Australian Larry King. He gets the best guests and asks them thoughtful and witty questions. This one is a keeper. Well, there you go folks and thanks for the great review. Nick33825 hi there Mike, and welcome to Data Framed.
Thanks for having me, Hugo.
It's a real pleasure to have you on the show. I'm really excited to talk to you today about robust data science, statistical modeling, the work you do on Bayesian inference and probabilistic programming with Stan and model building ideas of what the differences are or aren't between statistics and data science. But before we get into all of this meaty Stuff I'd like to know a bit about.
You go for it.
What are you known for in the data science community?
So I'm probably best known for being a developer of stan. So I'm one of the people who's built a lot of the internal C along with many of the other team. I try to be as active as I can on the forums and on social media, trying to get the word out about a lot of the research we're doing and improving Bayesian modeling and Bayesian workflow, as well as some of the co applications that we're really privileged to be able to participate in.
What other things might people know you for? And we'll get into what STAN and Bayesian modeling and that type of stuff is in a bit for those eager listeners out there.
Yeah. I also tried to be pretty present in terms of a lot of introductory material. I certainly remember very vividly trying to learn statistics without a lot of resources available to me. And so now that I've been lucky enough to really be trained. Right. I try to spend a lot of my time, or as much as possible, writing very clear introductory material to really separate out what is statistics, how do we model, how do we compute things to make it easier for new people to come in, really understand a lot of the basics and the foundations and really set themselves up to do some good modeling.
That's great. So in that sense, in your introductory material and educational material, you're really thinking about lowering the barrier to entry for people who want to do statistical modeling and data analysis?
Yeah, absolutely. I think there's been, unfortunately, this kind of historical evolution where theoretical statistics and applied statistics have been kept separate. And you see that a lot in the statistical literature, where a lot of the academic work is very theoretical, it's very formal and it can have limited application in terms of a lot of applied work that's going on in the physical sciences, social sciences, medicine, et cetera. Not that there is an overlap, it's just you don't see a lot of of literature going back and forth. So because I've been lucky enough to have one foot kind of in both sides of that, I try to bridge that gap a little bit. So a lot of introductory material just tries to focus on the new users and what they think is just enough to get them started. And I think that runs into problems where it limits how far you can go. Right. If you're just getting the first steps figured out, you don't really know where to go after that. And so one of the things I'M trying to do is take the end point, take the finishing line, which is, you know, the ability to really construct a rigorous or a robust analysis and figuring out a path towards that. So how do we take somebody who's just getting started and train them up to be able to get far enough to build an analysis on their own? And that really requires understanding not just where people are coming from, where they're starting, but also where they need to go. Right. Where is that final endpoint? And that's where a lot of the. That's why there's a lot. Where there's a lot of need in terms of literature and documentation.
I love that. And I couldn't agree more, because meeting people where they are is one thing, but as you say, connecting it to where they need to be so that, you know, you don't teach a certain amount of tools or APIs and a bit of math and then suddenly have them stop halfway through and not be able to reach. Reach the endpoint is, Is essential. That's something we're going to delve into a lot later on, especially in terms of thinking about robust data science and robust analyses as, as you. As you called it. One thing I'd like to know is how you got involved in data science. And I want to preempt something by saying I'm well aware that you're, you're very passionate about how the term data science may be misused, and we'll get to that part of the conversation. But you, you prefer to use the term statistical modeling, and we'll kind of delve into that later. But I'd like to know how you kind of got. Got into this area and discipline in the first place.
Yeah, so I was trained as a physicist at my undergrad and I was doing my PhD in physics, experimental particle physics, you know, colliding stuff, and looking for very rare signals. And in that PhD project, I was given this particularly hard problem, and one of my postdocs basically said, hey, you should learn some machine learning to figure this out. And in the process of doing that, trying to teach myself machine learning, I kind of inadvertently taught myself Bayesian inference. And I got really excited about it. It really clicked as this very intuitive way of building up an analysis and learning from these complex systems. So in that process of teaching myself statistics, reading as many books as I could, I started developing my own algorithms. In particular, there was this algorithm called Hamiltonian Monte Carlo that was in a few books, particularly Dave Mackay's information theory book and Chris Bishop's pattern recognition. Book, both fabulous books had mentioned this algorithm. And it seemed kind of physicsy and fun to play with. So I just jumped on that. And in the process of doing my thesis, I developed some variants, some generalizations, but I really didn't understand why it worked. There was this review article by Radford Neal. It's a very seminal paper. And there were a few points where he kind of just said, well, we do this because the physicists say we should do it this way. And I'm over there on the physics side saying, wait, who's telling you that? I'm not telling you that. I don't know which of my colleagues are telling you that. And there's this kind of weird evolution where it came out of physics into statistics. But it wasn't really clear what the foundational understanding was. So I made a decision at the end of my PhD. I wanted to work on this more. And so I started just cold emailing professors. And fortunately I got in touch with Mark Jarolemy, who's a professor in the United Kingdom, and he said, well, if you can wait a year, maybe we can get you out here for a postdoc. And in that year I went to New York, where I randomly ran into the STAN team who were starting working on this project of implementing Hamiltonian Monte Carlo themselves. And so we were just kind of naturally fit in. So while I was there, I started working on some of the early development of stan. Then I went to London, where I was very, very fortunate to be paired with some amazing colleagues who basically taught me everything I know about formal statistical theory and probability theory and really forced me to figure out how to do things right. It was an amazing opportunity. And by the time that was all done, we had this really solid understanding of what Hamiltonian Monte Carlo was all about. And that really set me up to really understand what statistical modeling is all about in a way that I could really start employing it in a powerful manner.
That's great. And I want to stop you there for a second because something you mentioned in passing there is that you actually became a tool builder at some point. You weren't only know interested in or applying statistical modeling techniques to real world questions, but you started building tools, right?
Yeah. So I think the problem is I didn't really understand what modeling was in any formal sense. Right. I was just a physicist. You know, you kind of hacked these heuristic models together. It wasn't ever a thing. Whereas the tools, the algorithms, that was always a thing, that was always something to be done. And so that's what started me in on this path that I've been on for a while now. And in doing so, I kind of inadvertently learned what modeling was all about, how I could formalize all these heuristics that had been taught in physics labs and physics research and turn it into something that was mathematically self consistent and rules that actually made sense. And that was really exciting because I could now I got my foot in the door with the algorithms, but what really excited me was now I understood what the statistics was all about and I could start building these models and doing some really cool science.
That's awesome. So I want to kind of zoom out slightly and talk about what model building actually means to you, because you develop tools that a lot of people in a lot of industries and academia use to build models of the world based on data that's been collected. So I want to know what model building is to you and how it relates to data science.
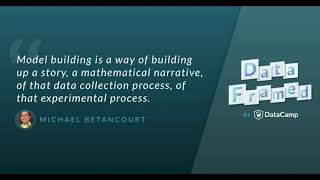
Yeah. So model building to me is this very personal storytelling. Right. Everybody has their own data, everybody has data that's been collected in very bespoke ways. And model building is a way of building up a story, a mathematical narrative of that data collection process, of that experimental process. And on one hand, people tend to think of statistics being very mathematical, and that discounts how much it is storytelling. On the other hand, if you're just telling stories without having a mathematical language to write those stories down in, then it's kind of hard to do any formal statistics with it. So I think to me, model building is really just a way of telling a lot of stories about how data could have been collected. But writing those stories down in a mathematical language, that sets us up to do a statistical analysis.
And I know something you're very interested in is generative models in terms of describing how data is generated in the world. Right. So maybe you can speak to that a bit.
Yeah. So I think people get a little bit overwhelmed sometimes when they're reading some intro statistics book and it says you build a model or you write down your model and you're done. And they look at their system and I've got these thousands of measurements and I'm looking at tens of thousands of individuals and they have all of these possible parameters that describe how they behave and how do I somehow turn that into this model? And one of the ways of getting around that initial overwhelming intimidation is to break down that story. Instead of thinking about modeling everything at once, rather try to model where did the data come from? Where did it start? Right. So you have some population of people, and then from that population you grab an individual and then that individual manifests certain behaviors and those behaviors turn into some interaction that, that manifests as data, and then that data gets selected and it gets written down somewhere. And each of those steps in that sequential story are little model components that you can build. And so generative modeling is all about instead of trying to model everything at once, rather breaking things down and model things sequentially to drastically simplify that story, building that narrative building, but at the same time still allowing you to build something that's, that's bespoke to your problem, that incorporates all of the domain expertise that you have available. I like to, you know, when I'm on teaching, I do courses in Bayesian inference and Stan. And one of the ways I like to describe this is in terms of Legos. Right. One of the things that we're trying to teach you are a bunch of modeling techniques, which are a bunch of these little LEGO blocks. But it's up to you to put those blocks together and build a model. Right. We're not going to teach you how to build a model. We're going to give you the building blocks so that you can build the model that's appropriate for your analysis. Right. You can build your badass LEGO spaceship better than anyone else can.
Yeah, exactly. And if it needs to be a spaceship. Right. And I think this is, this is a really nice analogy because the way you put the Lego together in terms of model building and statistical modeling will depend on the domain that you're working in as well.
Yeah, absolutely. And I think one of the things that oftentimes gets overlooked is that when you build a statistical model, it requires equal amounts of mathematical and statistical expertise as domain expertise. Right. I can't walk into a social science department and claim that I know how to do their analyses, I know how the statistics works, but I need them to tell me what the model is. I need to work with them to build up something that makes sense to me mathematically, but also makes sense to them in terms of the underlying social scientific structure. Right.
And I think this is a wonderful segue into the conversation so far has been relatively abstract and I'd like to dive into some particular examples because you've worked in, in consulting different industries and academic research groups to use this type of modeling and in teaching it, so you've seen a plethora of use cases. I'm just wondering what some of the most impactful or telling models or ones that you've just found interesting. That you've been involved in building are.
So as a physicist by training, and really at heart, the ones that really do excite me the most are the physics models. And I've been fortunate to have developed some collaborations with some colleagues who are doing some really cool state of the art physics at the moment. And there's just nothing more fun than sitting down and kind of just talking about the story, going through the experiment and then writing it down, right? Writing it down into Stan program and having that whole structure and this really, really cool little story and then running an analysis on it. So just personally, that's something I've been really excited about. But I think that as we've been able to see the scope of what these tools can do and we start getting analyses that get into medicine, epidemiology, that's a whole nother story because that's something that's having an immediate impact, not because it's fun and exciting, but because it's, it's, it's literally saving lives. And that's really humbling to be a part of.
Can you give us an example of how it's used in epidemiology or public health, for example?
Yeah. So one analysis I've been working on recently with some colleagues at Imperial College London is understanding the efficacy of malaria vaccines. And this is a really challenging problem because most people in epidemiology talk about efficacy in terms of you have malaria or you don't, but what these vaccines do is they decrease the amount of malaria that you have. It's not that this is binary problem. You have no malaria parasites or you have a lot of malaria parasites. There's a lot of intermediary situations. And when you're talking about whether or not a vaccine is going to be effective or not, you really have to understand how it affects the amount of malaria itself, right? Because all it takes is one carrier to have a little bit of malaria in them and then all of a sudden it can refuel up an epidemic. And this is one of the challenging things with the modern vaccines is we really have to understand how they work together or how new vaccines can work together synergistically to really drop that amount down so that we can't have these kind of epidemic flare ups in the future. When I started this analysis, I really just sat down with my collaborator and asked her, you know, how was the data collected, you know, what happened, what, what goes on in the lab? And we talked about it and we wrote this, this model and then we went back and we iterated on it. And, you know, we had this. This really, you know, it took a while to really iterate and make sure that it was complex enough to be able to answer the questions we wanted. And at the end, we had this really, really cool analysis. And we had these eight different variants. We had a control and seven different vaccine combinations. But there was this one arm that didn't work, which was really weird. We're validating our model. We're looking at the fit. We're seeing if it's really reasonable, and everything works well, except for this one vaccine. That was troublesome. And we spent a lot of time trying to figure out what could have been going on. And eventually we went, you know, we just kind of accepted defeat and started wondering maybe the data was somehow corrupted. So we went back to the lab and asked, what's going on with this data set? Can you tell us if there's anything weird about this particular measurement? And it turns out that that day that that data was collected, the lab was painted and there were literally fumes kind of roaming around the lab where the mosquitoes are bred. And it was noted in the lab notebook that the mosquitoes were dying prematurely because of those fumes.
Amazing.
Right? And this is not something that, you know, it's something that had been recorded, but it's not something that had been, you know, kind of well appreciated that this data was largely corrupt because of these external factors that were going on.
That's incredible, though, that it emerged out of the data modeling process and statistical modeling process. You could go back and discover that this had happened.
Yeah, right. Because we take what we thought was going on, we built a model out of that. And despite the fact that it's a relatively crude model in the grand scheme of things, it was rich enough that we were sensitive to these kinds of variations. Right. So it kind of tells you, it gives you a sense of just how powerful it can be in understanding how these vaccines are working, that we can see an effect as small as the lab was painted and the mosquitoes were going a little bit crazy.
And I know something you're really adamant and passionate about is thinking about exactly how the data were generated, what the experiments were. So maybe you could just tell us a bit about the experimental process in this case.
Yeah. So basically, the way these vaccines work is they try to limit the life cycle or they try to obstruct the life cycle of malaria. So in a mosquito, a mosquito is going to bite a human, it's going to pick up some blood, and there's going to be some malaria parasites in there. Those parasites are going to sexually reproduce. They turn into eggs. Those eggs then turn into these spores that clog up the salivary glands of the mosquito. When a mosquito feeds, the first thing it does is tries to clear out its proboscis so it has enough room to suck up blood. And when it does that, because it has these spores plugged in there, it's literally this little plug of malaria matter. It basically shoots a plug of malaria into the human. It's this amazingly well evolved system to propagate malaria as efficiently as possible. And so these vaccines either limit how much the malaria parasites are able to reproduce within the human, or they try to disrupt that cycle within the mosquito itself. These experiments model that life cycle. We have these mosquitoes, they feed on infected blood, and then those ensembles and mosquitoes are literally dissected. You literally take a few of them, you pull them apart with forceps, you take the stomach out, which is like a little squid, and you put it under a microscope and you count the number of malaria eggs that you see. And then you take the salivary glands and very carefully pull them out by hand, and you count the number of spores that you see. By building up a model of how much parasites were in the initial blood, how much eggs we saw, how many spores we saw, how much malaria was in the final blood, we're able to build a model of that propagation cycle of how malaria evolves in the mosquito ecosystem. And then we can compare how that works with controls versus different combinations of vaccines and different vaccine doses.
That's awesome. And not for the faint of heart. I'm wondering, you're a model builder and tool builder, but have you done these experiments yourself? And that leads to another question. Is, is it important for people building models to try to get a bit of hands on with how the experiments actually work?
So I did not collect any data that was used, which is perhaps for the best, But I was fortunate enough to go in and kind of the process. So I was, you know, I went in with one of the lab techs and I was given the opportunity to try to dissect a mosquito. It is real hard. You know, you have these forceps and you're looking under a microscope and you're trying to dissect this mosquito, right? So these little micro tremors in your hands under the microscope just look like your, your forceps are going crazy.
Amazing.
So the amount of patience and skill they have is, is remarkable.
And is it important for model builder to have this type of experience to at least understand that in some way.
Yeah. So you know, absolutely. The model builder has to have a very deep relationship with people who collected that data. Right. As a statistician, I am a translator. I take someone else's story of how the data was collected and try to translate it into a mathematical language. I'm not creating that story and having the experience of going in and collecting some of the data or watching people collect the data, seeing it firsthand, that just makes the probability that you mistranslate something all the smaller. The more experience you can have with it, the more integrated you are, the better that process is going to be. I think that really stamps just how much statistics is a collaborative endeavor. This is not something where people collect data over here and the people analyze it over here. This is a collaborative process where everyone has to be working together to get the best out of their data.
And so these are a number of very interesting use cases you've told us about. I just want to say that also the tools you build, Stan, for example, are used all over the place. So was it last year that Facebook started using Stan for its product profit?
Yeah, so I'm not sure when it was. Sometime in the last few years they have been developing internal data science tools. And you know, one of the things that happens to these large companies is you have people who use R and people who use Python and you know, they're using all these different interfaces to do their analyses. And so they were able to use Stan, which is a C product, but can be used within Python and R and a bunch of different environments to kind of centralize a lot of their analysis. So they would build up this one tool that analyzed time series in a very cool way that a lot of their teams could use just straight out of the box and just dump it right into their analysis pipelines.
We'll jump right back into our interview with Mike Bencourt after a short segment. Let's now jump into a segment called Rich Famous and Popular with Greg Wilson, who wrangles instructor training at Data Camp. Hi, Greg.
G'. Day.
What do you have for us today, Greg?
A few weeks ago I said that most people doing data analysis 10 years from now would be doing it in JavaScript. There is another contender, though. I think it'll take even longer for it to achieve global supremacy. And that's Scratch. For those who haven't seen it, Scratch is a blocks based coding tool created at MIT that's mostly used for teaching children how to program. Instead of typing in keywords like for and if Users drag and drop blocks that represent control structures and operations. These blocks can only fit together in certain ways, which makes a lot of uninteresting errors impossible.
What do you mean by uninteresting errors?
Things like missing commas or mismatched parentheses. The sort of thing that will annoy you or mystify you, but doesn't add anything to your understanding of programming or of your problem. Hundreds of studies have been done on Scratch since it was first released in 2003, and all the evidence says that it's a better way to learn basic concepts than typing.
So what's its relation to data science?
Well, hundreds of thousands of kids have already cut their programming teeth on Scratch. The oldest of them are already in university. And if we roll forward 10 years or so, we're going to have an entire generation of people, not just computer scientists, but accountants and pharmacists and project managers, for whom a block spaced interface will seem just as natural as a spreadsheet. Graphical Dataflow tools like LabView and Houdini have been around for decades. Sooner or later, someone is going to take those ideas and re implement them as blocks so that people can sort, filter and merge data using the kind of interface they first learned in grade three.
That sounds interesting, but I don't know if you'll ever be able to persuade me to point and click instead of typing.
Probably not, but you're not the target market for this. I don't think it will replace Python or R for high end users any more than electric cars will replace Formula one racers. What it will do is give millions of end user data analysts a familiar starting point and an environment in which silly mistakes are a lot harder to make.
What would it take to make it happen?
The groundwork's already being laid. The Scratch team is currently re implementing everything to run natively in the browser, and all of that work is in open source repositories on GitHub. Google has a similar effort called Blockly, which is also open source and both platforms will allow people to create new kinds of blocks.
Thanks very much. If anyone in the audience is interested in giving this a try, please get in touch. We'd love to hear from you. Thanks Greg, and looking forward to speaking with you again.
Thanks, Hugo.
After that interlude, it's time to jump back into our chat with Mike Bettencourt. So, we've mentioned the word stan at least 15 times together already, so let's shift there. Tell me about Stan, about the software you develop.
Yeah, so Stan, which is not an acronym, it's Named after Stanislal Ulam, who is one of the original mathematicians behind the Monte Carlo method, which then gave birth to Markov Chain Monte Carlo and then Hamiltonian Monte Carlo, which is what STAN actually does. STAN is basically a suite of software that's aimed at facilitating statistical modeling, in particular Bayesian modeling. And it's really kind of three components. The first is a modeling language. It's what we call a probabilistic programming language. And it's just like in any kind of code, you go and write a program that defines some executable. Well, in a probabilistic programming language, you just sit down and write a bunch of code that specifies a probability distribution, and that's your model. In a Bayesian analysis, your model takes the, it's specified in terms of probability distribution. And then once you've specified that in our language, we then take care of the rest. So we have the state of the art automatic differentiation library that allows us to take your model, differentiate it, get all kinds of information about it, and then we plug all that information into a state of the art implementation of what's called Hamiltonian Monte Carlo, which is able to fit that model in a very, very efficient and robust way. So the idea behind STAN is to kind of try to separate out the responsibilities of analysis, try to make it easier for users to just worry about building their models, and we'll try to take care of automating as much of the computation as possible.
So maybe you can tell us a bit more about what Bayesian inference is.
Yeah, so Bayesian inference is a way of trying to quantify uncertainty using probability theory. So we talked a lot about data, right? You have some observation and you have some model of how that data was, was generated. The problem is that there's lots of ways that data could have been generated, right? There's lots of just different variants that we could have gotten depending on when we collected the data, how we collected the data, who collected the data. And that variation always kind of obfuscates what we can learn. There's always uncertainty in what we can learn about a system. And there's various ways of trying to quantify that uncertainty. So there's frequentist inference, which quantifies it in a very particular way, and then there's Bayesian inference, which tries to quantify it using probability theory. So if you have a model with a bunch of different configurations, those configurations that have very high probability, what we call a posterior probability, those are the configurations that are most consistent with the data that we saw. And then Those configurations that have very small probability are less consistent. And so we get this really nice quantification of what was consistent and what wasn't. And we can use that quantification to, say, report what we learned about this model or then to make decisions based on what we learned.
Could you unpack this with a concrete example?
Absolutely. So let's say that you have a coin or you have some kind of process that results in a success or a failure, and that process has some probability. Right. How likely is it that we get a success? How likely is it that we get a failure?
So we can think of this as infected or not or survived or not.
Yeah, infected or not, survived or not, somebody clicked on your website or not, whether they engaged or not, you flip a coin, whether it's a head or a tail, you roll a die, whether it's a 1 through 3 or a 4 through 6. This is kind of a crude model that approximates a lot of different processes with just this one parameter, P and a priority. We don't know what that parameter is. We can go out there, we can try to generate some data. We can see how many people engaged with the website. We can see how many patients survived, we can see how many patients were infected. But that's just one data set. Right. That doesn't tell us what the actual probability of success or engagement or infection is. And so we need to somehow take that data, take the number of successes that we observed, and turn it into some quantification of what that true probability is.
Great. So to break that down even more very briefly, let's say three out of ten people are infected. You'd say the probability, crude estimation of the probability would be 0.3 or 3 over 10. But this is just a sample taken from the underlying process. So you need error bars on that three or a distribution of possible probabilities in that sense.
Right. So if you had repeated that measurement, you might have gotten a two or a four. Right. Or sometimes a five, sometimes a zero. And so how do we take the fact that we could have gotten. We could have measured other things into account in our analysis and in Bayesian inference, we do that with two main ingredients. We start with a prior distribution over this parameter that we don't know over this probability, which quantifies what is reasonable about that parameter based on everything that we know before the analysis. Right. So it's really everything that we. All of our information available to us before we make our measurement. And then we have a likelihood function, which is just a mathematical way of Writing down the fact that we have two outcomes and the success is controlled by this probability P. So for those who have had an introductory statistics class, this likelihood function would be a Bernoulli likelihood or a Bernoulli density. And then we put these two things together. So the prior tells us what we knew about our system beforehand. The likelihood tells us in some sense what we learned from the measurement that we made. And together they give us a posterior distribution that quantifies everything that we know about this probability P condition on the measurement that we've made. So we might start off with a prior distribution that's very diffuse because we don't know a lot about this probability beforehand. But then we go and make our measurement 3/10. That tells us a lot about what the data is trying to tell us. And the more throws we have, the more trials we have, the more informative that likelihood is. And then we end up with this posterior distribution that concentrates. Right. That contracts away from that initial prior to something that's a little bit more narrow. And that narrowing is our learning process. Right. It's a reduction of uncertainty because of the information that was contained in the data.
Great. And so what you see in the posterior then is that maybe it was 50% likely that the click through rate was between 0.2 and 0.4 or it was 10% likely that it was between 0.5 and 0.7 or something like that.
Right, exactly. If you give me kind of any interval of probabilities, I can tell you how much uncertainty, how much certainty I place on that, how consistent those set of values is.
Great. And one of the beautiful things is, you see, the more data you get, the narrower the distribution gets. So the more certain you can be of your estimates.
Right. I mean, it's a self consistent way of building up these inferences, which is a pretty remarkable mathematical feat. That said, we have to be careful. Right. Because that narrowing does rely on the assumptions that we put into our model. If you build a bad model, it will narrow to a bad value. Right. It will pull away from what we actually see. And so you always have to be cognizant of that. Right. It's always. It's a powerful tool within the scope of the assumptions that we make.
Absolutely. And that's similar to saying a bad carpenter will build not great tables.
Yeah, right. Garbage in, garbage out.
Yeah. There's another objection to this type of modeling that I hear quite often is that, oh, how do you choose the prior? Your model is so dependent on the prior. And I'd just like you to demystify that for us a bit.
In frequent disinference, there's this feeling of, well, okay, I just choose this model, I just choose this likelihood, and then I'm done and I get some answer out. And then you contrast that to Bayesian inference, where you have this likelihood and you have this prior distribution. And it's very easy to look at that and say, well, there's more stuff you have to do here. Whereas over in the frequentist analysis, I didn't have to do any of that. And unfortunately, that's a misreading of how frequentist statistics works. It turns out to do a proper frequentness analysis, you need that likelihood. You also need a lot of other things. You need loss functions, you need calibration criteria. It's a very sophisticated statistical approach with a lot of inputs. And ultimately, it's not that frequentness inference or Bayesian inference is better than anything else. They're different approaches that require different assumptions. And that's one of the things that we have to come to grips with when we're doing statistics. Those statistics, that analysis that we do is going to depend on our assumptions. There's no correct set of assumptions. My assumptions aren't better than yours. All that matters is that we can communicate those assumptions, we can discuss them, we can agree upon them, and if we agree upon them, then we have to agree at what the consequences of those assumptions are.
Absolutely. And something that I think is very much in favor of Bayesian inference is that you actually have to make your assumptions explicit, which you can do in a frequentist setting, but a lot of the time it isn't done. Yeah.
And that's, I think, an unfortunate consequence of a lot of the way that physics is taught, where you kind of learn these rote methodologies without really paying attention to what assumptions are implicit in them. Whereas Bayesian inference is really all about specifying the model and then putting everything together and getting your posterior right. The kind of nice workflow, very elegant workflow of Bayesian inference makes it very, very easy to see what your assumptions are. And a lot of people find that unsettling. But that's a really, really powerful feature, and it really allows you to not only acknowledge that you're making assumptions, but it really helps you understand the consequences of those assumptions. Right. By looking at how those assumptions affect your analysis, both with the data that you collected and with simulated data, you really get a sense of what those assumptions mean in a mathematical setting, which is extraordinarily powerful. In fact, that's where a lot of our research is going to these days, is really trying to formalize that procedure and giving users a way of really understanding the consequences of the assumptions that they make.
This is really cool because one of the things we're here to talk about is robust data science and robustifying data science with statistical modeling. And I think we're actually converging on a very important part of developing a robust data science practice, which is in terms of making your assumptions explicit.
Yeah, absolutely. I mean, remember, it goes back to this idea of incorporating domain expertise and statistical expertise. As a statistician, I don't know what good assumptions are in a given field. I might have some biases about them, I may have some intuitions about it, but ultimately it's the domain expert who's going to tell me what assumptions are reasonable or not. But we can't have that discussion unless they can admit what the assumptions are. And building a model forces us to engage on what those assumptions are and whether or not they're relevant. It's really cool. It really does force this out of you. Many practitioners, when you start having these conversations, are very hesitant to admit to the assumptions that they're making. But it's almost, you know, it's a little addicting. Right. Once you finally get over that hump, you just see these assumptions everywhere, and all you want to do is share and discuss, which is a remarkable thing.
So I now want to pivot to the elephant in the room, which is something we've been tiptoeing around. How does data science differ from statistical inference? Because we've been discussing both.
Right, right. So this might be a little bit controversial, but I actually don't think there's that much of a difference between data science and statistical inference. I think a lot of the seeming separation between the two really has to do with the fact of how statistics is taught. In particular, in academia, statistics has become this very theoretical topic in a lot of cases. There's some very, very powerful exceptions. But in general, most statistics departments do a lot of theory. And so when applied, people are trying to develop analyses. There's not a lot for them to use, and so they tend to make stuff up on their own. And I think this is one of the reasons you saw the rise of machine learning, was that there was this niche that really wasn't being served, and computer science stepped in and offered a lot of tools. And there's been kind of an evolution of machine learning, and it's become this very powerful field, but it's also separated out a little bit from a lot of applied analyses. It's really focused on what it's good at. And this has then given rise to this new niche where data science has come in. The problem with this, from my perspective, is that these niches are all statistics. None of this is new stuff, it's all statistical analysis. The niches are not due to the tasks that need to be done. Rather, the niches are a consequence of what documentation and teaching and tools aren't being provided. And the danger in all of this is that that statistical analysis that we have to build, if we want it to be robust, if we want our assumptions to be clear, if we want everything to be mathematically self consistent, that has to be an integrated analysis. Right. I had to sit down and work with people who collected the data, work with the domain experts who understand the context of that data and the consequences of assumptions to build an analysis that's compatible with all of that. And then I have to work with them to report those analyses and visualize the results. And I might even work with stakeholders to help turn those inferences into decisions. But if we start divorcing those steps, if I have to build a model without talking to people who collected the data, or the stakeholders are going to make decisions with it, then that analysis is going to suffer. And if we start having data science is this kind of set of tools that people specialize in, and statistics is over here on the side and they're not talking to each other, that's going to lead to worse analyses.
I agree with that.
Yeah, right. So there's a lot of very powerful work being done in data science. There's a lot of very powerful work being done in statistics. And I think all of that would be much more beneficial to both theory and the applied fields if people were speaking the same language. And I think that language is statistics, not because statistics is better, but just rather because it is that mathematical formalism that really does give us a foundation to build off of.
So I agree with a lot of what you've said completely. I want to unpack a few things and I actually want to play devil's advocate as well, in the sense that there are arguments that data science is merely the statistics combined with programming skills or hacking skills, and that being a statistician doesn't necessarily involve those hacking skills. And this is something that gave birth to the discipline of data science along with other things. So how do you view that?
Yeah, so I mean, very much in statistics there is this one kind of compartmentalization. There is the inferential theory you put down. And then there's the rules of how that theory works, and then there's the assumptions that you have to introduce to it. And so the math is all concerned with what are the rules, how do you have to write things down, what's the language that we use to talk about things. Then there's a question of how do we implement those rules? And then there's a question of what assumptions we want to introduce and how do we develop workflows for introducing those assumptions. And, you know, there is an argument there that you could separate those out. But at the same time, if I'm implementing these statistical inferential rules in software, I need to know how those rules work.
So then your argument is that programming is actually part of statistics.
Absolutely.
How far do we go, though? I want to keep it relatively high level. How far do we go? Is database management then, part of statistics? Is scalable computation using Hadoop, part of statistics, putting machine learning, learning algorithms into production, or building data products. Would you argue that all of these are part of statistics?
Yes. So, for example, let's talk about database management. Right. Database management involves the possibility of data being corrupted. Database management involves how the data gets organized, collected and selected. Right. That's all part of the measurement process. If I don't know how that's working, then I don't know how to build a model. Now, I can approximate that by ignoring a lot of that subtlety, but that limits how much I can learn from that data. I don't have to be a database expert, but I have to be sitting in a room where I can talk to that database expert. We have to be able to communicate to integrate and build this model together. I think something like Hadoop scalable computation, this is another really important factor. A lot of that scalable computation just isn't really compatible with the underlying rules of probability. These kind of very rigid ways that we have to do our inferences, they don't quite mesh with that stuff. And there are certain cases where they do. If you have very simple models, there is a natural way to exploit that, those computational resources. But if you don't have those simple models, then you can't. And so if you just have somebody who's an expert in Hadoop and tries to throw Hadoop at everything, they're going to be misapplying it in a lot of cases.
In that case, I think this is a matter of semantics in a lot of ways, because I think what I gather you're saying is that Anything you may need to do to work with data and to model comes under the term statistics. Whereas my, my argument is that when you start having to do all these other things, such as actually building data products, you become a data scientist as opposed to a statistician. But your statement is that these are enveloped in statistics because they're involved in the model building process.
Right. So in my opinion, the fundamental language that we're building all of this off of is statistics. Right. The computer scientists, you're implementing statistical theory, the model builders are building models that should be compatible with that statistical theory. The people who are collecting and curating data, they're doing that as part of a measurement process that needs to then be incorporated into the statistical theory. So maybe a better way of saying it is that I think when these analyses have to be built, you need a product manager. And maybe the best way of saying it is that that product manager should be a statistician. And so if you want to, you know, it is semantics, it is very much semantics. But I think that whoever's integrating all that together, who's ever having that communication, needs to be very well versed in the statistical theory to ensure that the resulting analysis is robust and that it will lead to very solid decision making.
Absolutely, and I agree with that completely. And I'm pretty much 75% sold on there being not much of a distinction between data science and statistics, but I'll have to put large error bars on that. 75, 75%.
Large uncertainties.
Exactly. Great. So what do you think are the biggest challenges facing our community as a whole? Whether we call it statistics or data science, or really the modeling and the modeling community moving forward?
Yeah, I mean, I think perhaps the biggest challenge is being open and transparent. You know, we're certainly in the news. There's a lot of discussion about data being used in various ways. Even when data is publicly available, there's not a lot of transparency in how the data is used. And so I think to really ensure that we're using data responsibly, to ensure that whatever decision making processes we're doing are fair and equitable as much as possible, as much as feasible within the mathematics, we need to be open and transparent. We need to speak the same language so that we can all talk to each other and evaluate the assumptions going into these things. And I think one of the biggest challenges is deciding what that language will be. On one hand, it has to be compatible with the mathematics, but on the other hand, it has to be accessible to the domain experts. Right. If we're going to build up some analysis, we need social scientists involved, we need scientists involved, we need computer scientists involved. And somehow we have to all speak the same language that allows us to get that done. And that's, I think, going to be a real challenge. And, and hopefully tools like probabilistic programming languages will go a long way to filling some of that gap. It probably won't be the final solution, but hopefully it's a stepping stone towards that. I think a core layer of that is just being really vigilant about the assumptions. Right. Just acknowledging that there's uncertainty, and then uncertainty depends on the assumptions that we put into our models. And once we've done that, just being vigilant about understanding the consequences of those assumptions.
Absolutely. And particularly, as you say, with more and more of the public eye on the modeling and data analysis and data science community, we do need to be vigilant and be responsible for the models we built.
Yeah, right. I mean, it's very easy to sit down and take some data and plug it into some program that automates an analysis and just drop it out and it just becomes this kind of rote commodity thing. But if you're really exploiting statistics to make decisions, then there's important consequences to that process. Whether you're in medicine or science or industry, there's a certain temptation to just take data, plug it into some black box tool, and just do whatever that tool tells you to. Even if that tool isn't telling you to do something evil, if it's telling you to do something that's not consistent with the mathematics or is pretty fragile, it can lead to really bad decision making that has consequences on real people. And I think the more data and statistics becomes integrated into our decision making processes, as potentially powerful as that is, the more we have to be cognizant and responsible to make sure that we're doing that right.
We'll jump right back into our interview with Mike after a short segment. Now it's time for a segment called Data Science Pitfalls. I want to ask you a question. How objective do you think data science is? Well, the point of this segment is to bring to everyone's attention that science, including data science, isn't necessarily as objective as we sometimes assume. There's a wonderful paper that illustrates this particularly well. The paper is called Many Analysts One Dataset Making Transparent How Variations in Analytical Choices affect results. Now, 29 separate teams of scientists were given the same data set and posed the same research question. Are soccer Referees More Likely to give red cards to dark skin toned players than light skin toned players. Not only did the discovered effect sizes vary dramatically, 2/3 of the teams found a positive effect, while one third of teams actually found no effect at all. How could something like that happen, you might ask? Well, right off the bat, there were more than three separate types of models that were used by various teams, including linear regression, logistic regression, and Poisson regression. On top of that, some teams chose to statistically control for the player, some chose to control for the referee, and others chose to control for both or neither. In fact, among the 29 teams, there was a whopping 21 unique sets of covariates. Most strikingly to me, only one single covariate was even used in over half of the analyses. Okay, so now you get how it happened. You're probably wondering why this would happen. Maybe confirmation bias was at play. That is, researchers were just subconsciously finding ways to confirm what they already believed. What's really fascinating is that that's not what happened. The authors found no correlation between a team's prior beliefs about the research question and the result that they came up with. Could it then be that some researchers were just better than others? Did teams with more experience converge on the real answer? Again, no. Teams with lots of statistical experience had just as much variability in their results as more junior teams. You might then think that surely we can all figure out what the right analytical technique is after the fact. That's what peer review is for. It's how science weeds out the bad stuff and keeps the good stuff. Sorry to burst your bubble yet again, but peer ratings of quality also had no significant correlation to the reported effect size. So what's the implication here? Were some teams just p hacking to get statistically significant results? The answer, once again, is no. What's going on here is different. Due to the nature of the project, nobody really had a terribly high incentive to find a significant result because no one team was actually trying to get their result published. It's pretty reasonable to assume that everyone was making their best faith effort. So while this effect isn't as malicious as p hacking, it's actually all the more disturbing for that. What does this mean for data science? Should we just pack up and go home? Definitely not. One potential avenue is the crowdsource and bootstrap data science work. But we're out of time. For now, we'll be digging deeper into what exactly all of this means for data science in next week's episode of Data Framed, when I speak with Lucas Vermeer, a data scientist@booking.com who works to help hundreds of people run experiments to make booking better. In this conversation, you'll see the impact that papers such as many analysts one data set have on data science@booking.com time to get straight back into our chat with Mike. So we've discussed a lot about the different type of work you've done, the tools you're building. I'm just wondering what one of your favorite statistical techniques or methodologies is.
Well, as I mentioned before, I kind of got into statistics via this algorithm called Hamiltonian Monte Carlo, which I'm particularly biased towards. It's a really, really powerful algorithm, but the mathematics behind it is just super cool. I've done a lot of research on it and I'm still in love. Right. It's one of those relationships where you see the older statistician and his algorithm walking together and they're still in love.
It's a beautiful picture.
It's amazing. And I've just learned so much about statistics and computation from really trying to understand this algorithm and implementing it as efficiently as possible. But as I said before with Stan, all that stuff is ideally hidden away from users. And that leaves modeling techniques. I think one of the most powerful yet underutilized modeling techniques is hierarchical modeling. Hierarchical modeling is a very generic way of trying to incorporate heterogeneity into your analysis. So if you're modeling whether or not somebody's going to get sick or not, everyone's different, everyone's going to respond to the same illness differently. Our physiologies are just so variable. And if we just assumed everyone was the same, that leads to some pretty significant bias in the results that we get. But if we explicitly model the heterogeneity, if we allow people just to be a little bit different from the average, then we can incorporate a lot of that variation into the analysis in a self consistent way. And this really ensures that we get very well calibrated uncertainties. We can significantly improve our uncertainties in a lot of cases. It's really, really powerful and it's just omnipresent in its applicability.
Fantastic. And if people wanted to build hierarchical models, they could do this using Stan.
Right? I mean, that's literally why Stan was developed. Stan came out of Columbia University. Andrew Gelman was trying to build these hierarchical models in Windbugs, which is a previous tool that was very revolutionary for its time, but it just wasn't quite up for fitting these hierarchical models. And so they started playing around with these more modern tools and Hamiltoni Monte Carlo and automatic differentiation, all as a way of fitting these hierarchical models. And we got this wonderful toolkit out of it as a consequence.
So do you have any final call to action for our listeners out there?
I think one of the most important things when trying to robust statistics isn't so much getting the answer right, it's acknowledging that you might not have gotten the answer right. And so just acknowledging that there's uncertainty, being cognizant of that, recognizing that uncertainty is impacted by assumptions, once that becomes a priority in your mindset, even if you don't necessarily know how to model that better or you don't know how to improve your analysis, just that you're aware of that, I think has a very powerful subconscious effect on how you report your results, the words you use, how strong your claims are. And if everyone was just a little bit more aware of uncertainty and presented the results in a little bit more of a careful way, I think go a long way towards improving communication between data scientists and statisticians and data scientists and other data scientists and all of us in the public, all the stakeholders.
Involved in all these analyses. So listen to Mike, right? Acknowledge uncertainty and the impact of the assumptions you make. Mike, it's been an absolute pleasure having you on the show.
Thanks so much for the talk, Hugo. It's always, always a blast.
It is. Thanks for joining our conversation with Michael Bettencourt about robustifying your data science with statistical modeling. We saw just how fragile decision making can be if you're building models without understanding all the assumptions that go into them. Mike gave a wonderful example of how he and his collaborators discovered through their analysis that their malaria experiment didn't work as thought and that their assumptions about the experimental setup were incorrect. On top of this, it became clear that a serious part of data science work is to faithfully characterize the uncertainty of your models, your predictions and parameter estimates, and that robust decision making relies heavily on such faithful characterizations. Make sure to check out our next episode, a conversation with Lucas Vermeer, senior product owner, data scientist, and online experiment overlord@booking.com, the world's largest accommodations provider. Lucas is responsible for experimentation at Booking in the broader sense of the word, from infrastructure and tools used to run experiments, methodology and metrics that help people make decisions, to training and culture that help people understand what to do. This is a small slice of what we'll be discussing in our conversation about data science@booking.com I'm your host, Hugo Baun Anderson. You can follow me on Twitter hugobown and datacamp. At datacamp, you can find all our episodes and show notes@datacamp.com Community podcast.
It.
More from Richie

#359 My Best Friend is AI with Valerie Tiberius, Professor of Philosophy at University of Minnesota







How AI Agents Will Work While You Sleep | Ruslan Salakhutdinov, Professor at Carnegie Mellon

#358 How AI Agents Will Work While You Sleep | Ruslan Salakhutdinov, Professor at Carnegie Mellon

