#26 Spreadsheets in Data Science (with Jenny Bryan)
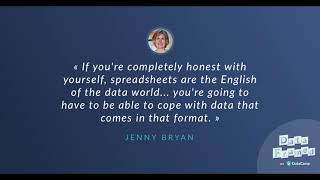
Jenny Bryan, a software engineer at RStudio, explains why spreadsheets are everywhere and what makes them frustrating: hidden logic, formatting that encodes data, error-prone edits. She discusses R packages like readxl and googlesheets that improve spreadsheet integration, and practical fixes like named ranges and separating data from formulas.
Chapters
In this episode of Data Framed, a Data Camp podcast, I'll be speaking with Jenny Bryan, a recovering biostatistician who takes special delight in eliminating the small agonies of data analysis. Jenny is a software engineer at RStudio and an associate professor of statistics on leave at the University of British Columbia. Jenny and I will be tackling one of the more controversial aspects of data science. Yep, you got it. The use of spreadsheets. Why are spreadsheets so ubiquitous in data analytics? Why are so many data scientists anti spreadsheet? Join us to discover why spreadsheets are in fact necessary in data analytics and how spreadsheet workflows can be incorporated into more general data science flows in sustainable and healthy ways. Welcome to the future. I'm Hugo Baun Andersen, a Data Scientist at DataCamp, and this is Dataframe. Welcome to Data Framed, a weekly datacamp podcast exploring what data science looks like on the ground for working data scientists and what problems it can solve. I'm your host, Hugo Bown Anderson. You can follow me on Twitter HugoBownt and DataCamp@DataCamp. You can find all our episodes and show notes@datacamp.com community podcast. Hi Jenny, and welcome to Data Framed.
Thank you very much for having me.
It's such a pleasure to have you on the show. And we're here today to talk about spreadsheets in data science. The do's and don'ts, the whys and why nots. Before that, I'd like to find out a bit about you historically, how you got into the data science community, but even before that, and I know I'm already constructing a complex web of ideas and conversation topics, I'd like you to give us a little teaser of what you're thinking about, what you're working on, the moment, particularly with respect to using R to interface with spreadsheets.
Sure. So, yeah, my current main project for R development is doing a reboot of a package I released a couple years ago called Google Sheets. So I'm doing a reboot of it for two reasons. One is that I have had a major upgrade since then and have better ideas of how to organize things internally. And also the Google Sheets API has had a major version update since then. And so between those two things, it would be very nice to reboot this package and then somewhat unplanned. I also spent a week or two recently doing a release of Read Excel, so I feel like I'm actually completely in my spreadsheet zone, which is it's more about the internals of the spreadsheets than the usage. But it definitely feels like where my head is at the moment.
What's the basic idea of this package? I mean, what would the user experience be like or what can they do with it?
I mean, basically we want there to be a function that plays the role of Read Table or read CSV, but it's Read Sheet or Read Excel. The idea is to have this blissfully simple experience where you point this function at a local file in the case of an Excel spreadsheet, or a Google Sheet in the case of Google Sheets, and it just shows up in your workspace as a data frame. So that's the goal. Google Sheets can write spreadsheets, which we do not attempt to do with Read Excel, but I think it's mostly about the reading.
Yeah. And this is incredibly important. Right, because a lot of people are, are working in spreadsheets, a lot of people are working in languages such as R. And it's really, I suppose, essentially to facilitate communication and collaborative, reproducible workflows between these communities.
Yeah. I think if you're completely honest with yourself, like, spreadsheets are kind of like the English of the data world, like everyone speaks it. And even if that's not your language of choice, unless you live in a pretty rarefied environment, like, you're going to have to be able to cope with data that comes in that format and maybe even emit that format as well. I suppose people who work at companies that are Web 2.0 companies and everything is being, all the data is being collected by professional data engineers from the beginning. Like, they certainly don't have to deal with this, and they're mostly dealing with databases. But the long tail of data analysts and data scientists are working with data that was collected in very, very different ways. And spreadsheets just seem to be unavoidable.
Agreed. And this is something we're going to delve into a lot later. Arguments for and against even using spreadsheets. You know, there are people in the community who want to get rid of spreadsheets entirely. So we're going to delve into all of these types of things and see why essentially we need to accept and almost develop a system of best practices around the use of spreadsheets. But before all that, I'd love to talk about your background and also what you're known for in the data science community. So what do people know you for currently?
Hmm, that's a good question. Maybe Google Sheets or Read Excel. I hope I stand for someone who is right at the interface between the R user community and the R developer community so that I do enough package development at a high enough level that I have credibility there, but that I also am very, very in touch with my roots as an applied statistician and data analyst and remember what the pains and the joys of that are and let that inform the packages I work on or influence the people around me who are working on other packages and really try to be like a diplomat there or create productive conversations between the people making the tools and the people using the tools.
And is there a need for diplomacy in this situation?
I don't know if it's diplomacy because that makes it sound almost like people are in disagreement. So maybe it's more translation and pointing out specific things about a user experience that might not occur to you if you aren't a primary data analyst all the time anymore. I mean, ironically, the more deep you get into tool development, like, the less time you have to do data analysis yourself. So it's also increasingly easy to get off in la la land about what you think is important. And this is why, even though I'm transitioning away from being a faculty member and I'm in the process of resigning, I think I will continue to do some teaching because that's actually my best current mechanism for constantly reminding myself about what it actually feels like to use all of these things in the real world and to use them starting from zero, not having some huge tower of abstraction that you have access to for sure.
And I like this idea that you described, sitting at the interface between users and developers. And perhaps instead of diplomacy, we can think of it in terms of facilitating conversations and acts of translation. And I think I want to say one of your greatest creations, but that isn't actually what I mean, because I have no idea about all the things you've created. But one of. One of the. Your first package I was introduced to, I think was. Was Reprex, which is about.
Oh yeah, you know, it's.
It's as. As you. I mean, I'm. I'm just about to tell you what your package does, so hopefully I get it right. But for the purposes of the listeners, it helps people to create reproducible examples to put on GitHub issues or stack overflow or whatever it may be. Stack overflow, right. This is a place where the, the wall, I'll call it a wall between users and developers can be really, really tough sometimes. Right. So maybe you can speak to this barrier and how Reprex will help in this situation.
Yeah, I guess that Also reminds me, but I think another thing that maybe people know me from, because it was the first thing I was brave enough to start really putting out. There was a course I taught at UBC and developed called STAT545. It started as our department's data analysis course and I took ownership of it about 10 years ago. And then I just gradually made it more and more about modern R and data science and data wrangling. And so for the past couple years I taught that course entirely on GitHub. And at the end of the semester I would analyze our GitHub conversations. We used Issues as a discussion forum basically. And I saw that I was commenting on 3 to 500 issue threads per semester. And those conversations are most effective for everyone involved if there's a lot of code in them, either instead of or in addition to prose. And so I developed Reprex out of desperation basically because I constantly wanted to encourage these students to like give me a little piece of code that actually runs.
That you can run locally.
Yeah, that I can immediately run. Like it's self contained, that shows me your error and like drops me right into your personal pain. And then I also of course wanted to share my solutions with them. And so I developed Reprex really as a tool for me to stay sane in stat 545 because there's nothing there that you can't do otherwise. Like you can always create a standalone R script or R markdown file and use existing facilities with Knitr and the R markdown package to do this. But like that was always like just enough friction that I didn't do it. And so I was like, it seems like a silly idea for a package, but I'm just going to create a package so that I can put four lines of R code on my clipboard and get it perfectly formatted for the venues where I most often share these things. And it was, it encouraged me to talk more through code than sort of hand waving and speculation. And so that was how it got started.
That's fantastic. And I think GitHub is an incredibly important place for any type of collaborative code writing issue raising infrastructure. But I also think Stack overflow, where, you know, a common trope of Stack overflow is first time question askers asking a question and a snarky developer or expert coming and saying, hey, why didn't you include reproducible code? Why can't you do this? And so forth. So Reprex actually very much helps dissolve that barrier between users and developers in that case as well.
Yeah, Because I mean, I am fairly sympathetic to the. It feels like this person didn't do their homework. But then I also know like a lot of people don't even know what that means. So part of what I like also about Reprex is that it administers a great deal of that tough love in the privacy of your own home. So like it'll, it will error if you haven't loaded the packages and it will error if you're using data that doesn't exist or that you know that that only exists because of all the code you ran before lunch yesterday. But, but you're not having to expose all of these missteps publicly. So it really lets you get your ducks in a row before you go to stack overflow or GitHub. And like you could before stepping out of the house. Yeah, like you could still have an example that was way too complicated and that people might regret. But to the extent that there are just like technical checks as to whether this is a self contained example, it lets you sort all of that out for yourself, which I like.
Yeah, and that's incredibly important because to be clear, when people get shut down as first time users of Stack Overflow, there's a high probability they'll never return to ask questions. So we're literally not even letting people in the gate.
Yeah. So having this very unemotional sort of tool that can help you get maybe 60, 70% there, there's still an art to making a minimal example. But then again, once you can do that, you're often in the situation where you can answer your own question too.
And something you mentioned there was the idea of empathy for early users. And I think this really ties into the conversation about empathizing with people who use spreadsheets. So before we get into arguments for and against the use of spreadsheets in the data community, data science, analytics, whatever you want to call it, I want you to tell me why you think so many people use spreadsheets.
Yeah, I think there's a couple reasons, but I mean, the first one is like everyone has it installed and I think developers underestimate the difficulty of getting software environments set up. And so I think one huge draw of spreadsheets is they just feel, and basically are ubiquitous. Like even if people don't have Office installed, which is pretty unusual for your sort of average person, like they usually do, you can just go to Google Drive and create a spreadsheet. So I think the fact that there is essentially no barrier to entry is really important.
And that means you can do stuff right away. Right.
And, and there's no, just sort of black screen of death with a blinking cursor. Like you just like put your cursor in a cell and start doing things. And most people can follow their nose and get something accomplished and they don't have these wildly frustrating experiences. Early on. You could have it later, but early on where like you just are completely shut down because you have a misplaced comma, you know, once you start doing fancier things with Excel where you're basically programming with it, you can also get treated to these frustrating experiences. But yeah, I think that ubiquity and the fact that lots of people can follow their nose and do basic tasks makes them incredibly appealing.
And I also think though in the, I suppose programming community, RStudio has done a good job at, for example, abstracting over the shell or terminal. So you can just launch RStudio and install packages there instead of doing it through using Unix commands or whatever it may be.
Yeah, that's true. More things that I've mentioned in the past that are very appealing about spreadsheets are, you know, people will basically put different data sets on their different worksheets and they might use one worksheet as a place where they put notes, but the spreadsheet still acts as this receptacle that holds the disparate parts of a project together. And if, if you aren't someone who has a lot of file system discipline about putting things in folders or maybe using zip archives to transmit things that basically like it's file organization that the spreadsheet is doing for you, it's like keeping several tables together is also useful. And the fact that they're reactive so people will create summary cells and charts and pivot tables and those things automatically update when the data updates.
Yeah, you don't need to run a script again, right?
Yeah, like you don't need to rerun things. So there's a lot of sort of practical problems that they do provide, you know, very simple solutions to.
Yeah. And this is enough for a lot of people, right?
It is. If you don't analyze data for a living. I think there's a lot of people for whom spreadsheets is probably the right place to be doing this. It doesn't mean that some of their practices can't get better. But I, I think it's, it's a reasonable place to do data analysis for a lot of types of people and types of jobs.
So having established that, why are certain subpopulations of the data community so anti spreadsheet, and in particular, like a lot of us people who evangelize and use R and Python on a daily basis.
Yeah. So I've tried to figure this out because I also can very easily get into a scornful, mean attitude about this. And I think it's. I think it's because so many of us have had some spreadsheet or multiple spreadsheets sent to us that exhibited so many problematic behaviors that wasted so much of our time, that all that negative energy, we store it up and then occasionally just like, emit it back out, either at spreadsheets in general or at people who use spreadsheets. And it makes sense because if you do enough data analysis and people provide you this data in spreadsheets, there are lots of things that people do in spreadsheets that, on the other end, just waste colossal amounts of time on your behalf. And it is hard to not get testy about that.
Yeah. And I think, correct me if I'm wrong, but you, for one, actually have a GitHub repo somewhere. We'll find it and include it in the show notes if this is true. But that collects scary Excel stories, right?
Oh, that's right. Yeah. I think that did not send you that link, but maybe you found it. Yes. Yeah, because there's. There's scary technical things about Excel which, honestly are not the ones that get me that excited. Those are about, like, numerical accuracy and properties of its random number generator or whatever.
Yeah.
I am more. I don't know if enthusiastic is the right word, but, you know, interested in the stories of where sort of human frailty and spreadsheets combine to lead to great, great messes. I gave a talk at User when it was at Stanford on spreadsheets, and leading up to that, I asked people to share scary Excel stories with me, and I got a ton of really interesting responses, many of which people were like, I will tell you this privately, but I can't tell you in public because our company, our company lost $20 million because of the spreadsheet mistake. There were multiple things where the reason that some people couldn't share them publicly was that the scale of the loss caused by some regrettable spreadsheet behavior would have been too embarrassing. So those are the stories that I find more interesting because I think it indicates when someone's workflow has outgrown the spreadsheet model. So that's, I guess, the downside. They're ubiquitous, they're easy, but it's really hard to recognize the point at which it is no longer the right tool for the job, because on any given day you're going to be more effective if you just keep using it then stopping what you're doing, trading everyone up on databases and R and Python. And so I think that that's an organizational challenge.
Yeah. So then knowing strong arguments for using spreadsheets or why people, a lot of people use them, and knowing good reasons for people being anti spreadsheet, what are the strongest arguments for a tighter integration between data science and spreadsheets as opposed to, you know, getting rid of them completely?
I think it's just realism. Yeah, yeah, I think totally. Yeah. I think that's the took in one word. Like you just. There's too much data. Even if we stop producing them today, which is completely implausible, we already have too much data that's locked into them to not support that format. I maintain read Excel now, and I spend as much or more time on the XLS side of it as the xlsx. So on the real legacy spreadsheets, when I first started working on it, I was like, that's insane. Aren't they going away? But they're not going away because first of all, we have this huge stockpile of legacy spreadsheets and then there are a lot of legacy tools that are still pumping out weird XLS files as we speak. So, yeah, I think just pure realism is you have to keep dealing with it.
And I suppose also spreadsheets are good for a lot of things that maybe you don't want to do in R or Python, right?
Yeah, I mean, I think they're very handy for data entry. They're not the ideal tool for that, but for lightweight data entry, they're very handy. I've used some of the CSV editors that aim to wean people off of spreadsheets, but you can just tell that Microsoft has lavished engineering hours on the Excel user interface. And even though I want to love other tools for editing rectangular files, I end up back in Excel even myself. So they're great for data entry, and then I think they're good for just looking at your data. Of course, if you use RStudio, for example, that has a pretty good data frame inspector as well. But I think a lot of people just like the tangibility of seeing their data in a rectangle, preferably a wide rectangle right in front of their eyes, and they can scroll around and it.
Yeah, and you actually, you shared with me recently an article which we'll link to in the show Notes by Matthew Lincoln at the Getty Research Institute. It was called best practices for using Google Sheets in your data project. And if I recall correctly, this was a huge project of theirs and maybe still ongoing. And it was a database migration in which they had to get a lot of experts involved and they couldn't automate it using a lot of reproducible scripts, but they didn't need to reproduce it as well. It was a one off thing they needed to do. And there's all this, you know, we always rant about reproductive reproducibility. Reproducibility, reproducibility. But that isn't always the conversation that we need to be having in practical terms.
Yeah, I loved this blog post. I think Matt posted it in response to a tweet by Hadley and I'm actually not even sure exactly what. I mean, you would think I would ask this, but. So Hadley asked for good papers on best practices for using. He said Google Sheets. I think a lot of this is just generally relevant.
Can I just quickly ask, when he said for using Google Sheets, did he mean Google Sheets by Google or the package that you developed?
I think he meant Google Sheets by Google. Okay, that was my assumption. And then.
But Matthew also used your package, I think.
Yeah. So then if you want to bring it into. But I think we were just more interested in the way people use that as a platform.
Google Sheets, fantastic.
Capital G, capital S. But yeah, so I think Matt, I have long been suspicious of spreadsheet training that tells people they should keep their spreadsheets in tidy form because. So that would be like, usually that means like tall and skinny.
What a data entry job, right?
Yeah, I think for data entry and data inspection wide is usually better. And like that's why we get paid the big bucks to reshape this stuff in R. So I think you should let people make wide spreadsheets and do the wrangling in a scripting language. So I was really excited to see that. That was one of his points that. Yeah, he has a heading called 80% of sheet design should be for the editors and only 20% for the data scientists as opposed to like forcing people to create that beautiful, tidy data frame because it causes a lot of repetition. There's like more chances for typos. And you know that that gets eliminated if you use some of the other practices he talks about. But I thought that was a really good point that like we can do joins later, we can do reshaping later. So if you apply the principle of do not repeat yourself, like dry it out, that means to let People make separate sheets and wide sheets and we take care of that stuff on the other side.
And could you just remind our listeners what the difference between wide and long is?
So wide. I think the classical way I think of it is maybe you have data on five people and you take their blood pressure at six time points. The wide form of that Data would have five rows, one per person and probably a column of names or IDs, and then what did I say? Six, six columns, one per time point. But then if you want to start making visualizations of that with ggplot2, or if you wanted to take subject specific averages or fit subject specific models, you' want that to be in tall form where you have a column of subject IDs, a column of time points and a column of those blood pressure measurements or whatever. And so in the, in the R world, if you use tidyverse and Tidy R, that's like spread and gather, or going back further in time, it's melt and cast. But these are the verbs that move you between those two forms.
I feel like you've given similar examples before. You did that so well, probably for some time. And of course, as you say, when using statistical programming languages such as R and you want to look at summary statistics across groups or across people, summarize and group buys and this type of stuff, you'll want it in long format, whereas for data entry and just looking at your data purposes, you'll want it in wide. And I love the idea that we don't want to necessarily get all these expert editors in such a project as this. You know, Getty Research Institute's database migration to learn about all this stuff and all the programming so that we can benefit from it. We want them to work in their native environment in wide format, putting the entries in, inspecting it, whatever that may be, so that they can do their best job as well. Right?
Yeah. I mean, literally look at the aspect ratio of your screen. Like you're going to be able to put more data in front of your eyeballs if you make it wide. And so when you are doing a task that will be enhanced by having more data in front of your eyeballs, I think you should be allowed to work with wide data and then someone else or you, but operating in a different mode will make it tall.
We'll jump right back into our interview with Jenny Bryan after a short segment. I am super pumped to bring you our next segment on principles of data science education. Let's cut to the chase. You may know that here at datacamp we have courses on Python, R, SQL, Git and Bash. But I've got some real news for you. We have just released our first two courses in a new technology. Can you guess what it is? If you guess spreadsheets, you've got it. Many people may complain about all the potential pitfalls associated with spreadsheets in data analytic workflows, but as Jenny Bryan just told us, and I quote, if you're completely honest with yourself, spreadsheets are kind of like the English of the data world. Everyone speaks it. And even if that's not your language of choice, unless you live in a pretty rarefied environment, you're going to have to be able to cope with data that comes in that format. The long tail of data analysts and data scientists are working with data that was collected in very, very different ways, and spreadsheets just seem to be unavoidable. End quote. To harness the superpower of data science, we don't want to banish spreadsheets, as if we could anyway. Instead, we want to teach people how to use them well and how to incorporate spreadsheet use into robust data science workflows and pipelines. There are hundreds of millions of humans out there working with data in spreadsheets, and our mission here is to meet these people where they are in order to take them where they need to go. This is the principle of data science education I want to highlight and invoke in this segment. There are two essential points for any budding data analyst and or data scientist. The first point is their current skill set and body of knowledge. The second, the skills and knowledge they need in order to take their careers to the next level. Here at datacamp, we aim to form that path, the connective tissue between those two points. Our first two spreadsheet courses are free and taught by datacamp's very own Vincent van Krunklesven. The first covers spreadsheet basics, and the second covers a slew of the core functionalities of Google Sheets and Excel. We have many more courses in the works and welcome suggestions on what you need to know. Come check them out at Bit ly dataframedspreadsheets. That's Bit Ly Data framed underscore spreadsheets. Who knows, you may even love them so much you jump into learning Python or R, you've got nothing to lose and everything to learn. Time to get straight back into our chat with Jenny Bryan. So these are incredibly strong arguments for a tighter integration between data science and spreadsheets. What are the strongest arguments for data science to get rid of spreadsheets completely.
I think the biggest problem is that it's so easy to create this tossed salad of data and programming logic and formatting and figures, and it's all mixed together. And if you need to come back and operate on one of those things or see how changes in the data lead to changes in the summaries, because it's just all mixed up together in a way that's incredibly hard to separate. You outgrow this workflow very quickly because it's so hard to control and track evolution and make sure that you're not changing things you don't mean to change. We've all had that dialogue box where you close Excel after just looking at something and it's like, would you like to save changes? Yes. You're like, I don't think I meant to make any changes. Did I mean to make a change? And then you can't remember. So it does feel kind of like the Wild west, where it's very hard to control things quite the way you'd like to. So that's where I think it really breaks down.
Would version control for spreadsheets help with this in some way?
Oh, so Greg Wilson, I think this has been like one of his biggest wish list items for a long time. So he's the founder of software carpentry and is now with you at Data Camp. I think that'd be amazing if we had, like, truly usable version control for spreadsheets. And I think there are some early efforts at that. It's just also, it's really hard to know, you know, how would you inspect the diffs? Like, what would that even look like? That's just a very, very hard problem that, you know, maybe by that time you should be working in a system where your data is separate from your logic. But it is true that Google Sheets in particular, as being just part of Google Drive and Google Docs in general, their version control is getting better and better. And I do find it reasonable to look at a Google Sheets evolution over time. I don't work with it in the same sophisticated way that I work with git histories and commits and diffs, but I have some hope, actually, that version control for spreadsheets is part of the answer.
And something you spoke to was the fact that we've really got this salad of everything, you know, data, logic, formatting, ui, all of these things. Is there a world in which we could slowly tease these apart and separate them by encouraging, maybe forcing, in some ways, best practices? So one example I think would be having spreadsheets in which formulas aren't allowed in cells.
Yeah, well, and that's part of the promise of these CSV editors that like, just like a whole whack of features has just been deleted. And so there's a lot of stuff that has simply been made impossible, which is good. Yeah. So forcing people to keep data separate from logic, like, well, one way to do that is to not have formulas. I think another way in our existing spreadsheet applications is to designate by naming certain worksheets. Our data sheets and other worksheets are places where we do summary statistics or makes figures and you know, use the tools that the spreadsheets provide for protecting different parts of the sheet in different ways and naming different parts of the sheet in different ways. In this new reboot of the Google Sheets package, I'm going to make sure that named regions are a first class way of reading data out of a sheet so that it works just as well as specifying a worksheet or a range. Because I feel like they could be a mighty weapon in fighting this battle. That if you could get your spreadsheet using collaborator to make sure that they're always adding data to a specific named region, then they can go do whatever they want in other parts of the spreadsheet. But you will always know that you can pull out the raw data cleanly.
That's really cool. And of course there are, there's a whole list of things that we could encourage and potentially prohibit. Matt Lincoln, once again from the Getty Research Institute, in the blog post we've been discussing, mentions a variety of examples like using formatting only to help communicate or highlight data content, if that. Right. But definitely never use formatting to carry data.
Yes. Yeah. So conditional formatting is great, but not formatting to convey, you know, imputed versus measured. Actually, there's a spreadsheet in my life that spawned my interest in Google Sheets, where my husband and one of his university friends had a ridiculous and I now believe, sort of unsafe weight loss bet where they tracked their weight. And we actually now have, I think something like seven years of daily weight on these two guys. But recently my husband emailed me and he was like, how do I get out the data? As for whether something's in italics or not? And I was like, why do you even need to know that? And he's like, well, the italics are where we. Like, someone was on vacation. And mostly these two men actually travel with their scales, which is crazy, but sometimes they don't. Or so the italics might mean, do.
They Sell travel scales. I don't mean to.
No, at least we travel with the real.
Okay, awesome. That's commitment.
It's crazy. So the italics either indicate fake data where there was some interpolation or using random scale in hotel or whatever. But yeah, so now they've backed themselves into this corner where they have embodied data in font, which is a big. No, no.
Yeah, absolutely.
I think.
One of the basic ways I like to think about, I think a lot of people do, is if you can't export it to a CSV, retaining all the information in the data. There's a challenge there.
Yes, for sure. Although it is true. Another thing I'm doing in this reboot of Google Sheets is one of the ways you can get the data back out is as like you can just get raw cell data. So it's still arranged in the rectangle that you expect, but all the columns are list columns and the data available for a cell is just everything the API sends, including the formatting. So if you.
Oh cool.
Do find yourself in one of these really regrettable situations, I'm trying to provide as much help as I can to let the data analyst dig around in there and get it out without having to use some sort of special purpose package.
That's awesome because once again, that speaks to your self professed role as a realist. Right.
As a realist. And I don't think I can build every possible. I can't build something to fulfill everyone's downstream need. So it's more like while I'm here and I have all of this information sitting in a little list, let me just create an exit point for this function right now. And you know, I've dealt with auth for you. I've translated human oriented ranges into the language of the API. I've arranged it in a rectangle, but before I do my column typing and column coercion, I could just give it to you right now. And so yeah, I'm just trying to make it more of a platform for people who need to actually get in there and munge the actual cell information that, you know, I might as well hand it over since I have it.
So before we move on, I just want to settle on something that when your relationship with spreadsheets runs so deep that you said something I've never heard anyone say before. You said, there's a spreadsheet in my life that. And I just wanted to say I love that. I love that. Figure of speech.
Yeah, it's part of our daily life. It gets updated once a day. And I think I have a fondness for spreadsheets also because once I. So I had an undergraduate degree in economics and German and did management consulting. But then I decided that I really liked doing data analysis and it was because of my deep immersion in spreadsheets in the management consulting world. But I didn't have all the math that I needed to apply to statistics grad school. So in the year or two where I was preparing, I supported myself doing high end Excel temp work. So even though it is not my tool of choice now, I do have some nostalgic fondness for it. For sure, it was there for me when I needed a way to earn money.
Yeah, it's an old friend.
It is.
So we've discussed bits and pieces of this in passing, but I'd like to focus on a future in which spreadsheet use is tightly integrated into all of our data science workflows. And I want you to tell me what this future looks like to you. What's involved in this future?
I don't really know if this is the future I want to live in, but if we were to do that, I think it would be great to have something that's like Excel but where you can shut down some of the features that are especially problematic. So for example that you can shut down the use of formulas or you could shut down anything that wasn't conditional formatting. So I, yeah, would love to have some of the featurelessness of some of these CSV editors, but with the really slick user interface that Excel provides, something I've talked about with Aaron Berg who works at RStudio, I believe in either solutions engineering or customer success is also trying to make it easier to template spreadsheets for people where you create the spreadsheet that you would like to get back and you just, you kind of leave those post it notes with like a yellow arrow and it's like sign.
Here, fill this out like a form.
This is all you're allowed to do. Yeah, yeah. And so I've been. A few people have opened issues on Read Excel where they clearly have some workflow that uses the, the Excel templating facilities. And so I started to engage those people in conversation to figure out like, well, what do these workflows look like? If you're going to need to deal with spreadsheets, maybe you should. I guess it's a bit like statistics where people complain that they're brought in to analyze the data after the fact, but they should have been involved in experimental design. So if you know that spreadsheets are going to come to you later. It would be better to be involved in their design in the first place and be able to present templates for people to fill in where you've kind of locked things down.
Yeah, and this actually almost answers my next question is how do we develop a culture in which we ensure that spreadsheet use can be incorporated into a workflow where downstream people are using languages such as R and Python?
I think it is creating these spreadsheets that have predictable structure. Yeah, I think that's the main. That's the main thing. And then, yeah, as you said, making sure that the data you need to get back out is something that can survive that. That translation. I mean, of course, like, we can recover the formatting. It's much easier to recover it and from a Google sheet than from Excel. So I've never made myself do that with an Excel spreadsheet, although it is possible and some of the other packages do, but it's still quite painful. It'd be better to just design that away.
I feel like here we've imagined a bright future. It may not be quite the future you and I want in all our idealism.
Well, it's one that keeps us employed.
Yeah, absolutely. Ain't that the truth. So how do we get there? How do we get to this future for you, as you know, for you and me as a community of tool builders and educators?
Well, I guess I have a sarcastic answer to that. I guess let's have that one first. You know, when agencies like the NSF and the nih, so these are the two main funding agencies in the us so NSF is National Science Foundation, NIH is National Institutes of Health, make these, like, big splashy announcements of how much money they're going to invest in things. All I can think of is that, like, you know, the rounding error on most of those efforts would fund a team of professional software engineers to make a really good CSV editor. And then especially, I mean, for both of those agencies, but especially the nih, Excel has done so much damage to genetic and genomic data because of its obsession with converting things to dates that would have paid for itself. And so I kind of feel like there are a lot of agencies that are funding work that if they could ever be seen to see, like, this is like, a really fundamental tool that we're missing.
I mean, there's a great example of gene names being mangled and turned into dates. Right. Which I'm sure that either of these institutions would not want to happen or be published.
Right. I mean so we should put some of these links in the show notes. But like major genomic databases have non negligible contamination that is characteristic of data being passed through Excel that probably never should have seen Excel. And so that's an example of where like this is. It does seem like something that it would be in the best interest of certain agencies to fund. I don't really think that's going to happen though. But so that was a sarcastic answer.
So what's the non sarcastic or is there a more sarcastic answer or no, what's the realistic answer?
You could say like hey, I now work at a company that puts nice user interfaces on things. Like would I ever internally campaign for RStudio to make some sort of editor of rectangular data? And so far I haven't. First of all, I don't even know if I would be successful. Probably not because it's a really big job. I think that's why someone else should do it. But yeah, I haven't done so. But that's some company that is really good at putting user interfaces on things. Or you know, Microsoft could choose to create a version of Excel where some of these things can be shut off or configurable. But I don't really think any of these things are going to happen which is why I think these other practices are more realistic and an open source.
Solution would be great downstream. That doesn't necessarily seem likely at the moment.
Yeah, I guess that would give you the ability to find that environment variable that turns off date conversion and toggle the value to. No. Yeah, so that's. I suppose. I mean this would be a very complicated application. I don't know how many people would actually tinker with it. But yeah, creating a configurable spreadsheet where some of these types of functionality could be configured or shut down would be great. I don't really think that's very realistic though. Just Excel is too successful doing exactly what it's doing.
So what's a realistic solution or future?
I think it's just the type of things that we're already doing which is making it easier to get data in and out of these things and developing best practices for working with it. I think so. I think Matt's blog post is a good example. Carl Broman and Kara Wu have a recent paper in this collection. Yeah, this collection of articles that Hadley Wickham and I elicited from people that appeared as a peer J pre print collection and then is also now a special issue in the American Statisticians So they wrote a lot of concrete practice stuff that you could give to a collaborator and say, like, hey, next time you make a spreadsheet, think about these things. It's going to make it easier for me. Data Carpentry, which is an offshoot and sibling organization of software, carpentry, also has quite a lot of curriculum around making spreadsheets that you won't hate yourself later when you or someone else needs to import them for analysis in another system. So, I mean, maybe I'm not aiming high enough, but I tend to think some of these parameters we don't have control over. So it's more about harm reduction than eliminating the use of illegal drugs that we should just cope with helping people do this more responsibly and then wean themselves off of it.
Yeah. So I actually think both you and Hadley, in varying contexts have referred to certain aspects of these conversations of it being like sex education and safe injection sites.
Yeah, yeah. I mean, that's probably a bad analogy, but. Because there is a lot of sort of value judgment there. But it is this also this. Yeah. This sense that you can't completely control everything and people decide to do what they're going to do and they're responding to a whole lot of different incentives and just try to pick up where we are and make things more productive.
Yeah. There is a question whether encouraging best practices or having software with a subset of features so people actually can't do the things that aren't best practices is the best approach.
Yeah, yeah. I don't know how frustrating people would find that, but it certainly would be a great mercy to those of us, like, on the receiving end of these spreadsheets.
Exactly. We'll link to all of these things. We'll also link to a repo you have up called Sane Sheets, which really the readme is fantastic.
That was a bit of a rant that I got baited into, but it was kind of fun.
You also have a header on it which says, this is a rant about spreadsheets. So you definitely manage expectations really well there.
Truth and advertising, for sure.
Fantastic. Okay, so we've had this great conversation about spreadsheets. Something I'm interested in when interviewing people on the podcast is getting a sense of what they really, really enjoy doing. And of course, spreadsheets is one of those things, and developing and being an interface between users and developers. But I'm just wondering, generally, what's one of your favorite data science y techniques or methodologies?
I mean, I like thinking about workflow a lot, which is, I think, a discovery I made about myself when I decided to take my teaching very seriously and take teaching stat 545 very seriously. Because a lot of that is not. It's not inventing new theorems, it's not necessarily developing packages, although that was a precipitating event for me, getting more involved in that. But just like recognizing patterns that recur in data analysis and giving them a name and like articulating, this is the input, this is the output, this is the challenge getting from the input to the output. And here is a template for how that can work. I enjoy that very, very much. And it's kind of hard to find your place in the world doing that. I feel like I have found that at RStudio. And then it leads naturally to helping develop packages, either packages that I own or providing sort of constant drip of input on other packages because it shows you what those gaps are in. There are repetitive patterns that reappear in people's data analyses. And it's really hard to make this move from step three to step four. And it comes up a lot. And that also explains why I work a lot on data import. Like our life in the tidyverse, especially for data manipulation is good, there's still a lot of room for improvement. But none of that matters if you can't get your data in in the first place. And this is part of why I was excited, although a little intimidated, to start maintaining Read Excel because I've required students to use, you know, a package for bringing data in from Excel in the past. And some of the R packages that do that understandably rely on some pre existing Java libraries or Perl libraries. But every year when I did this, like 20 to 40% of the students wouldn't be able to get these packages to actually work because of some fiddliness with that interface. And then it's as if the package doesn't exist. If you can't get it installed or it won't import anything for you, it doesn't exist. And so that's why I, I actually enjoy working on data import packages and I'm happy to write glue code so that you can embed some library that knows how to read XLS files and embed it in an R package so that people don't have to figure out how to install it themselves, because if you can't get the data in in the first place, you can't enjoy all this downstream goodness. And it's an area I love working in because I think it's super useful. And then also given how useful it is, there are relatively few people willing to do it because it is like fairly unglamorous work compared to working on, you know, machine learning or sort of fancier statistical methods. But so it also means that like, you're allowed to do stuff that's very important and appreciated and there's not like a ton of cutthroat competition doing it. So there's a lot of things I enjoy about it for sure.
And I think something you spoke to then, this idea of recognizing patterns in workflows is essential and also it helps you to decouple of various patterns. We actually had a segment based around one of your blog posts once on this podcast, your project oriented workflow, which was great because in this short post you actually are able to decouple workflow which you describe as personal tastes and habits from the product, which is the actual project. And that's incredibly helpful for a lot of working data scientists, I think.
Yeah. A more recent blog post, actually, I haven't written the blog post. I've done a webinar on this, but I really got on a little kick about how do you structure workflows when you need to do something for every row in a data frame? Because that's an example of a pattern that comes up fairly frequently in real life and is fairly awkward in R due to our columnar orientation. So that's like a perfect example of like, no one needs to go out and like prove some theorem, but someone needs to like really articulate what are the common features of these problems. A lot of times people think they have this problem and they don't. So like, how do you know when you're missing an easy solution? Like, are you overlooking an existing vectorized function? Are you overlooking a group by summarize operation like, there's a list of ways you can get yourself out of this pickle. And then no, there really are some cases where you actually have to do this and then laying out what your options are and again like outlining the three to five typical complications and how do you work your way around them. But I enjoy doing that a lot. And then it inevitably points to either features you could put into packages or sort of gaps or bugs in existing packages that things that are surprising that they work the way they do. But so all of it still informs package development, but sometimes it's also just making our existing packages like getting more mileage out of them by like showing people how to use it.
Totally. So to wrap up, I'm wondering If you have a final call to action for our listeners out there.
Oh, my gosh. I should have. I should have pre thought about that. I think. I think my final call to action is to encourage people to continue to think and work and learn out loud. I feel like I've been using R for a really long time, but did so very quietly for a long time. And starting to be more public about that and opening up my teaching materials, you know, imperfect though they may be, has overwhelmingly been very positive. And it's a little scary to put imperfect work out there, but for the most part, you get positive engagement with people. And it absolutely has accelerated my own learning. And is. Is why I'm doing. What I am doing today is working up the courage to do things a bit more in the open, bit more collaboratively. So I think that would be my call to action, is that I feel like we live. It's an exciting time with how quickly practices can be transmitted from one person to another. This is a weird note to close on, but I spend a lot of time on Twitter, probably more than I should. And I came across this amazing video of someone whose Twitter handle is Beyonce, and it's of her doing the background dancing of Beyonce's recent performance at Coachella among, like, I don't even know if that's right to say that it's an example of something that I only see in person.
I think that's right.
Okay, good. But it was this great juxtaposition of the pros doing something and this woman doing an incredible rendition of it, like in her living room. And it did remind me of a lot of what I feel like I see going on in R and I'm sure other software communities today where, you know, the famous person like the Hadley Wickham or the Mike Bostock or the Wes McKinney does something. And because they are very much working in the open and working on open source things, other people can immediately access it, see it, and mimic that. And it's kind of amazing how quickly people can level up if they are listening and willing to engage in that conversation. And it does take a little bit of courage, no doubt. So that would be my call to action.
I think that's a great note to end on. I think it's a wonderful analogy. I'd also like to see Mike Bostock, Hadley and Wes do the backup dancing for Beyonce one day.
That's our actual call to action here.
Yeah, exactly. And please send me the link to Beyonce's tweet, because I'll definitely include that in the show notes.
I will for sure. It's a great joy to watch.
Jenny. It's been an absolute pleasure having you on the show.
Thank you very much. It's been an honor.
Thanks for joining Our conversation with Jenny about spreadsheets in data science we saw that we need to be realistic and embrace the use of spreadsheets in data analysis data science pipelines. We also saw strong arguments against the use of spreadsheets, but this in fact led us to imagining a future, an evolving present in which best practices with respect to spreadsheet use are encouraged instead of telling people not to use them. Such practices involve, for example, keeping data separate from logic and not using formatting to encode data. We'll link to a bunch of resources on spreadsheet best practices in the show notes, so make sure to check those out. Also, make sure to check out our next episode, a conversation with Kathryn Jarmul about data security, data privacy and the very recently enforceable gdpr, the General Data Protection Regulation, a regulation in European Union Law on data protection and privacy for all individuals within the European Union and the European Economic Area. What does the GDPR mean for civilians? What does it mean for data scientists? What does it mean for businesses? And is it enough to protect our basic human rights? This is an episode not to be missed. I'm your host Hugo Bown Anderson. You can follow me on Twitter hugobown and datacamp@datacamp. You can find all our episodes and show notes@datacamp.com Community podcast.
Sa.
More from Richie

#359 My Best Friend is AI with Valerie Tiberius, Professor of Philosophy at University of Minnesota







How AI Agents Will Work While You Sleep | Ruslan Salakhutdinov, Professor at Carnegie Mellon

#358 How AI Agents Will Work While You Sleep | Ruslan Salakhutdinov, Professor at Carnegie Mellon

