#33 Pharmaceuticals and Data Science (with Max Kuhn)
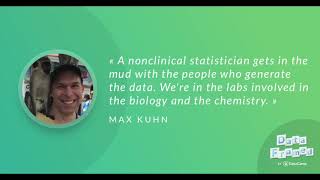
Max Kuhn, formerly at Pfizer and now at RStudio, built the caret package for predictive modeling. At Pfizer he worked on drug discovery and toxicity testing, using Bayesian analysis and Shiny dashboards to show uncertainty to chemists. He explains why he prefers "predictive modeling" to "machine learning" and how tidyverse tools changed reproducible research.
Chapters
In this episode of Data Framed, a datacamp podcast, I'll be speaking with Max Kuhn, a software engineer at RStudio who was previously senior director of non clinical statistics at Pfizer Global Research and Development. Max was applying models in the pharmaceutical and diagnostic industries for over 18 years. What are the biggest challenges in pharmaceuticals that data science can help to solve? How are data science and statistics generally embedded in organizations such as Pfizer? What aspects of the pharmaceutical business run the gamut of non clinical statistics? Stick around to find out, along with insights into Max's work on open source software such as Carrot, which he built for predictive modeling, otherwise known as machine learning. I'm Hugo Baun Anderson, a Data Scientist at DataCamp and this is Dataframe. Welcome to Data Frame, a weekly datacamp podcast exploring what data science looks like on the ground for working data scientists and what problems it can solve. I'm your host, Hugo Bown Anderson. You can follow me on Twitter hugobown and datacamp@datacamp. You can find all our episodes and show notes@datacamp.com community podcast. Hi there Max, and welcome to Data Framed.
Hi, happy to be here.
Great to have you here. Really, really excited to talk about the role of data science in pharmaceuticals, which you've worked on for, for a long time. But before we do that, I'd like to find out a bit about you. What are you known for in the data science community?
Well, I've been a working statistician for 18 years. I think the thing that people know me most from is some R packages for predictive modeling like Carrot and a few others. I wrote a book in about 2013 on predictive modeling and I think people know me from there too.
What's predictive modeling?
Yeah, that's a term I use basically to cover machine learning and pattern recognition and I mostly use that instead of machine learning because the phrase machine learning has been co opted maybe three times in my career. I was first in graduate school that meant old school neural networks and then five or ten years after that. If you said machine learning, people assumed you meant kernel methods like support vector machines. And now we're back to deep neural network. So for me predictive modeling is a little bit better because it doesn't have those connotations and it's like a direct name about. It describes exactly what you're trying to do, I think in a more understandable way.
So it's about making predictions.
Yeah, basically.
Awesome. And of course I started using Carrot, I think six years ago when I was working in Applied math research in biology in Connecticut, in New Haven, of all places.
Yeah, I remember that.
And one of the things that I found really wonderful about is how intuitive the API was. Also, you know, your vignettes and your book provide wonderful educational resources. But the other reason I think, you know, historically why carrot is strong is because it arose out of a real net. You made it because you needed it, right?
Yeah. So, you know, I worked at pharma at Pfizer for a while, and when I first started there, I think it was like 2005. The good and bad of working for a huge corporation is you show up on day one, they give you this nice high powered laptop and you feel like you're ready to go, but then you don't have access to anything. It takes 50 help desk tickets to get access to any data. And so I knew I was going to have two or three weeks at least of no productivity besides going to meetings and stuff. And so I talked to my boss and said, I know I'm going to be doing computational chemistry support and all that. And I've been thinking about writing an R package that'll make that a lot easier. And I've got a couple weeks, I think, before I would get any data. And so I spent almost all my time outside of meetings just writing the skeleton of that. And what did you do? And I've rewritten it like three times. But yeah, that was developed to support computational chemistry inside Pfizer.
How long ago was that?
That was 2005.
And how at that point in time did you know how to write an R package or even what that meant? Or does that question make sense?
It does, but I think if you go back and look at the sources back then maybe you might judge that I'm not the best person to talk about that. Well, I'd written S packages, so I was using S before R was a thing. So I had an idea of the, the basic framework of doing that and back then writing it. Back then. I'm old now. Back in my day, yeah, back then there weren't as many rules and things when you write an R package. Now there's like a thousand. It feels like to me at least there's a thousand things that if you send it to Cran, you might get dinged on or like, what's the best way to do this? And it's, and it's somewhat complex now. And at the time I didn't think that. I never felt that it was. And so, I don't know, I just started throwing Things together, like literally throwing things together. And I know we used it inside of Pfizer for about a year and a half before I really contemplated sending it to cran. And I even had to change the name. It originally had a different name. And then there was a package maybe a couple of weeks before I sent it to CRAN that took the name. So I had to change it all and figure out what to call it and all this stuff.
So yeah, yeah, that's called Carat C A R E T. And what is that? That's an acronym.
It is. My graduate advisor gave me a lot of great pieces of information like nuggets of wisdom. And one was come up with what you want to call it and then backfit the acronym. So it stands for classification and regression training, which is a total hack on that acronym.
Yeah. Were you contemplating doing a reboot or another package called Carrot but spelled like the vegetable? Do I remember that?
So, yeah, this is funny.
The root vegetable theme as well, Right, Exactly.
I made a joke that, yeah, that would be the next package would be called Carrot spelled like the vegetable. So I could just mess with somebody. And then Hadley said, no, we should do something else. So he came up with Parsnip, which is like a white carrot, very similar to a carrot. And I actually have a package called Parsnip right now which does something similar to the original carrot. So it's become a confusing mess for how I've named these things.
That's hilarious. Okay, great. So I hope to make it back to talk a bit more about carrot and open source software package development and crown all these things later. But I want to jump in and find out about your work at Pfizer. But I want to take a slightly different approach. I want to know what your colleagues at Pfizer thought that you did there.
So I was hired as a non clinical statistician and it was the second job I had with that title. And so what that is. It's exactly what it sounds like. So it's everything but clinical trials. So clinical trials tend to be these very dogmatic and formalized process of doing, in a general sense, data collection and analysis. And non clinical is almost the exact opposite of that. So a lot of times when people talk about non clinical, they're usually talking about the early part of the drug development phase. So somebody comes up with an idea of what we should target in the body. All those activities fall under non clinical statistics. So that would be drug discovery, discovering targets for drugs and things like that. And then after that the medicinal chemists start coming up with compounds and chemical matter to try to make that happen. And so that would be like early medicinal chemistry and drug discovery. And then once you have a drug candidate which is the drug you think is the one you want to put in people, then you start working on the formulation part of it, the toxicity testing, how it's going to be made, how we characterize its safety and if its efficacy. And once you think you have all that worked out, then you go to the part where clinical takes over, where you think you start. Considering that we're going to put this in people, how are we going to do that? What dose are we going to do that? So before it goes into people or a person, all the stuff that happens before that is non clinical statistics. So it's usually connoted with the scientific side of the business, the scientific research part.
And you were in the research and development branch of Pfizer, correct?
Oh, yeah. And it was always hard to describe to people because they were like, what drug did you work on? I'm like, yeah, I knew their compound numbers. I can never remember what the. You worked on one that actually became a drug. We had no part in what those weird names were. So I'd be like, yeah, I worked on 785. We just call them by the last three numbers, like their serial numbers. Basically. It was that early. It was before it was even a real drug. Cool.
So I think the three takeaways there for me are drug discovery, medicinal chemistry, and developing drug candidates and then thinking about toxicity and this type of stuff. I'm wondering how data analysis and data science are integrated into this process in pharmaceuticals.
Yeah. So it's interesting. So I've heard and I've even said a lot of people say, well, you know, we were doing data science back then, we just didn't call it that. And I think in a lot of cases that's true. And I'm going to do my best to avoid saying that, but I probably will in like two minutes. But, you know, I've seen a lot of statisticians. So, you know, I'm trained as a statistician. Like my PhD is in biostat. And I've seen a lot of statisticians say, aren't we the data scientists? And my response to that is almost uniformly like, no, statisticians, some of us have been sort of functioning in that role for quite a while. But statisticians, sometimes the stereotypes are true, but the stereotype historically have been people who sort of sit back, somebody brings them data, they ask a lot of questions about how the data was collected and how it was sampled, and then they generate a P value and then go on to the next thing. That's not at all what non clinical statistics was or is. So I kind of view the difference between one of the main differences between a data scientist and a statistician as being almost like a matter of involvement or intent. So a non clinical statistician tends to get in the mud with the people who are generating the data. We're in the labs looking at how they do things. We're involved in, you know, the biology and the chemistry. We don't have to be experts in those things, but knowing what's important to those particular groups of clients. So it was not very passive at all. It was very proactive. And we were always trying to get ahead of the projects. In fact, the best things we ever did were try to solve problems that we knew that they had, but they never articulated. And we would develop a solution to a problem and then bring it to them and say, hey, I know you haven't really asked us about this, but we've noticed that you have a lot of issues with predicting these types of compounds. And so we got some data together and built something for that and let us know if this is any good or not. And so to me, that's like the antithesis of how I sort of grew up with statistics, where it was more like the stereotype is bring us data, we'll judge you, and if we feel like we should bless your data and the analysis will do that. So it was very passive and sort of like come to the mountain sort of like approach to clients. And you just can't do that in non clinical. You have to be involved in the science side. You have to be involved in the nitty gritty of how the data are generated. And I see that as how data scientists tend to work is they tend to be more involved in the actual question of interest and how the data is collected. And we're all writing software to do these things. So sometimes I worry that statisticians just don't do analyses because it's not in their favorite software. And they wouldn't really think to write their own software to do things. So that's what I mean by it's a matter of involvement or intent. I just feel like if you're going to get in the mud with the process that you're working on, you tend to be more of what somebody would call a data scientist, or in my case, A non clinical statistician.
I like this because this idea of involvement, I think speaks to two very interesting aspects of data science. The first is this idea of domain expertise. How much you need to know about your subject matter and whether you're not quite the expert there and your collaborator is, but you do know enough to do your job is really important. The other thing it speaks to that I want to kind of pick your brain about is being involved in experimental design. And I know in your work at Pfizer there were two types of things you did well, several types of things, but two in particular, which is working on historical data which you had no input into the experimental design, but then working on data which you'd been involved in from even setting up the experiments. Is that right?
Yeah. Well, the experimental design part was mostly I worked at Molecular Diagnostic company before Pfizer and we were pretty hardcore about experimental design. So we had a lot of high throughput systems. We were optimizing assays. And an assay is just a fancy word for saying like a laboratory test. And, and these assays would have 15 or 20 critical components. We had to get the concentrations right. So at that company, we design an experiment in the morning between 10 and 2, they'd execute it. The data systems were pretty good. So we'd get the data back in a consumable form very quickly. We'd do the response surface design or the factorial design analysis really quickly. We discuss it at like 4 and then plan the validation experiment or the confirmation experiment. So within three days we would have done, I don't know, two or three experimental design iterations of optimizing these things. So it was very, I've sort of gravitated to problems where I don't think it's through my impatience, but where you get very quick feedback. You design, you think you have a concentration or a combination of concentrations of these components to the assay that you think works, and then they test it two hours later. And you know, whether you failed miserably or you did really well. And so that's a really nice aspect of doing that. And the chemistry work I did was the same way that you propose that they make this compound based on your model prediction and it takes them like two, three days to synthesize it and data test it. And you know pretty quickly whether you did a good job or not. And that's very different than I generated a P value. And I think these two things are different. But we won't know for like another year whether that is a real thing or not. So I've always liked the idea of getting, like, a feedback loop, an empirical feedback loop that says, yeah, yeah, this really worked, or this didn't. So that was the experimental design part.
Yeah.
The other bit that you mentioned before I left Pfizer, we supported a lot of the assay scientists there. So, you know, a chemist designs a compound that gets synthesized so we physically have it, and then it gets run through, like, a battery of, like, anywhere from like three or four to a dozen different assays that measure, does it work? What's its permeability? Will it get into a cell? What's its lipophilicity? How greasy is it? Or the chemists often would build models to make predictions of these things. We had just boatloads of historical data on compounds going back forever because these assays don't really change. And maybe around, I don't know, maybe around 2010, I think maybe it was a little bit before that. We wanted to get in that data set so we could query the summaries of the data, but we didn't have the original replicates and things like that. The assay scientists were a little bit wary of that. We had good relationships with them, but they weren't quite ready to. I think they were afraid of what would these guys show with these data. We kind of left that alone for a while, but then about four or five years later, they came to us and said, we'll give you the keys of the kingdom. Look at all this and help us. Because they'll have a chemist run a compound twice in an assay. And if the chemist didn't feel that the data were tight enough, they'd kind of raise a ruckus and say, like, oh, this assay isn't any good. And then the management of the assay groups would have to come back and say, well, no, this is actually pretty good. And your results aren't really that any more consistent or inconsistent than any other compound. And here's some data. And so then, rather than fighting fires, we got to a point where we did a lot of analysis of their historical data using Bayesian analysis. The idea would be that given I have a measured value of 10, let's say 10.5 from this assay, what's the probability that the true value is within certain boundaries, or what's the credible interval and things like that. So you just have tons of historical data, which really opened up a lot of new and interesting things we could do with Bayesian analysis to. To make. And this is when I Started really using Shiny a lot. So we had this like web portal that had, I don't know, like it's probably up to two dozen now, but at the time was maybe like 15 different shiny applications.
Can you just tell us what Shiny is?
So I work for RStudio and one of the things that we have is Shiny, which is like a web, like a web server for R. So what's great about Shiny is with a little bit of code you can come up with a really nice looking website that has controls on it. And behind those controls is R code. And, and so if you change the dial a little bit, it can automatically recalculate things behind the scene and then give you a nice sort of interactive visualization to show, let's say, a histogram or a box plot or the data themselves. And so what we did is we pre populated all these data sets with all the Bayesian analysis results that anybody might ever ask for. And then we would use Shiny to basically visualize these. So a chemist would come in and say, oh, well, I ran this assay and I got an assay value of 10.5. So they turn the slider to 10.5 and it would give them, we wouldn't call it this, but it would give them the posterior distribution that describes what the plausible range and distribution of values it could be. So based on that, they could say, oh well, based on these thousands of historical data points, I know that this is sort of my measure of uncertainty for this particular compound that I measured. And that really helped everybody understand what the baseline conditions of all these assays were. They could tell what was an aberrant value and what wasn't. And it also sort of opened the door up. So I did a presentation about this and I think the link will be in the show notes. And the name of it was statistical mediation and early discovery. Because we found ourselves being the mediators that the consumers of the assays, which were the chemists or the biologists, would want it to be the highest quality data that they could get, which is a good idea. But then the producers of the results, the assay scientists, they've got budgets and they're getting thousands of compounds of assay every week. And so we tended to be the people in the middle to mediate between like, yeah, this one was kind of like a wild data point or no, this result that you got was really consistent based on all our historical data. And we just basically automated all the analysis and visualization of that stuff so that it could take. It was just Like a known thing that everybody can consult with the, what the real values were. So it was a really interesting project statistically and it just seemed to solve a ton of problems. So that was one of my favorites.
That's cool. And I think what you're really speaking to as well is kind of the role of data science thinking and data scientific approaches to all of these problems. And I'm wondering if you could speak more generally just about what the biggest challenges that you've seen in pharma that data science can help to solve in.
Pharma, especially at the part of pharma that I was in, the complexity of the data is just astounding. So chemistry data can be complicated. You have these molecular structures that we have, all the software that can parse them and measure them in different ways, like the size of a molecule or its surface area. And that generates a lot of data. And those data have a lot of interrelationships between these variables that you have to be aware of and deal with. And so chemistry has a lot of opportunities, have a lot of data, and the complexity is pretty high. But in a way, it's kind of like nothing compared to the complexity of biological data. So biology is just, it always astounds me of like, once I learned a lot about molecular biology, like what a game of mousetrap it is, right? So you modify this gene here, that triggers a compensatory reaction, this pathway over there, that then sends a signal to this other pathway. And so just the biological complexity is astounding. And then back in the early 2000s, with a lot of microarray technology, we were able to conduct very large scale biology experiments. So with a single sample, you can get 54,000 RNA measurements pretty easily. In those, we have multiple measurements per gene. We know the sequences, we know all this stuff. So just the complexity of these data were just. It was very daunting in a lot of ways. And we had a lot of good tools in bioconductor and in R to help us with that. And if anything, it's only getting worse from the standpoint of complexity. So we're able to measure even more than we ever did before. And we're asking more sophisticated questions. So the experimental design might be more complex. And so things aren't, I mean, basically things aren't getting more simplistic, they're just getting more complicated. And they're already pretty complicated to begin with. So having tools to visualize this stuff and make good methodology counts because I've seen a lot of really, really Bad methodology. So having people that sort of can give a defined sort of baseline analysis that you can trust, basically because it considers all the aspects of the data analysis that might be lost on sort of an neophyte or somebody who hasn't really thought about this too much.
Yeah, that's really important because when you were talking about these types of communication necessities at the end of a data scientific and experimental pipeline, who do you need to tell this stuff to? Are they technical or in any sense?
Yeah. So we were lucky enough so they moved a lot of biology from Connecticut, where I was at, to Boston. But when it was here, we had a pretty good not committee really, but we had always had a statistician, a biologist and a chemist who had dealt with a lot of these problems before would be the initial people that would consult. So you would have a scientist come in and say, hey, I want to run this big biology experiment and use these microwave technologies. And then we'd sit down with them and say, okay, what's your experimental question? And then they'd tell us, and then they'd tell us what they thought the design should be. And we'd say things like, hey, most of your design doesn't have anything to do with that question. They say, well, yeah, there's this other stuff I want to do. We're like, okay, well hang on. You want to compare 15 things in this experiment and you're going to get maybe 40,000 answers per question. Are you ready to get like a 40 megabyte Excel file of just P values and fold changes and gene names? And so a lot of times we were communicating to people who maybe at first didn't really understand the technology or at least what they were getting from the technology, because it can be. We saw a lot of experiments where they had good designs, but they were very. They just bit off more than they can chew. And then it's so overwhelming that the results never really got, were taken advantage of. Because you run this experiment, you answer this one question, but there's 15 other questions that you answered. But not even the postdocs have time to work on that stuff. So we were very much about, let's do very focused experiments that answer one experimental question at a time. It was more the intuition or the practical aspects of the experiments rather than how they isolate the RNA or what P value correction or whatever they want to do. Those things are all important. But the design, you can't resurrect a dead experiment because the design was bad. So that was where we spent a Lot of our time and we were mostly communicating this to the bench scientists and lab heads, which they were all I had just top notch scientists to work with when I was in drug discovery. So if they didn't understand it at first, they were usually pretty respectful saying, okay, explain that to me again. Or they just didn't get it. Say, you know, I just have to rely on your judgment. If you think this is a bad idea, then let's not do that. What do you think we should do? So that was always, for the most part, always a pleasure to work with them.
Okay, great. And I'm sure that emerging technologies at that point, such as the ability to build shiny dashboards, was very helpful in these types of conversations.
Yeah, sort of the joke I made is, you know, we don't need another P value correction, right? We, yeah, you know, we'll get more, you know, we really early on we developed the idea that, or came up with the idea that we'd rather give them an interactive volcano plot, which is a plot of the signal versus the statistical significance of something. With these types of plots you can very quickly see what the main drivers of the analysis are. And then we had systems where they could click on it and have the genome pop up and so you would have a cluster of points on this volcano plot that would sort of stand out. And then we could really quickly see are those measurements from the same gene or the same gene family? What were they? And that was just so much better than giving them detailed statistical analyses or reports or again, this massive Excel file with all these numbers in it just to let them just visualize these things and capture what they're interested in and then give them other visualizations where they could, you know, isolate those particular parts of the experiment and say, okay, what was that? Was this an aberration? Or did we just discover some new aspect of biology we weren't aware of? By far, that was like the most, the most productive part of our work there.
We'll jump right back into our interview with Max after a short segment. I'm back here with Susan Sunt to discuss the ins and outs of freelance data science. Susan is a freelancer who has worked with the New York Times, Cooney, Google and General Assembly. Susan, today we're here to talk about practicalities. My first question is about software and productivity tools. In terms of the practical day to day runnings of your business, do you use standard free tools or do you purchase proprietary productivity tools and software?
Well, I'm a one person company and I like to be conservative with my operating cost, so I like to use free tools whenever I can. But I still do wind up with a lot of tools, both free and proprietary. To name a few of the major ones I use, I use namecheap for the domain name registration, Google Drive for the cloud storage, QuickBooks for accounting and invoicing, Harvest for time tracking, Capital One for business banking and Moo spelled Moo for business cards, and finally obviously LinkedIn for my professional profile and GitHub for the code storage.
Great. So another important practicality in any project based work is timing and scoping. How do you think about these in your practice? As a freelance data scientist, scoping is.
Pretty important, but also one of the hardest things to do. For smaller projects, the client usually wants you to quote a price upfront after giving you a few details about the project. And the first few times for scoping are usually the hardest because you don't know your own pace very well. This is why I keep very careful tracking of all my projects using Harvest, Google Sheets or any other invoicing device. And afterwards I try to break down the tracking to the most granular daily task level. And every iteration that I do this I get better and better at scoping out just how long it takes to do different types of data work.
Interesting. What about operating costs then? I mean do you rent your own space to work, co working or otherwise, or do you generally go on site?
I looked into renting a co working space when I first started but I was trying to keep my operating costs low so I decided not to. Plus in my opinion data work is done better on site anyways. However, this changes when I'm traveling. When I'm traveling I really shop around for co working spaces. WeWork is very convenient because it has a global presence and a lot of the metropolitan cities Hong Kong, Tokyo, London they have a huge variety of competing co working brands to choose from and you can rent both long term and short term from them. I think there's even an Airbnb for co working now. It's called Croissant. Like the pastry.
So we've talked about building up your practice, but how about taking it down? Do you think at all about an exit strategy? Is it important to do this?
I think it's always a good idea to have an open mind about exit strategies. Even if everything's going perfectly and you're perfectly happy with freelancing, it helps to engage in conversation with people who want to talk to you about full time jobs. It gives you a good sense of just where the market is at right now and there are also other exit strategies besides full time. You might want to build your one person LLC into a real startup with more people. There are a lot of things you should consider before scaling up though. You have to estimate the operating costs, the overheads, figure out how to hire is a completely new challenge and you definitely need to rework your business charter. I think it's a good idea every couple of months to have a self introspection and figure out if you're really happy where you are during freelancing. Are you getting everything you want out of it? Where can you improve on it and thinking a lot about what makes you happy. It keeps you from burning out in freelance.
That's great.
These are the types of practical considerations that people think about a lot but do not talk about often enough in public. Fora I'm sure many of our listeners will find all of this valuable.
I'm glad you feel that way, Hugo. I hope all the segments have been valuable so far and can serve as a guidance for any future freelancers.
Time to get straight back into our chat with Max Kuhn. So you mentioned that how complicated the data is in chemistry and how complex and large the data can be in biology also are two of the big challenges that data science can help within pharma. Can you speak to a project or two that you worked on Advisor, that speak to these challenges?
Yeah, so the one I mentioned earlier where we had all the historical data, that was a pretty interesting problem and I think if you look at the PDF in the show notes, I think it does a pretty good job of describing it. Yeah. Other things were A lot of times people come to us. I think statisticians, especially PhD statisticians have gotten this. I don't think we've done this on purpose, but people perceive us as these wizards. So we live in some dark cave that nobody goes into and people want their analysis blessed. And so they come up to the cave and they're like, oh would you please look at this, don't anger the wizard. And then we come out and look at it and be like, yeah, yeah, this is fine. So there were a lot of situations like that where people would have new methodologies that they have read about or started to develop themselves and wanted to know like, okay, am I completely off base? So there's this area of chemistry, of computational chemistry called chem informatics and this is where I will say they are the original data scientists. So I just did it.
Awesome.
Yeah, I know, right? I'll regret that later, they are, for the most part, people with chemistry and computer science backgrounds. And their job is to interrogate very large databases of compounds and assay results and come up with solutions or tools and things like that to help sort of accelerate the drug discovery process or the medicinal chemistry process. And so there were so many things that came out of that that we looked at. One aspect is this thing called match molecular pairs. The idea is you can break down most compounds into certain groups. They usually call them R groups like the letter R, but that's old terminology. It has nothing to do with the programming language. And so what people figured out is when you have a million compounds, you can find common structures in these compound structures like substructures of them. And if you hold those constant, you can see all the other things that changed. And so it's kind of like taking the tail of the dog and grabbing it and let the dog waggle around a little bit. And so in doing that, what they could do is they could just from looking at these databases, they could find interesting either accidental or deliberate transformations that chemists did based on that substructure and find which one of those increased whatever they were looking at. So if they want to make a compound more permeable, they would look at, oh, well, across the 2 million compounds that we saw when we saw this substructure. If people combine that with this other substructure, it really increased the permeability. And so it was this really interesting mathematical way to go back and see what observing things that were probably unrelated experiments and seeing how they affected this thing that you might be interested in. And so they would take the output of that, which looked kind of like a heat map. And so they would come to us and say, well, what do we do with these? We have all these maps to look at of these compound structures. How do we organize it? Do they help us with this aspect? And so it allows us to come in and use what we know and look at it, let's say, from an experimental design standpoint and say, well, okay, here's how you can tell a good transformation from a bad transformation. Here's what you can do. These matrices that you get back in the analysis. So just things like that I just found like, infinitely interesting. And the cool thing about the job was that was like once a month or something like that, that somebody would bring you something and it just blew your mind. And it was very, very hard to say no to these things. So one aspect that's not so great about non clinical statistics Is, at least in drug discovery, is you tend to have about a 200 to 1 scientist to statistician ratio. So you're really, really, really outnumbered. And they're not bringing you problems that are T tests or like an anova, they're bringing you problems that are really, really difficult. And so that can be a little bit every once in a while you just want a T test to work on because you're having to work on these really complex and interesting novel problems, but things that might take you six or eight months to figure out. Sometimes you feel like, am I getting anywhere with this? It's a double edged sword because these things are so interesting and cool to work on, but they're really, really hard. So if you've got four of those in your project list that could just like, that could kill you just because it's so daunting, for sure.
And I do think they are very interesting. But as you said, the fact that a lot of people approach statisticians and data science scientists as wizards of sorts or oracles of truth extraction in a lot of respects is dangerous. And I can't remember who said this, it was probably Nate Silver or someone along those lines. But the quote which I'm going to mangle horribly is along the lines of if a data scientist gets a prediction right, they get more credit than they deserve and if they get the prediction wrong, they get more blame than they deserve currently.
Yeah, yeah, I would definitely sympathize with that. I believe that's true. So, you know, my solution to that is just make millions of predictions. It's safety in numbers.
Yeah, absolutely. And I think an emerging trend and paradigm is also, as you discussed, you're very interested in Bayesian thinking and Bayesian inference is with our predictions expressing uncertainty as well.
Yeah, absolutely. So I began to really use a ton of Bayesian methods for that exact reason. Just because there are a lot of times it's really difficult to put estimates of uncertainty on parameters or combinations of parameters using sort of like old school mixed models and things like that. So we had tons and tons of repeated measures data of different levels of hierarchy. But if you wanted to get the uncertainty of the ratio of two parameters, there's some tricks like Fowler's theorem and things like that you can do. But all that just comes out in the wash in Bayesian analysis. It makes everything so easy to do. Once you've got a model that you like, the things you can do with that model I feel like are far and away more interesting than what you could do with their non Bayesian analogs.
Yeah, and I love the idea that you spoke about earlier of coupling Bayesian thinking with shiny dashboards to make kind of the posterior distribution, or, you know, for people who don't know what the posterior is, it's really the probability distribution of the parameter of interest after you've incorporated your model and data and your prior knowledge and all of that. But using a shiny dashboard to communicate this, I think is a really beautiful coupling of two great technologies.
Yeah, we spent a lot of time trying to eradicate as much jargon as we could from those pages. We never said posterior. I don't even think we even said Bayesian. We would basically, in as much straight English as we could muster, try to describe what these things were computing. And to the credit of the scientists, they really began to figure that out. There were some situations where it gave results that we thought that they were going to think were wrong. So there are some assays, like our activity assays that have extremely bimodal distributions. We have this really big normal distribution that's pretty wide. Let's say it's like plus or minus 30. The tails of that distribution are centered around zero. They could be as low as minus 30 and as high as plus 30. And then the hits, the active compounds, tended to have a much smaller normal distribution that maybe are, let's say like 75 to 100. So you have this, the prior distribution that you come up with with your Bayesian analysis based on a lot of compounds, which is extremely bimodal. And so then you give them a result. And let's say the data that they hand you has an activity of like 40. So it's probably above the part of the prior that is for the non hits. So the distribution that the shiny apps would give them would be a really, really bimodal distribution. And it makes sense why that is, because it's sort of in the middle of these two different distributions. And there wasn't, until they collect enough replicates, the posterior distribution doesn't get very tight. And we thought that they were going to completely be like, I think you computed this wrong. But they kind of, before we even brought it up, said, oh yeah, it totally makes sense that there's a slightly higher probability that it's dead and then a 40% probability that it's an active compound. And I can see why that it was. So I was really impressed by people with little to no statistical background just consuming these things and sort of accepting them and rationalizing what they were doing without us having to get into some discussion about priors and posteriors and things like that. Great.
So you now no longer work in pharma. You work, as you said earlier, at RStudio, but you work as a software engineer. But of course, what you do is impacted a lot by all the work you've been doing in pharma for decades. So I'm wondering how you see the work you do now. Computational. New evolving computational paradigms such as the tidyverse, impacting the data community in pharma.
Yeah, I mean, everything we do in our studio and especially in the Tidyverse group, is really just enabling people to do more or do things more easily. If you think about dplyr and things like that, dplyr and the tidyverse take things that, especially in R, were feasible to do, but just sort of like Kludgy, that's a Baltimore word meaning really awkward.
Okay.
And so it just makes those things very easy to accomplish. And so that happens all the time, everywhere. I would say the things that, before I joined RStudio that I thought were the best tools that satisfied that, let's just make it really easy, sort of goal number one was R Markdown. So I never was really totally prescriptive about saying, if you're going to work in my group, you have to use R. But one of the most important things we did was really try to enable reproducible research that we made sure that when somebody had a project, we knew what data was used, we knew what the analysis code was. We could tie that directly to a report because we might not work on that project for five years. And then somebody comes to us and says, yeah, what did you do for this? And if we didn't have something like R Markdown or S Weave and Knitter and all those tools that we've had and I think have gotten taken for granted at this point, we wouldn't be able to effectively have any record of what we did and how we did it. And it really wouldn't help anybody down the road. Or even I'd work on something and six months later somebody would say, well, what did you do here? And I've done like 15 projects since then. So R Markdown and that enabling reproducible research was just a godsend. And I mentioned shiny. I can't sort of overemphasize how much that has made a difference. And for me, it's been interesting because at Pfizer, at least some of the biggest proponents of using shiny were the clinical pharmacologists. So these are people that are measuring Drug concentrations in patients in clinical trials. I think behind non clinical statistics were the people who were the most into shiny and how can we utilize this? And they were in a very, very, very regulated part of that pipeline. And to see them sort of embracing computational and visualization aspects of what they do, I thought it was really unusual in a good way. So those are the things I think that as far as like RStudio stuff that has made a huge difference for me. Carrot was originally designed to make predictive modeling easier in R. I think it does that pretty well. It makes a lot of decisions for you and it's pretty high level code. But my job right now is basically to take from a broader standpoint of modeling, just make it easier to work with models in R. So if you're fitting a survival analysis model or a time series model or a standard regression model, there's this package called BROOM that David Rob Robinson wrote. And that's a great way to talk that exemplifies what I'm getting at is we've all had code that would take the summary object of a linear model that gave you output back that you wanted, but not in a format that you would ever want it to be in. Then we all had code that would take that and maybe make into a data frame and format it and make the, even the title or the column names of these things, depending on what type of model you fit, would be named differently. And so a lot of us have had code laying around to just make this all work. And basically what the tinyverse does, and especially what I'm trying to do with modeling in the tidyverse, is to extend that more and say, let's just take these things that have been sort of frustrating to work with in the past and make them just smooth and enable people to do these things without banging their head against.
Yeah. So something I find really interesting in this conversation is a trade off that occurs in your career and several colleagues of yours as well. And I'll be specific about this in that you started developing software to meet needs that you and your colleagues had, and eventually you ended up at a place like RStudio where you're developing this software constantly, but you don't necessarily have direct contact with people on the ground who have all the needs that you're trying to serve. So I suppose my question is how do you now you're at RStudio and not at Pfizer. How do you stay grounded in the needs of people using the software you're developing?
Well, part of me thinks it's not that difficult to do because when anybody has a question, they ask you. I mean, people. One great thing about the community is there's, unlike when I was in graduate school or in my first job, I would have never thought to email Jerry Friedman and say, yeah, about Mars. How does this work? And the thing about especially the art community and statistics is there's this is. It's not a perception, but there is, generally speaking, a much lower barrier to contacting people that you think can answer your question. So, you know, like maybe twice a week I'll just get a blanket question about like, hey, have you ever had data like this and what did you do with it? And so that helps me a lot because it helps me understand like sort of weak points in things that I think we could do better. It helps me understand what people are working on. If it's something that, especially if it's something I didn't really have a lot of exposure to, that gives me some motivation to learn more about it and to figure out. If you email me, I could be a consultant and answer everybody's question. But a lot of times if there's a particular question that strikes me, I'll spend two or three hours figuring it out and then sometimes give people a really detailed explanation back. So I think there's still a lot of opportunity to learn and sort of keep your ear to the ground and figure out what's going on. I do have to admit though that probably the biggest adjustment for me working at RStudio is I don't get data right. I'm used to getting like a ton, maybe more than I wanted sometimes, but a ton of new data that sometimes is really simple and sometimes really complex. And so I'm constantly on the lookout for new data, especially for teaching and putting in R packages to demonstrate things. And so that is one thing it's taken me quite a bit to get used to is, you know, there are areas that I'd love to do more with, but I just don't have any. I don't have any data to, to work on that sometimes. So that, that's, that's more of a problem than anything else that I have.
And I do think your point to people reaching out now and that being a paradigm of communication, I mean, Stack Overflow has proved a really important place. And you've always been, I mean, I see questions about carrot on, on Stack Overflow and you're very commonly one of the first people to, to. To respond there a place you haven't been until very recently though, which the rstats community has been very active in in general. And a great, I suppose, place for communication is Twitter.
Yeah, it's been good. I've, I've enjoyed being on there. You know, let's, how should I say this? In the last year or two, you know, Twitter has not been known for constructive discourse between people like, you know, you know, talking to people. It's not been very constructive. And the RSAs community is the complete opposite of that. So I expected some trolling and some things like that, and I've seen almost none of that. They just embrace positivity.
I'm sorry, you haven't been trolled enough. So I'll make sure to remedy that sooner rather than later. We've been talking about budding data scientists. I'm wondering what advice you'd give to a budding data scientist who wants to get started in the pharmaceutical industry.
So I think the first thing I'd say is go into non clinical statistics. I know I keep talking about it. And the reason is there's a couple reasons actually. That's where the fun is. Everybody I know who works in clinical, not everybody, but the majority of them, nobody would describe it as fascinating. I don't think that anybody would ever in a million years describe the statistics that goes on for clinical studies as being as infinitely fascinating as I hear myself and other people describe non clinical. So if you're interested in something that's really going to knock, knock your socks off every day, then that's the place to go. But I think more broadly the thing I would say is that it's easy to underestimate how much stuff is out there for learning. And so a good example. And again, this is like what year would this be? This would be like maybe 2000. I started having to work on micro experiments and these high dimensional biology experiments and I had never, I kind of knew a little bit about that stuff, but I'd never really had to really do an analysis. And I had a very high profile, this is pre Pfizer for me. Very, very high profile set of data that were coming my way. And so I just started, for example, just running Google with the site filter for Edu and looking for courses that taught how to do this analysis. And then you could just, the software, you can just really easily download that whole website. And so very, very quickly I was able to get very conversant, very functional in doing a data analysis where I'd never been exposed to the actual data. They had example data there, but the real data that I was going to get was months down the road. And again, the infrastructure and overhead for analyzing that data is not insignificant. If I had just waited till I got that data and then figured out what should I do and what software should I do and I should look around, that would have been a disaster between courses that you see things like data camp, just even YouTube videos and Twitter especially and blogs. If you're looking to learn about something, there are no end of resources out there. And the benefit of data science and statistics is that if you want to be a medicinal chemist, you need a lab, right? So if you want to learn how to synthesize compounds, you need some, some big machinery to actually do that. And we're not in that situation. So we can very, very easily download and get access to tons of real information that basically emulate what it would have been like to get that data in the first place and do the analysis. And so it might be seemingly obvious, but a lot of times I'll look for resources on how to do something and I might find one. And maybe they're talking to me in a way, like maybe they're. Sometimes I'll read things and they're talking to people like they already have a PhD in that subject. And that's no good for me because I can't do anything with that. Originally I would be like, oh, that seems like all I can find. And it's not just throw that away and go find something else. There's no reason to not be able to learn about whatever topic that you want to learn about in data science or statistics. I mean, sometimes there's high level theoretical statistical stuff, but arguably, I don't know why anybody doing data analysis might be seriously interested in that. I mean, not that it doesn't have utility, but if you're trying to get things done, measure theory is maybe not the answer. So yeah, so I would just say look around as much as you can, especially on Twitter, like our bloggers and things like that. And you will most likely find at different levels of sophistication complexity, you'll probably find plenty of resources for what you're trying to do for sure.
And it takes time and patience. And also when I run workshops, I always pretty much at the very start, but tell everyone that search engines will be their best friends in these types of endeavors if they can't figure anything out, figure something out.
Yeah, and it sounds stupid, but that when I doing my Google search and putting site Edu, that was a huge help because it gets rid of most of the hits you would get based on people trying to sell you things, right. So if you want to learn about microarrays and you might get the first 50 hits being companies that sell instruments that can do microarrays. And so that was like. That enabled me to get very, very far pretty quickly.
To wrap up, I'd love to know what you love doing. What's one of your favorite data sciencey techniques or methodologies?
It may be a little higher level than I should quote, but I'm just becoming a bigger and bigger fan of Bayes for certain things. So it's not like people are going to get mad at me and start sending me hate mail for saying this, but I don't know that it's there for every problem. So Lee Bryman, the guy who invented random forest and was one of the inventors of cart, wrote this really kind of inflammatory paper called there's no Bayesians in Foxholes, which is a riff of there's no atheists in Foxholes. And what he was trying to get at is his thoughts, at least maybe in the 80s when he wrote this was the complexity of what we need in machine learning in terms of predictive power. You'll never be able to do that using Bayesian methods. And I don't know that that's true. I think he was being a little bit instigating a little bit there. But for the types of questions that I'm usually trying to answer that are not straight up prediction problems, then I'm finding more and more that Bayesian analysis is the best way to go. There's so many advantages. And as a statistician of my vintage, I was in graduate school when Bayes was looked down upon. It was just starting to become something people were getting more and more interested in, into reviving it. But I always found it funny that when people would talk about some non Bayesian model, they would set it up and motivate it from something that sounded suspiciously like a Bayesian model, except they just didn't want to say that word, it was a bad word. And so I find that this perceived hold of that people have with Bayesian analysis about its complexity. And what about this prior or that prior? I mean, it's. You're doing the same thing in a lot of non Bayesian models. It's just you don't have the mechanism to actually evaluate that assumption. And so I find it to be a very rational and very advantageous way of doing data analysis, especially if you have to do anything around inference or any Measure of uncertainty. So as a good example, maybe before I left Pfizer, there was this one safety group that was trying to predict particular type of toxicity that's extremely rare but extremely hard to predict. So they would get compounds and they would have to give a prediction back by saying, yes, this is toxic, or no, that's not toxic, or here, or somewhere in between. And this group got a bunch of modeling people together and they gave us a long talk about, we've read about self driving cars and neural networks. We want to really solve this problem. We think we need some really high powered stuff to do it because we've never been able to crack this nut. And I like to hear that. Right. So I'm like, all right, what are we going to do? And then when you talk to them, they had like 15 data points. And so at that point when they wanted measures of uncertainty, they want to get a prediction back with some measure, without a measure of what the noise was. And that's a Bayesian analysis problem. So not because it's necessarily simplistic, but with that amount of data, you're probably going to have to rely on a priority or do something that involves more than just the data you have at hand and factor that into the uncertainty estimates. And so it just seems like such a good solution in a lot of problems that I don't know, at the time when I was learning statistics, I feel in hindsight it was a little bit of a disservice that people weren't more excited or proposing more Bayesian solutions at the time.
Yeah, anyway, I think it is historical. It's also these things are generational as well. We have the computational generational power to be doing a lot of Bayesian inference now, but it is generational. I mean, my background's in academia and it's definitely generational in institutions like that. There are so many interesting things in what you just said. One of the most important is that the technique needs to be specified by the question and the data as well. So Bayesian works for a lot of stuff, but there's some things that it's not so good at thinking about. The other thing you mentioned, which is about it being called Bayesian, I've always joked, kind of half joked, that part of the reason you referred to it as some people think of it as a bad word and part of the reason it hasn't been so adopted historically is because calling it Bayesian inference makes it sound like something niche and out of the ordinary, as opposed to it being a way of doing Statistics and inference.
Yeah, I agree. It's funny. Sometimes you can turn this to your advantage. It does have this like, I don't know, this not intimidating, but this exotic quality to it. Oh, it's Bayesian. Right. So I just found that funny. So one thing is, when I was at Pfizer, we used Apple laptops a lot, mostly because we needed Unix on our laptops. But we would have to go through this process of justifying to the IT people why you couldn't do it on a ThinkPad. And so we would just use the word Bayesian and neural network or support vector machine. And people are like, oh, they're doing neural networks or they're Bayesians. They didn't know what that was. But even a guy in it, you would say, well, I'm doing Bayesian analysis. And they'd be like, oh my goodness, there's something inherent or instinctual about that word that makes people like, oh, it's complicated. I just found that to be really funny that you could throw. There are certain words you could throw at people and they're just naturally intimidating. And that, that for some reason is one of them. Yeah.
Max, this has been so much fun and it's been such a pleasure having you on the show.
Oh, it's been great, Great talking again.
Thanks for joining our conversation with Max about data science and non clinical statistics at Pfizer and more generally in the pharmaceutical industry. We saw that much of the work Max did went into drug discovery and how essential it was to be able to deal with large amounts of data from disparate sources for high throughput pipelines and platforms for high dimensional biology Experimen. We also saw how new developments in computational paradigms and APIs, such as the emergence of the tidyverse in R have allowed massive gains in efficiency for all this type of work. In Max's words, shiny is worth a million new P value correction methods. Make sure to check out our next episode. A Conversation with Amber Thomas focused on data journalism, visualization and storytelling. Amber is a journalist engineer at the Pudding, which is a collection of data driven visual essays. We'll go through the process of what it takes to tell interactive journalistic stories using data visualization. And along the way we'll find out what it takes to be successful at data journalism, the trade off between being a generalist and specialist, and much more. We'll navigate these waters, anchoring ourselves in several case studies, including a piece that Amber worked on late last year called How Far is Too An Analysis of Driving Times to Abortion clinics in the US this couldn't be more timely, particularly with President Trump's nomination of Brett Kavanaugh to the Supreme Court, which could have lasting impact on the fate of Roe vs. Wade and the future of abortion legislation in the United States. I'm your host, Hugo Bown Anderson. You can follow me on TwitterBown and Data Camp. Datacamp. You can find all our episodes and show notes@datacamp.com community podcast. Now it's time for a segment called Data Framed Bloopers with Hugo and Max. Max, this has been so much fun, and it's been such a pleasure having you on the show.
Oh, it's been great. Great talking to you again.
And scene. That was great, Max.
I'd realized I. I almost went back and corrected it. I realized. I said, you know, there's not much good intercourse on Twitter. I'm like, discourse.
I noticed that, and I think that's. That's brilliant. We can record. Re. Record that now if. If you'd like, because I can always edit that in.
Sure. I'm not even sure what the question was. Oh, is it on Twitter?
Yeah, if you just say the word discourse. I mean, you said just say the word discourse, but I actually would love to keep it as intercourse. But I understand if you.
I got to do with a straight face discourse.
More from Richie

#359 My Best Friend is AI with Valerie Tiberius, Professor of Philosophy at University of Minnesota







How AI Agents Will Work While You Sleep | Ruslan Salakhutdinov, Professor at Carnegie Mellon

#358 How AI Agents Will Work While You Sleep | Ruslan Salakhutdinov, Professor at Carnegie Mellon

