#41 Uncertainty in Data Science (with Allen Downey)
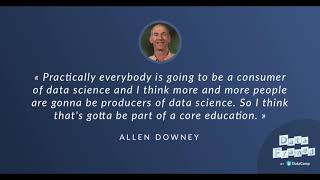
Allen Downey explains why people misunderstand probability, using the 2016 election as an example: models gave Trump a 25-30% chance, but many thought that meant he couldn't win. He argues for showing full distributions with histograms and ECDFs instead of single numbers, and for teaching data science as a thinking tool.
Chapters
In this episode of Data Framed, a Data Camp podcast, I'll be speaking with Alan Downey about uncertainty in data science. Alan is a professor of computer science at Olin College and the author of a series of free open source textbooks related to software and data science. Alan and I will speak about uncertainty in data science and how we as humans are not always good at thinking about uncertainty, which we need to be in such an uncertain world. Should we have been surprised at the outcome of the 2016 election? What approaches can we as a data reporting community take to communicate around uncertainty better in the future? From election forecasting to health and safety, thinking about uncertainty and using data and data oriented tools to communicate around uncertainty is essential. I am Hugo Bown Anderson, a data scientist at Data Camp and this is Data Framed. Welcome to Data Framed, a weekly Data Camp podcast exploring what data science looks like on the ground for working data scientists and what problems it can solve. I'm your host, Hugo Bown Anderson. You can follow me on Twitter Hugo Bown and datacamp at datacamp. You can find all our episodes and show notes at datacamp.com/community podcast. Hi there Alan, and welcome to Data Framed.
Hey Hugo, thank you very much.
Such a pleasure to have you on the show. And I'm really excited to have you here to talk about uncertainty in data science, how we think about prediction and how we can think probabilistically and how, how we do it right and how we can get it wrong as well. But before we get into that, I'd love to find out a bit about you. And so I'm wondering what you're known for in the data community.
Right. Well, I'm working on a book series that's called Think X for All X. So hopefully some people know about that. Think Python is kind of the starting point. And then for data Science, Think Stats and Think Bayes for data science and for Bayesian statistics.
Great.
And so why Think came about Roundabout. The original book was called how to Think Like a Computer Scientist. And it was originally a Java book and then it became a Python book. And then it wasn't really about programming, it was about bigger ideas. And so then when I started the other books, the premise of the books is that you're using computation as a tool to learn something else. So it's a way of thinking, it's an approach to the topic. And so that's how we got to the schema that it's always think something for various values of something.
Right. I like that a lot. And speaking to this idea of Computation. I know you're a huge proponent of the role of computation in helping us to think, so maybe you can speak to that for a minute.
Sure. I mean, it partly comes. I've been teaching in an engineering program, and engineering education has been very math focused for a long time. So the curriculum, you have to take a lot of care, calculus and linear algebra before you get to do any engineering. And it doesn't have to be that way at all. I think there are a lot of ideas in engineering that you can get to very quickly computationally that are much harder mathematically. One of the examples that comes up all the time is integration, which is a little bit of a difficult idea. Students, when they see an integral sign, immediately, there's going to be some challenge there. But if you do everything discretely, you can take all of those integrals, you just turn them into summations, and then if you do it computationally, you take all those summations and turn them into. For loops. And you can have very clear code where you're looping through space, you're adding up all of the elements. That's what an integral is.
Absolutely. And I think another place that you've thought about a lot, and a lot of us have worked in where this rears its head is the idea of using computation and sampling and resampling data sets to get an idea about statistics.
Right, right. Yeah. I think classical statistical inference, looking at things like confidence intervals and hypothesis tests. Resampling is a very powerful tool. You're running simulations of the system and you can compute things like sampling, distribution or a p value in a. In a very straightforward way, meaning that it's easy to do, but it also just makes the concept transparent. It's really obvious what's going on.
That's right. And you actually, we've had a segment on the podcast previously, which is it's blog post of the week, and we had one on your blog post. There is only one test which really spells out the idea of that in the world of statistical hypothesis testing, there is really only one test. And the idea of. You can actually see that. And this is one of your. One of your great points. You can see that when you take the sampling, resampling, bootstrapping approach.
Right, right. Yeah. I think it makes the framework visible. That hypothesis, test, there's a model of the null hypothesis, and that's going to be different for different scenarios, and there's the test statistic, and that's going to be different for different scenarios. But once you've specified those Two pieces, everything else is the same. You're running the same framework, so I think it makes the concept much clearer.
Great. And we'll link to that in the show notes. We'll also link to your fantastic follow up post called There is still only one Test.
Well, that's just because I didn't explain it very well the first time, so I had to try again.
It also proves the point though, that there is still only one test. And I'll repeat that, that there is still only one test. So how did you get into data science originally?
Well, my background is computer science. So that's, you know, there are a lot of ways, a lot of doors into data science, but I think computer science is certainly one of the big ones. My master's thesis was on computer vision, so that was kind of a step in that direction. My PhD was all about measuring and modeling computational systems. So there are a lot of things that come in there like long tail distributions. And then in 2009, I did a sabbatical and I was working at Google in a group that was working on Internet performance. So we were doing a lot of measurement modeling, statistical descriptions and predictive modeling. So that's kind of where it started to get serious. And that's where I started when I was working on Think Stats for the first time.
So this origin story of you getting involved in data science, I think speaks to an interesting point, that you've actually touched a lot of different types of data. And I know that you're a huge fan of the idea that, you know, data science isn't necessarily only for data scientists, that it actually could be of interest to everyone because it touches. There are so many touch points with the way we live and data science.
Right, right. Yeah. This is one of my things that I get a little upset about is when people talk about data science and then they talk about big data and then they talk about quantitative finance and business analytics, like that's all there is. And I use a broader notion of what data science is. I'd like to push the idea that it's anytime that you're using data to answer questions and to guide decision making, because that includes a lot of science, which is often about answering questions, a lot about engineering, where you're designing a system to achieve a particular goal and of course, decision making, both on an individual or a business or a national public policy level. So I'd like to see data science involved in all of those pieces.
Absolutely. So we're here to talk about uncertainty today. One part of data science is making predictions which we'll get to. But the fact that we live in an uncertain world is incredibly interesting because what we do as a culture and society, we use probability to think about uncertainty. So I'm wondering your thoughts on whether we as humans are actually good at thinking probabilistically.
Right. It's funny because we. We are, and we are not at the same time.
I'm glad you didn't say we probably are.
Right.
Yeah, that would have been good.
So we do seem to have some instinct for probabilistic thinking, even for young children. We do something that's like a Bayesian update. When we get new data, if we're uncertain about something, we get new evidence, we update our beliefs, and in some cases, we actually do a pretty good approximation of an accurate Bayesian update, typically for things that are kind of in the middling range of probability, maybe from about 25% to 75%. At the same time, we're terrible at very rare things. Small probabilities we're pretty bad at. And then there are a bunch of ways that we can be consistently fooled because we're not actually doing the math, we're doing approximations to it. And those approximations fail consistently in ways that behavioral psychologists have pointed out, things like confirmation bias and. And other cognitive failures like that.
So I want to speak to an article you wrote on your blog called why Are we so Surprised? In which you stated, in theory, we should not be surprised by the outcome of the 2016 presidential election, but in practice, we are. So I'm wondering why you think we shouldn't have been surprised.
Right. Well, a lot of the forecasts, a lot of the models coming from FiveThirtyEight and from the New York Times, they were predicting that Trump had about a 25% chance, maybe more, of winning the election. So if something's got a 25% chance, that's the same as flipping a coin twice and getting heads twice. You wouldn't be particularly surprised by that. So in theory, a 25% risk shouldn't be surprising. But in practice, I think people still don't really understand probabilistic predictions. One reason we can see that is the lack of symmetry, which is, if I tell you that Trump has a 25% chance of winning, you think, well, okay, that might happen. But when 538 said that Hillary Clinton had a 70% chance of winning, I think a lot of people interpreted that as a deterministic prediction, that538 was saying, Hillary Clinton is going to win. And then when that didn't happen, they said, well, then 538 was wrong. And I don't think that's the right interpretation of a probabilistic prediction. If someone tells you there's a 70% chance and it doesn't happen, that should be mildly surprising, but it doesn't necessarily mean that the prediction was wrong.
Yeah. And in your article, you actually make a related point that everybody predicted at some level, well, predicted that Hillary had over a 50% chance of winning. And you made the point that people interpreted this as there was consensus that Hillary would win with different degrees of confidence.
Right.
But that's. So, as you stated, that's, that's interpreting it as deterministic predictions, not probabilistic predictions, right?
Yeah, I think that's right. And it also, it fails the symmetry test, again, because different predictions, they ranged all the way from 70% to 99%. And people reacted as if that was a consensus. But that's not a consensus. If you flip it around, that's the range from saying that Trump has anywhere between 1% and 30% chance of winning. And if the predictions had been expressed that way, I think people would have looked at that and said, oh, clearly there's not a consensus there because there's a big difference between 1% and 30%.
I really like this analogy to flipping coins because it puts a lot of things in perspective. So another example, as you mentioned in post in your article, the New York Times gave Trump a 9% chance of winning. And if you flip a coin four times in a row and get four heads, that's relatively surprising. But you wouldn't be like, oh, I can't believe that happened. And that has a 6.25% chance of happening.
Right, Right, right. Yeah. I think that's a good way to get a sense for what these probabilities mean.
So you mentioned also that these models were actually relatively credible models. So maybe you can speak to that.
Yeah, I think going in, two reasons to think that these predictions were credible. One of them was just past performance that538 and the new York Times had done well in previous elections. But maybe more important, their methodology was transparent. They were showing you all of the poll data that they were using as inputs. And I think they weren't, you know, actually publishing the algorithms, but they gave a lot of detail about how these things were working. Some polls are more believable than others. They were applying correction factors and they also had. They were taking time into account. So a more recent poll would be weighted more heavily than a. A poll that was farther into the past, ahead of the fact that we had good reasons to believe the predictions. And after the fact, even though the outcome wasn't what we expected, that really just doesn't mean that the models are wrong.
And so with all of this knowledge around how uncertain we are about uncertainty and how we can be good and bad about thinking probabilistically, what approaches can we as a data reporting community take to communicate around uncertainty better in the future?
Right? I think we don't know yet. But one of the things that I think is good is that people are trying a lot of different things. So, again, taking the election as an example, you know, the New York Times had the twitchy needle that was sort of famously, maybe not the best way to represent that information. There were other examples. You know, Nate Silver's predictions are based on running many simulations. So he would show a histogram that would show the outcome of doing many, many simulations. And that, I think, probably works for some audiences. I think it's tough for other audiences. One of the suggestions I made that I would love to see someone try is instead of running many simulations and trying to summarize the results, I'd love to see one simulation per day with the results of one simulation presented in detail. So thinking back to 2016, suppose that every day you looked in the paper and it showed you one possible outcome of the election. And let's say that Nate Silver's predictions were right and there was a 70% chance that Clinton would win. So in a given week, you would see Clinton win maybe four, five times. You would see two Trump win two or three times. And I think at the end of that week, your intuition would actually have a good sense for that probability.
I think that's an incredible idea because what it speaks to for me personally is you're not really looking at these simulations or these results in the abstract. You're actually experiencing them firsthand in some way.
Exactly. So you get the emotional effect of opening the paper and seeing that Trump won. And if that's already happened a few times in simulation, then the reality would be a lot less surprising.
Are there any other types of approaches or ways of thinking that you'd like to see more in future?
Well, as I said, I think there are a lot of experiments going, so I think we will get better at communicating these ideas. And I think the audience is also learning so different visualizations that wouldn't have worked very well a few years ago. Now people are, I think, just better at interpreting Data interpreting visualizations because it's become part of the media in a way that it wasn't if you look back, you know, not that long ago. You know, I don't know if you remember when USA Today started doing infographics and that was a thing, people were really excited about those infographics. And you look back at those things now and they're terrible. It'll be like they've come a long way. It'll be something that's really just a bar chart, except that the bar is made up of stacked up apples and stacked up oranges. And that was data visualization, say 20 years ago. And now you look at the things that the New York Times is doing with interactive visualizations. I saw one the other day, which is their three dimensional visualization of the yield curve, which is a tough idea in finance and economics. And a 3D visualization is tough and interactive visualization is challenging. So maybe it doesn't work for every audience, but I really appreciated just the ambition of it.
So you mentioned the role of data science in decision making in general. And I think in a lot of ways we make decisions based on all the data we have and then a decision is made. But a lot of the time the quality of the decision will be rated on the quality of the outcome, which isn't necessarily the correct way to think about these things.
Right, right. I gave an example about blackjack that you can make the right play. In blackjack, you take a hit when you're supposed to take a hit and if you go bust, it's tempting to say, oh, well, I guess I shouldn't have done that. But that's not correct. You made the right play. And in the long run, that's the right decision. Any specific outcome is not necessarily going to go your way.
Yeah, but we know that in that case, because we can evaluate the predictions based on the theory we have and the simulations we have in our mind, or computationally. Right. And long term rates, essentially.
Right. Yeah. Blackjack is easy because every game of blackjack is kind of the same. So you've got these identical trials, you've got long term rates. We, we have a harder time with single case predictions, single case probabilities, like.
Election forecasting, like elections.
Right. But in that case. Right. You can't evaluate a single prediction. You can't say specifically whether it's right or wrong, but you can evaluate the prediction process. You can check to make sure that probabilistic predictions are calibrated. So maybe getting back to Nate Silver again in the signal and the noise. Here he uses a nice example, which is the National Weather Service, which is they, they make probabilistic predictions. They say 20% chance of rain, 80% chance of rain. And on any given day, you don't know if they were wrong. So if they say 20% and it rains, or if they say 80% and it doesn't rain, that's a little bit surprising, but it doesn't make them wrong. But in the long run, if you keep track of every single time that they say 20% and then you count up how many times does it actually rain on 20% days and how many times does it rain on 80% days? If the answer is 20% and 80%, then that's a well calibrated probabilistic prediction.
So this is another example. The weather is one we've talked about, election forecasting. And these are both, you know, examples where it's, we really need to think about uncertainty. I'm wondering what other examples in society are of where we need to think about uncertainty and why they're important.
Yep. Well, a big one. You know, anything that's related to health and safety. Those are all cases where we're talking about risks. We're talking about, you know, interventions that have certain probabilities of good outcomes, certain probabilities of side effects. And those, those are other cases, I think, where sometimes our heuristics are good and other times we make really consistent cognitive errors.
There are a lot of cognitive biases, and one that I fall prey to constantly is, I'm not even sure what it's called, but it's when you have a small sample size and I see something occur several times, I'm like, oh, that's probably the way things work, right?
Yeah, I guess that's a form of overfitting in statistics. There's sort of a joke that people talk about the law of small numbers, but that's right. I think that's a version of jumping to conclusions. That's an example where I think doctors have had a version of that in the past, which is they make decisions often about treatment that are based on their own patients. So such and such a drug has worked well for my patients and I've seen bad outcomes with my patients, as contrasted with using large randomized trials, which, you know, we've got a lot of evidence now that randomized trials are a more reliable form of evidence than the example that you gave of generalizing from small numbers.
So health and safety, I suppose, as you said, are two relevant examples what can we do to combat this?
Do you think that one's tough? I'm thinking about some of the ways that we get health wrong, some of the ways that we get safety. Certainly one of the problems is that we're very bad at small risks, small probabilities. There's some evidence that we can do a little bit better if we express things in terms of natural frequencies. So if I tell you that something has a.001% probability, you might have a really hard time making sense of that. But if I tell you that it's something like one person out of 10,000, then you might have a way to picture that. You could say, well, okay, at a baseball game, there might be 30,000 people. So there could be three people here right now who have such and such a condition. So I think expressing things in terms of natural frequencies might be one thing that helps.
Interesting. So essentially, these are, I suppose, linguistic technologies and adopting things that we know work in language.
Yeah, I think so. I think graphical visualizations are important, too. Certainly, we have this incredibly powerful tool, which is our vision system, that's able to take a huge amount of data and process it quickly. So that's, I think, one of the best ways to get information off a page and into someone's brain.
Yeah, look, this actually just reminded me of something I haven't thought about in years, but it must have been 10 or 15 years ago. I was at an art show in Melbourne, Australia, and there was an artwork which it was visualizing how many people had been in certain situations or done certain things using grains of rice. So they had a bowl, like the total population of Australia, the total population of the US and then the number of people who were killed during the Holocaust, and, you know, the number of people who've stepped on the moon and that type of stuff. And it was actually incredibly vivid and memorable. And you got a strong sense of magnitude there.
Yes, I think that works. There's a video I saw. We'll have to find this and maybe put in a link about war casualties and, you know, showing a little individual person for each casualty, but then adding it up and showing, you know, colored rectangles of different casualties in different wars, the number of people from each country, and that was very effective. And then I'm reminded of XKCD has done several really nice examples to show the relative sizes of things just by mapping them onto area on the page. One of the ones that I think is really good is different doses of radioactivity, where he was able to show many different Orders of magnitude by starting with a small unit that was represented by a single square and then scaling it up and then scaling it up so that you could see that there are orders of magnitude between things like dental X rays that we really should not be worrying about and other kinds of exposure that are actual health risks.
So what are the most important misconceptions regarding uncertainty that you think we need to correct as data oriented educators?
Right. Well, we talked about probabilistic predictions. I think that's a big one. I think the other big one that I think about is the shapes of distributions. That when you try to summarize a distribution, if I just tell you the mean, then people generally assume that it's something like a bell shaped curve. And we have some intuition for what that's like, that, you know, if I tell you that the average human being is about 165cm tall or I think it's more than that, but anyway, you get a sense, okay, so probably there are some people who are over 200 and probably there are some people who are less than 60, but there probably isn't anybody who is a kilometer tall. We have a sense of that distribution. But then you get things like the Pareto distribution. And this is one of the examples I use in my book is what I call Pareto world, which is the same as our world because the average height is about the same, but the distribution is shaped like a Pareto distribution, which is one of these crazy long tailed distributions. And in Pareto world the average height is between 1 and 2 meters, but the vast majority of people are only a centimeter tall. And if you have 7 billion people in Pareto world, the tallest one is probably 100 kilometers tall.
That's incredible. And just quickly, what type of phenomena do Pareto distributions? What are they known to model?
Well, I think wealth and income are two of the big ones. In fact, I think that's the original domain where Pareto was looking at these long tailed distributions. And that's the case where a few people have almost all of the wealth and the vast majority of people have almost none. So that's a case where if I tell you the mean and you are imagining a bell shaped distribution, you have totally the wrong picture of what's going on. The mean is really not telling you what a typical person has. In fact, there may be no typical person.
That's a great example. Another example is if you have a bimodal distribution with nothing in the middle the mean, there could actually be no one with that particular quantity. Of whatever we're talking about.
Yeah, that's a good example.
We'll jump right back into our interview with Alan after a short segment. And now we've got another installment of Statistical Distributions and Their Stories with Justin Boyce, who has been a storyteller on these segments. Each story is about a probability distribution. He's told us about the Bernoulli distribution and the binomial distribution so far. Hey, Justin.
Hi, Hugo.
Justin, can you remind us about the stories of the two distributions you've already told us about?
Sure. Both stories use the concept of a Bernoulli trial. Not to be confused with the Bernoulli distribution. A Bernoulli trial is an experiment that has an outcome that can be encoded as 1 or success or 0, called a failure. The classic example is the flip of a possibly biased coin. Now, the story behind the binomial distribution is as the number r of successes in n Bernoulli trials, each with probability p of success, is binomially distributed. The Bernoulli distribution is a special case of the binomial distribution where N is one. That is there is just one Bernoulli trial.
Okay, so if LeBron James takes 30 shots, the number he makes will be binomially distributed, right?
Yes. In that case, the probability of success p is about 0.54.
And the outcome of a single shot he shoots is Bernoulli distributed.
Correct.
What about the Number of times LeBron attempts a field goal in each game? How is that distributed?
That's a great question. In order to answer that question, we need to know about the process by which LeBron shoots. We might assume that his shots occur completely randomly in time. We can assume further that when LeBron shoots next, it's completely independent of the last time he shot. He has some characteristic rate of shooting, but the shots themselves are uncorrelated.
Those seem like reasonable assumptions.
Sure. And under those assumptions, the number of shots LeBron shoots per game is Poisson distributed.
Ah, so it's a different distribution and we just told its story, right?
Yes, we did. The story hinges on the concept of a Poisson process. I think a Poisson process is best described with another story which I heard from David Mackay. Buses in the town of Poissonville have a peculiar property that the time I have to wait at the bus stop for the arrival of the next bus is completely unrelated to when the previous bus arrived. On average, though lambda buses arrive per hour. The arrival of buses in Poissonville is a Poisson process with rate lambda.
I think I've been in cities like Poissonville Waiting for the subway in New York can feel like that, actually.
Yeah, me too. I sometimes feel that way in Los Angeles. Now, the bus story is convenient since we refer to events in Poisson processes as arrivals. Okay, now that we know what a Poisson process is, we can formalize the story of the Poisson distribution. Here goes. The number of arrivals of a Poisson process with rate lambda in a given amount of time is Poisson distributed.
I think it's clear now. So in the LeBron example, we are modelling his shot attempts as a Poisson process. The given amount of time is the length of a basketball game and the number of shots he attempts in a game with Poisson distributed.
Exactly. You just did what I've been talking about in these segments. Substitute some nouns in your story and get them to match the story of the distribution.
Great.
Do you have anything else to say about the Poisson distribution?
Well, there's lots to say, but I'll just mention that it is related to the binomial distribution that we already saw. You can see it if you think that the number of Bernoulli trials N is related to the given amount of time in a Poisson process. The probability of success P times N is related to the rate of the Poisson process lambda. To formally relate them, you have to consider that time is continuous. So if you take the binomial distribution in the limit of large N and small P such that n times P is constant, you get a Poisson distribution.
It's very useful to know how all these distributions are related to each other.
It sure is. If you find your data are not being well described by a simple distribution, you can sequentially build complexity in your models if you know how the distributions are related.
Thanks for that, Justin. Maybe we can talk about continuous distribution soon. I recall that the time I need to wait for a New York subway may be exponentially distributed, as is the time between arrivals for any Poisson process.
You bet. I'll see you soon, Hugo.
After that interlude, it's time to jump back into our chat with Alan. Due to a minor technical challenge, the audio quality may be slightly reduced, but hopefully the strength of our chat will make up for that. So, Alan, when you were discussing the Pareto distribution and the normal distribution, then really something struck me that as stakeholders and decision makers and research scientists and data scientists, and we've seemed to be more comfortable in thinking about summary statistics and concrete numbers instead of distribution. So what I mean by that is we like to report the mean, the mode, the median and measures of Spread, such as, such as the variance. And there seems to be some sort of discomfort we feel, or we're not great at thinking about distributions which seem kind of necessary to quantify and think about uncertainty.
No, I think that's right. It doesn't come naturally. You know, I work with students. It takes a while to just understand the idea of what a distribution is. But I think it's important because it captures all of the information that you have about a prediction. You want to know all possible outcomes and the probability for each possible outcome. That's what a distribution is. It captures exactly the information that you need as a decision maker.
So, I mean, instead of communicating, for example, p values in hypothesis testing, we can actually show the distribution of the possible effect sizes.
Right, right. And this is the strength of Bayesian methods, because what you get is a posterior distribution that captures this information. And if you now feed that into a decision making process, it answers all the questions that you might want to ask. If you only care about the central tendency, you can get that. But very often there's a cost function that says, you know, if this value turns out to be very high, there's a cost associated with that. If it's low, there's. There's a cost associated with that. So if you've got the whole distribution, you can feed that into a cost benefit analysis and make better decisions.
And I love the point that you made, which I think about a lot of the time. And when I teach Bayesian thinking and Bayesian inference, I make this incredibly explicit all the time that from the posterior, from the distribution, you can get out so many of the other things that you need and you would want to report.
Right. So maybe you care, you know, what's the probability of a given catastrophic output? So in that case, you would be looking at, you know, the tails of that distribution or something like, you know, what, what's the probability that I'll be off by a certain amount? Or again, you know, things like the mean and the spread, Whatever the number is, you can get it from the distribution.
This leads to another question which I wanted to talk about. Bayesian inference, I think of in a number of ways as a technology that we've developed to deal with these types of questions and concepts. I think also we have reached a point in the past decades where Bayesian inference, now, because of computational power we have, is actually far more feasible to do in a robust and efficient, efficient manner. And I think we may get to that in a bit. But I'm wondering in general, so what technologies to your mind, are best suited for thinking and communicating around uncertainty. Alan?
Well, you know, there are a couple of visualizations that people use all the time. And of course, you know, the classic one is a histogram. And that one, I think, is most appropriate for a general audience. Most people understand histograms. Violin plots are kind of similar. That's just two histograms back to back. And I think those are good because people understand them, but problematic. I mean, I've seen a number of articles of people pointing out that you kind of have to get histograms right. If the bin size is too big, then you're smoothing away a lot of information that you might care about. If the bin size is too small, you're getting a lot of noise, and it can be hard to see the shape of the distribution through the noise. So one of the things I advocate for is using CDFs instead of histograms or PDFs as the default visualization. And when I'm exploring a data set, I'm almost always looking at CDFs because you get the best view of the shape of the distribution. You. You can see modes, you can see central tendencies, you can see spread. But also if you've got weird outliers, they jump out. And if you've got repeated values, you can see those clearly in a CDF with less visual noise, that distracts you from the important stuff. So I love CDFs. The only problem is that people don't understand them. But I think this is another case where the audience is getting educated, that the more people are consuming data journalism, the more they're seeing visualizations like this, and there's some implicit learning that's going on. I saw one example very recently, someone showing the altitude that human populations live at because they were talking about sea levels rising and talking about the fraction of people who live less than 4 meters above sea level. But the visualization was kind of a sneaky cdf. They showed it's actually a CDF sideways, but it was done in a way where a person who doesn't necessarily have technical training would be able to figure out what that graph was showing. So I think that's a step in a good direction.
I like that a lot. And just to clarify, a CDF is a cumulative distribution function.
Yes.
Sorry, I should have said that.
Yeah.
And in particular, I'm Talking about empirical CDFs, where you're just taking it straight from data and generating the cumulative distribution function.
Fantastic. And one of the nice things there. So each point on the x axis, the Y value will correspond to the number of data points equal to or less than that particular point. And one of the great things is you can also read off all your percentiles.
Right, exactly right. You can read it in both directions. So if you start on the Y axis, you can pick the percentile you want, like the median 50 percentile, and then read off the corresponding X value. Or the flip side is exactly what you said. If you want to know what fraction of the values are below a certain threshold, then you just read off that threshold and get the corresponding Y value.
Yeah. And one of the other things that I love, you mentioned a bunch of, well, several very attractive Characteristics of Empirical CDFs, ECDFs. I also love that you can plot your control and a lot of different experiments just on the same figure and actually see how they differ, as opposed to, like, you try to plot a bunch of histograms together. You got to do wacky transparencies and all of this stuff, right?
Yes, that's exactly right. You can stack lots of CDFs on the same axes, and the differences that you see are really the differences that matter. When you compare histograms, you're seeing a lot of noise, and you can see differences between histograms that are just random. When you're looking at CDFs, you get a pretty robust view of what the differences are and where in the distribution those differences happen.
Yeah, fantastic. Look, I'm very excited for a day in which the general populace appreciate CDFs and they appear in the mainstream media. I think that's a bright future.
Yeah. And I think we're close. I've seen one example. There have got to be more.
Are there any other technologies or ways of thinking about uncertainty that you think are useful?
Well, we talked a little bit about visualizing simulations. I think. I think that matters. There's one example, maybe getting back to. If we have to get back to the 2016 election, I think one of the issues that came up is that a lot of the predictions, when they showed you a map of the different states, they were showing a color scale where there would be a red state and a blue state, but also pink and light blue and purple. And they were trying to show uncertainty using that color map, but then that's, you know, that's not how the Electoral College works. The Electoral College, every state is either all red or all blue, with just a couple of exceptions. So that was a case where the predictions ended up looking very different from what the final results look like. And I think that's part of why we were uncomfortable with predictions and the results.
Interesting. So what is a fix for that, do you think?
Well, again, coming back to my suggestion about, you know, don't try to show me all possible simulation outcomes, but show me one simulation per day. And in that case, the result that you show me, the daily result would be all red or all blue. So the predictions in that sense would look exactly like the outcome. And then when you see the outcome, the chances are that it's going to resemble at least one of the predictions that you made.
Great. And I just had a kind of a future flash of brainwave into a future where we can use virtual reality technologies to drop people into potential simulations. But that's definitely future music.
Yeah, I think that's interesting.
Yeah. So, speaking of the future, we've talked a lot about modern data science and uncertainty. I'm wondering what the future of data science looks like to you.
I think a big part of it looks like more people being involved. So not just highly trained technical statisticians, but we've been talking about data journalists, for example, who are people who have a technical skill to look at data, but also the storytelling skill to ask interesting questions, get answers and then communicate those answers. And I'd love to see all of that become more part of general education. Starting in primary school, starting in secondary school, working with data, working with some of these visualizations, we've been talking about using data to answer questions, using data to explore and find out about the world at the stage that's appropriate at different levels of education. There's a lot of talk about trying to get maybe less calculus in the world and more data science. And I think that's got to be the direction we go. If you look at what people really need to know and what they're likely to use, practically everybody is going to be a consumer of data science. And I think more and more people are going to be producers of data science. So I think that's got to be part of a core education. And calculus. I love calculus, but it's just not as important for as many people.
Yeah. And arguably for you in your engineering and engineering background, I mean, calculus is incredibly important for engineers and physicists, but other people who need to be quantitative is. I think your point is very strong, that learning how to actually work with data and statistics around that is arguably a lot more essential.
Yeah, yeah. I think, as I said, more and more people are going to be doing at least some kind of data science where they're taking advantage of all of the data now that's freely available and that's, you know, government agencies are producing huge volumes of data and often they don't have the resources to really do anything with it. They've got a mandate to produce the data, but they don't have the people to do much. But the flip side of that is there's a huge opportunity for anyone with basic data skills to get in there and find interesting things. Often you're one of the first people to explore a data set. You know, if you jump in there on the day it's published, you can find all kinds of things. Not necessarily using, you know, powerful or complex statistical methods, just basic exploratory data analysis.
Yeah. And the ability now to get, you know, learners, students, people in educational institutions involved in data science by making it, or letting them realize that it's relevant to them, that there's data about their lives, about their physiological systems that they can analyze and explore. I think is a huge win.
It is, it's really empowering. And this is one of the reasons that I call myself a data optimist. And what I, what I mean by that is I think there are huge opportunities here to use data science for social good. Getting into these data sets, as you said, they are relevant to people's lives. You can find things. I saw a great example at a conference recently. I was talking to a young guy from Brazil who had worked on an application that was going through government data that was available online and flagging evidence of corruption, evidence of budgets that were being misspent, and they would tweet about it. There was just a robot that would find suspicious things in these accounts and tweet them out there, which is a kind of transparency that I think makes governments better. So I think there's a lot of potential there.
That's incredible. Actually, that reminded me. I met a lawyer who was non technical a while ago and non computational, but he was learning a bit of machine learning, a bit of Python. He was trying to figure out whether you could predict judgments handed down by the Supreme Court based on previous judgments and who would, who would vote in a particular way. And that's just because that's something that really interests him professionally and in terms of social justice as well.
Right. And I think, you know, the fact that people can do that, who are not necessarily experts in that field, but amateurs, for want of a better word, can get in there and really do useful work. I think there are a lot of concerns too, and this is getting a lot of attention right now. I'm actually in the middle of reading Weapons of Math Destruction, Kathy o' Neill's book. And there are a lot of concerns, and I think there are things that are scary that we should be thinking about. But one of the things I'm actually thinking about now and trying to figure out is how do we balance this discussion? Because I think we're having, or at least starting a good public discussion about this. It's good to get the problems on the table and address them. But how do we get the right balance between the optimism that I think is appropriate, but also the concerns that we should be dealing with?
And as you say, there are more and more books being published by, more and more conversations happening in public. I mean, it's the past several weeks that Mike Lucidis, Hillary Mason and DJ Patel have posted their series of articles on data ethics and what they would like to see adoption in culture and in tech, among other places. I do think Weapons of math destruction is very interesting as part of this conversation, because of course, one of the key parts of a definition for Kathy o' Neill of a weapon of math destruction is that it's not transparent as well. Right. So all the cases we're talking about kind of involve necessary transparency. So if we see more of that going forward, we'll at least be able to have a conversation around it.
Right? I do, and I agree with both o' Neill and with you. I think that's a crucial part of these algorithms. And, you know, open science and reproducible science is based on transparency and open data and open, you know, also open code and open methodology.
And this actually brings me to another question, which is a through line here is the ability of everybody, every citizen to interact with data science in some sense. And I'm wondering for you, in your practice and as a data scientist and an educator, what is the role of the open source in the ability of everybody to interact with data science?
Right. Well, I think it's huge. Reproducible science doesn't work if your code is proprietary. If you only share your data, but not your methods, that only goes so far. It also doesn't help very much if I publish my code, but it's in a language that's not accessible to everybody, languages that are very expensive to get your hands on, even among relatively affluent countries, you're not necessarily going to have access to that code. Then when you go worldwide, there are great majority of people in the, in the world that are not going to have access to that, as contrasted with languages like R and Python that are Freely available. Now you still have to have access to technology, and that's not universal, but it's better. And I think free software is an important part of that. Yeah, this is part of the reason that I put my books up under free licenses is I know that there are a lot of people in the world who are not going to buy hard copies of the these books, but I want to make them available and I do. You know, I get a lot of correspondence from people who are using my books in electronic forms who would not have access to them in hard copy.
So I'm wondering, we've talked about a bunch of techniques that are dear to your heart. I'm wondering what one of your favorite data sciencey techniques or methodologies is.
Right.
I have a lot.
Let's do it.
This might not be a short list.
Sure.
So I am at heart a Bayesian. I do a certain amount of computational inference. You know, you doing classical statistical inference. But I'm really interested in helping Bayesian methods spread. And I think one of the challenges there is just understanding the ideas. It's one of these ideas that seems hard when you first encounter it, and then at some point there's a breakthrough and then it seems obvious once you've got it. It is such a beautiful, simple idea that it changes how you see everything. So that's what I want to help readers get to and my students is get that transition from the initial confusion into that moment of clarity. One of the methods I use for that, and this is what I use in Think Bayes a lot, is just grid algorithms where you take everything that's continuous and break it up into discrete chunks and then all the integrals become for loops. And I think it makes the ideas very clear. And then I think the other part of it that's important is the algorithms, particularly MCMC algorithms, which, you know, that's what makes Bayesian methods practical for substantial problems. You mentioned earlier that you know, the computational power has become available and that's a big part of what makes Bayes practical. But I think the algorithms are just as important in particularly when you get start to get up into higher dimensions. It's just not feasible without modern algorithms that are really quite new developed in the last decade or so.
I just want to speak to the idea of grid methods. And you said turning, you see integrals become for loops. And I think this is something which has actually been behind a lot of what we've been discussing as well, and something that actually attracted me to your pedagogy initially and all of your work was this idea of turning math into computation. And we see the same with techniques such as the bootstrap and resampling, but taking concepts that seem, you know, relatively abstract and seeing how they actually play out in a computational structure and making that translational step there.
Yeah, I found that very powerful for me as a learner. I've had that experience over and over of reading something expressed using mathematical concepts, and then I turn it into code. And I feel like that's how I get to understand it. Partly because you get to see it happening often. It's very visual in a way that the math is not, at least for me, but the other is it's debuggable that if you have a misunderstanding, then when you try to represent it in code, you're going to see evidence of the misunderstanding. It's going to pop up as a bug. So when you're debugging your code, you're also debugging your understanding, which for me builds the confidence that when I've got working code, it also makes me believe that I understand the thing.
And a related concept is the idea that breaking it down into chunks of code, but allows you to understand smaller concepts and build up the entire concept in smaller steps.
Right, Yeah, I think that's a good point, too.
Are there any other favorite techniques? You can have one or two more if you'd like.
I'll mention one, which is survival analysis, and partly because it doesn't come up in an introductory class most of the time, but it's something I keep coming back to. I've used it for several projects, not necessarily looking at survival or medicine, but things like a study that I did of how long a marriage lasts or how long it is until someone has a first child or gets married for the first time, or how long the marriage itself lasts until a divorce. So that, as I said, it's not an idea that everybody sees, but once you learn it, you start seeing a lot of applications for it.
And this did make it into your Think Stats book. Do I recall correctly or.
Yes. Yeah, I've got a section on survival analysis.
Yeah, fantastic. So we'll definitely link to that in the show notes as well. So my last question is, do you have a call to action for all our listeners out there?
Maybe two. I think if you have not yet had a chance to study data science, you should. And I think there are a lot of great resources that are available now that just weren't around not too long ago, and especially if you took a statistics class. In high school or college, and it did not connect with you. The problem is not necessarily you that the standard curriculum in statistics for a long time, I think, has just not been right for most people. I think it's just spent way too much time on esoteric hypothesis tests. It gets bogged down in some statistical philosophy. That's actually not very good philosophy. It's not very good philosophy of science. If you come back to it now from a data science point of view, it's much more likely that you're going to find classes and educational resources that are much more relevant. They're going to be based on data, they're going to be much more compelling. So give it another shot. I think that that's my first call to action.
I would second that.
And then the other is for people who have got data science skills, there are a lot of ways to use that to do social good in the world. I think a lot of data scientists end up doing quantitative finance and business analytics. Those are kind of the two big application domains and there's nothing wrong with that. But I also think there are a lot of ways to use the skills that you've got to do something good to, you know, find stories about what's happening and get those stories out to, you know, use those stories as a way to effect change or if nothing else, just to answer questions about the world. If there's something that interests you, very often you can find data and answer questions. Questions.
And there are a lot of very interesting data for social good programs out there, which we've actually had Peter Bull on podcast to talk about data for good in general. And we'll put some links in the show notes as well.
Yes. And then I've got actually a talk that I want to link to that I've done a couple of times that's called Data Science Data Optimism. And the last part of the talk is my call for data science for social good. I've got a bunch of links there that I've collected that are just really the people that I know and groups that I know who are working in this area, but it's not complete by any means. So I would love to hear more from people and maybe help me to expand my list.
Fantastic. And people can reach out to you on Twitter as well, is that right?
Yes. I'm alandowney.
Fantastic. Alan, it's been an absolute pleasure having you on the show.
Thank you very much. It's been great talking with you.
Thanks for joining Our conversation with Alan about uncertainty in data science. We saw that as humans, we're both good and bad at thinking probabilistically. When our probabilistic heuristics work, we're able to approximate pretty complex analysis by intuition. But our heuristics do tend to fail us in consistent ways with cognitive biases such as confirmation bias. We're also not great at interpreting probabilities, and this is part of why we were so surprised at the result of the 2016 election. Remember that Trump having a 25% chance of winning is the same probability of seeing two heads when flipping a fair coin twice. We saw that thinking probabilistically is not only important in election forecasting, but also in health, safety, and many other sectors of human life. Alan also stressed how important it is to think creatively about expressing uncertainty, whether it be by using cumulative distribution functions, reporting distributions instead of mere summary statistics, or simulating outcomes and reporting these simulations in detail daily. The final takeaways I'll leave you with are to get involved in data science if you're not already, and if you are, to use your skills to leverage data science for social good. Also next week I'll be speaking with Vicky Boikus, a Full Stack data scientist and Senior manager at Captech Consulting, working on projects in machine learning and data engineering. We'll discuss what Full Stack end to end data science actually is, how it works in a consulting setting across various industries, and why it's so important in developing modern data driven solutions to business problems. Don't miss out. I'm your host Hugo Baun Anderson. You can follow me on Twitter hugobaun and datacampatacamp. You can find all our episodes and show notes@datacamp.com Community Podcast SA.
More from Richie

#359 My Best Friend is AI with Valerie Tiberius, Professor of Philosophy at University of Minnesota







How AI Agents Will Work While You Sleep | Ruslan Salakhutdinov, Professor at Carnegie Mellon

#358 How AI Agents Will Work While You Sleep | Ruslan Salakhutdinov, Professor at Carnegie Mellon

