DataCamp Workspace Live Code-Along
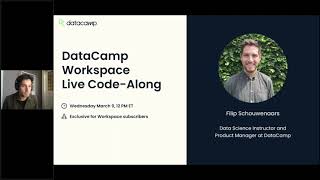
Ryan and Philip demo DataCamp Workspace, a browser-based collaborative notebook for data analysis. They walk through analyzing the unicorn companies dataset, creating visualizations with Matplotlib and Plotly, inviting a colleague to edit in real time, and publishing the notebook as a shareable report that appears on your DataCamp profile.
Chapters
Hello everyone. Welcome to today's live Workspace Code along. My name is Ryan. I work here at datacamp on the marketing team. Today's code along will be given by Philip Schoenars. Philip is a passionate developer behind several datacamp's most popular Python SQL in R courses. Currently he leads the development of datacamp Workspace. Philip holds degrees in electrical engineering and artificial intelligence. As a reminder, this presentation will be followed by Q and A, so make sure to ask questions in the questions section as the presentation goes along. This presentation will be recorded, so look for an email with the recording over the next couple of days. So without further ado, Philip, I'll hand.
It over to you. Right. Thanks Ryan. So what I want to talk to you about today is what is Data Camp Workspace and how can you use it? Then I wanted to go over codelong, where we actually analyze a data set inside Workspace and add a publication to our profile page as such, building out the Data Science portfolio. And then at the end, as Ryan already mentioned, we'll have questions. So first, setting the stage a bit, what is datacamp Workspace? So datacamp Workspace is actually a collaborative cloud based notebook that allows you to analyze data, collaborate with others and sharing insights. In short, what does this mean? Think Google Docs, but specifically for Data Science, you don't have to install anything on your computer, you just have to have a browser. Can go to datacam.com, open up a workspace and just get started coding. You don't have to worry about installing Python or R, whatever the language is that you're interested in. You don't just install any additional packages. It's super easy to get started, super easy to publish your work, just super easy to do Data science. Basically some key features that are super interesting to basically get to work with. Workspace is first off ready to use data sets. What we typically hear from people is they don't really know how to get started. They want to start on a project, but they're looking for an interesting data set to analyze to begin with. What we did, we basically created a curated list of data sets that is very easy to get started from, very easy to set up in Workspace so that you can just focus on writing the codes and analyzing the data. And this is actually something we'll cover in the code log right after this. Then another one. Like a key feature of Workspace is this collaboration feature. Like I said, it's a bit like the Google Docs for Data Science. So it means that you can work with classmates, peers, colleagues in real time, just like you would do in Google Docs. It's super easy to work together. It's super easy to get feedback from each other. You can leave comments on each other's work. You can just work in the same workspace at the same time basically. And then when you're ready to share the work you've done, you can create a publication of your workspace, basically a publication of your notebook, and then share this with whoever is interested. So basically with readers, this is all combined with very tight security control so that you control who gets access to what, so you can decide. Like some workspaces of mine, I do not share with anyone. Other workspaces I share publicly. Other workspaces I share with only a specific set of people. And again, this is also something that we'll cover in this code log. And finally, also compelling part of Workspace is that it's super easy to create a data science portfolio from our users. We heard. So I have a couple of projects, but then how do I show these to the world? Should I put them on a GitHub repository? Should I create my own personal website? How do I go from this Jupyter notebook to this good looking publication? This is a struggle. So what we did with Workspace is made it super easy for people to actually put the projects that they're working on in Workspace, to basically link them to their datacamp profile and as such building out a portfolio of their best workspace reports. And this is then something that you can again share with peers, colleagues, but maybe also future employers. And that's also something we'll cover in this code along. And then finally something we won't cover in this code long. But the longer term goal of Workspace is to also be a tool to actually do data science professionally. So if you want to connect to your data, like your personal data, your company's data, you can do that seamlessly and securely. And you can do that through a bunch of native integrations that we've added. So this is not something we'll cover in the code log today. But this is like the longer term goal of Workspace that this becomes truly like a workbench that you use professionally. And then finally you got the invite to this webinar because you bought Workspace Premium. I just wanted to quickly highlight what's in it for you, like buying Workspace Premium compared to like Workspace Basic. So currently the difference is that you have four times the cpu, so four times the processing power, four times the computation Speed and four times the RAM memory. So the working memory compared to the basic plan. On the basic plan we have 4 gigabytes of RAM and then half virtual CPU. It's slightly a technical concept because it's all cloud based. And then basically on the Workspace Premium plan you have 16 gigabytes of RAM and and you have four times the speed. So two virtual CPUs. So if you're working with larger payloads, if you don't like waiting, then basically Workspace Premium is for you. Other than that, we plan to add more premium features such as completely secure access to data stores through fixed IP so that you can for example connect to your company's SQL database without having to like through a fixed ip so that you can set the firewalls correctly to have extended version history. Again similar to Google Docs. But then for data science that you know, like who made changes to which documents when, that you never lose track of previous changes you made and you can easily roll back to previous changes. And then also very powerful feature that you can schedule workspace execution. So suppose you have a report that you want to run on a daily basis. You can basically set up a job for that and rerun this report every morning at 9am for example, so that this report is automatically updated without any user input. So that was a quick overview of what workspaces. But to show how this is actually how this actually feels or is working in for real, I suggest we head over to the code log so the code along steps. What we'll do first is we'll onboard onto Workspace if you haven't done that already. And then we will just do a quick discovery of the workspace dashboard, like what's the meaning of everything you're seeing there? Then we will start a workspace from a data set that we choose from a list. And then we will basically start working in that workspace to create a couple of beautiful visualizations. Once we're happy with that result, we'll create a publication from that workspace and that publication we will automatically feature on our datacamp profile. And that's also something I'll be showing. So if I can now open up datacamp. So I invite you all. So the name of this part of the presentation is Code Along. So I invite you all to basically join in coding along with me. So what you can do, if you land on the DataCamp dashboard, DataCamp Learn dashboard, you can basically head over to Workspace. In my case, I'm already logged into workspace. I already signed up for Workspace. I'm already active in workspace. It's pretty obvious because I've been working in workspace quite a long time. But this is basically what you see. If you have never embarked onto workspace, you will land on this page, the workspace landing page. You can just click on get started here, which will send you to the onboarding. You can skip that onboarding and in that case you will land on the workspace dashboards. So what we see on the workspace dashboard here is basically an overview of all our workspaces. So in my case there's like the unicorn companies workspace that is created by me. Then there's like something by Palazzi which is a workspace walkthrough that he shared with me. Then there's like a colleague of mine, Bart, who has created a workspace on Airbnb listings. So here we already see different workspaces created by different people but shared with me. I'm seeing actually an overview of all of these different projects on my workspace dashboards. Then on the left hand side we also see an overview of publications. So those are workspaces that have been turned into a publication and again are available to me. And then on the left hand side then we have data sets which is this overview of this curated list of data sets that I talked about before. So if you don't know where to start with your data science project, this is a good place to start. You can basically browse the data sets, see if there's a data set you're interested in analyzing and very easily get started with it. And this is actually, actually exactly what we'll do right now. So I'm just going to browse these data sets here and I'm going to select the unicorn companies data set. So I'm seeing that unicorn companies privately held company. I am seeing that there's like already some data preset for me. Very interesting. There's also already like some, some challenges for me that I can work out. That's all great. Let me. I'm actually interested in using this data set. Let me click Use data set here. All right, so this is basically starting up a workspace for me with everything already pre configured. So we see it here like Philip Sch. That's like my datacam profile name. I created a new workspace from this data set. I didn't have to worry about putting together the data like downloading the data set, uploading the data sets, cleaning it up, any of that stuff like data set just there available for me to Start coding. So I have a markdown cell here. So that's basically what we're seeing here is a notebook which is a combination of markdown cells and Python code cells. As such, you're basically telling a story with the data, right? So you use some English text or whatever your language is to describe what you plan on doing. You write some code, you interpret that code, or you interpret the output, you maybe write a bit more text. And that's as such, you're basically building up a research report of you digging through that data. So I'm actually interested, like if I look at this data set, I see the company names. I'm also seeing a category. I'm actually interested in showing. How many unicorns there are in each of these categories. So let me just quickly write some text. Like, this is just a quick analysis, like a quick analysis of unicorn companies and their prevalence in different sectors. So I just want to show like different sectors. Is there like a big difference in how many unicorns they produce, so to say? So first thing I'll do, I'll just do DF like this. So I store this data frame in a variable DF and I'm going to print it out again. All right, this looks good. So next thing I'm going to do is I'm actually going to get rid of that because I don't want to focus on these questions. I'm just going to click delete here, the source of the data set. I also don't mind too much, so let me get rid of that as well. And then I'm going to add some more codes. So I'm going to write some codes to basically do a grouped count of for every category. How many unicorns are there? So I'll create like accounts variable. I'll do df, I use the group by function and I'll group by category. Like this. Also zoom in a bit so it's slightly bigger. I'll zoom in like, I'll group by category and then I basically do the size call and I can then print out counts. And what do I see? I see indeed like category. There seems to be some cleanup that needs to happen. Maybe there's like a space here that why this is like not showing us as one category. There's also fintech. Fintech, like one time. Fintech is inappropriately written. That's something that we should be doing. But for the sake of this code long I won't basically, as a next step, I can now visualize these counts. So I use currents and I can Just use like the matplotlib plotting functionality. So I can use Counts Plots bar and I can immediately see that there is now a bar plots that is showing like the counts for every one of these categories. And we already clearly see that Fintech is clearly a sector where there's a lot of unicorns being produced. Like where there's a lot of companies that are worth more than a billion dollars even though they're privately held. So this looks good, but I don't really like this. And I'm also still missing a title. So I'm going to add like a title field here. But I'm actually not that good at writing titles so I feel like I'm going to invite somebody to basically make up the title for me. So I'm going to do like an add a title here so that the person I'm inviting knows that I would like to add a title. And I'm going to invite Samantha, which is a colleague of mine at Data Camp. I'm going to add her. And what you see here is that she's added as an editor. So Samantha will now get an email and she can open up this workspace, basically enter this workspace and make changes while I'm also making changes. I'll be waiting for her to join. And in the meantime I'll also add another plot because I don't really like the way this looks. I think there's more sexy visualization libraries out there I'm going to try. And we already see Samantha working here. Like she can make changes while I'm also making changes. So what I'm going to do in the meantime is I'm going to import Plotly which is like a better looking visualization library. Like overall by default you can get better like you can get better looking plots from the get go. I'll create a data frame counts because Plotly expects data frames, not discounts. Is a Panda series. So we have to convert that real quick. So create a data frame from that. Hello, Category counts, index number of companies, accounts values. This let me quickly check what the accounts looks like. Samantha finished the title. If I rerun it now, of course her title is showing on the plot. Thank you Samantha for making that change. If I then check DF count. So we have our data frame now and this data frame we can now plot as a bar plot inside Plotly I can create PX bar. First argument is the data frame with the counts for every category. I can do X is category. So that's basically on the horizontal axis. I want to show the category. And on the Y axis I want to show the number of companies. If I do this, this should open up a plotly plot for me. This takes slightly longer because there's an HTML and CSS and JavaScript that needs to load. So here we see an interactive plot. Now, like we can hover over these different blocks in the bar plot and we can see that of course it's showing the same data, right. This is nothing new, but it's arguably more interesting to look at. And it's automatically also adjusting to the width of the screen, et cetera. So I actually prefer this one. So I'm going to use the same title that Samantha added here, and I'm also going to add it here so that you also have a title here. Okay, this looks good. And actually for now, you know what, I'm going to comment this out because two plots of the same data is not really necessary. I don't want to remove it. Maybe I want to switch back to matplotlib. All right, cool. Suppose now that we're happy with the way this is looking and we are ready to publish this. So that's basically the next step. So I can go to share and I can click on publish. And what this is doing, it's rerunning my notebook from top to bottom, rerunning every Python cell, reproducing every output to make sure that the story from beginning to end, it makes sense, basically. So this finished. And if I click on this link, it will open up a new tab that shows like my workspace publication. So this is the publication created from my workspace. And this is optimized for reading. So this is easier for people to browse, easier for people to read. People can also leave comments here. I can also leave comments on my own work. This plot indeed is way better looking. For example, keep it. So you can comment on this. Again, similar to Google Docs and like other document tools where you can add comments. And this is a publication that I can just share, I can copy this link, include it in an email to whoever is interested, and then these people can visit this link and see this publication that you created. Also, by default, important to note is that anyone with the link automatically becomes a commenter of this workspace. So that means that they can, if they have the link, they can visit this. But you can control this. You can decide to make everybody a viewer so that they can only view it but not comment on it. You can also decide to disable access. In that case, nobody gets to see it. And it's only for your eyes only. Or you can also say everybody is an editor. So you can just say the whole wide world, everybody can edit my workspace and see my publication. For now, let's make everybody a viewer. Another option we see here is feature publication, my profile page. So what this is showing is actually my publication by default is listed on my datacam profile. So I'll open up my datacam profile here and what do I see? Indeed, there's this new publication, Unicorn Companies. And if I open this up, it will open up the same publication that I just showed to you. So because I've been working in a lot of workspaces in the past, I of course see like, there's already like a lot of thought of publications. But this is basically my public window into like my data science portfolio. This is me showing off all the things I did in workspace. And basically this is basically my LinkedIn of data. So to say. So this is basically what I wanted to show to you today. So just quickly reiterating what we did. We onboarded onto workspace. We discovered the workspace dashboards. We started a workspace from a data set. We wrote code to create some beautiful visualizations. We then created a publication from it. Now we featured the publication on our datacamp profile page. As such, building out a data science portfolio, that was it. I look forward to see what you all built with Workspace. I create feedback. So whenever there's something that you particularly like, maybe something that you dislike, you would like to see better, definitely reach out to me. I'm all ears. And I think right now we can open the floor for questions. And I see there are a couple of questions. So there's Jen, who asks whether workspace viewers or commenters, do they need the same subscription status as the person who created the workspace in the first place? So no, this is not necessary. So if somebody wants to. So if you're like a premium user, like you all are, because this was a code launch specifically for subscribed users, if you create a workspace and you share this with somebody else who does not have the workspace, premium subscription, they can just visit that workspace. They can just visit that publication. They can just view whatever you've been doing. So there's no limitation there. Then there's a question by Bill. Once a workspace is shared with someone, are you able to revoke the access to this workspace later? So basically the question is if I, in the case of me here inviting Samantha, is it possible to revoke access for her again? Yes, yes, definitely. This is possible. I can just click Remove here. It will kick Samantha out and Samantha will no longer have access. It's possible that for a couple of seconds, like while Samantha is still in the workspace, she'll still be able to do stuff, but rather quickly she'll be kicked out so that she can't make any changes anymore. She can't see any updates anymore. Then final question is, by sue, are you able to change permissions someone has for a workspace? So can you change somebody's permission from a commenter to an editor or vice versa? So, yes, this is possible. So I invited Samantha initially as an editor. It's perfectly fine. It's perfectly possible for me to just say, okay, Samantha, you've done enough editing, so to say it's time that you just became a viewer. I can perfectly do that and just click here and click on viewer. So far. Yeah. So these are all the questions that I had. Unless there's any other questions, then I suggest we wrap it up here. So this was just a very quick session to give you a brief overview of what workspace is, what it can do to you, why it's useful for you, and then doing a quick product demo of everything that's possible inside workspace. So, yeah, I suggest we wrap it up here, Ryan.
Thank you, Philip. Yep, we'll wrap it up. For those of you that joined us, we will be sending out a recording of this session within the next few days, so look out for that. And if you have any questions regarding workspace, you can reach out to our support team@supportdcamp.com thanks for joining.
All the best. Hi.
More from Richie

#359 My Best Friend is AI with Valerie Tiberius, Professor of Philosophy at University of Minnesota







How AI Agents Will Work While You Sleep | Ruslan Salakhutdinov, Professor at Carnegie Mellon

#358 How AI Agents Will Work While You Sleep | Ruslan Salakhutdinov, Professor at Carnegie Mellon

