DataChats | Episode 4 | An Interview With David Robinson, Data Scientist at Stack Overflow
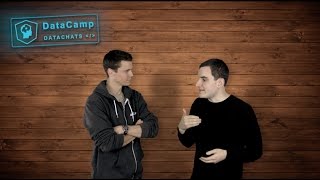
David Robinson, data scientist at Stack Overflow, explains how to build a career in data science through public work. Start a blog to share analyses and build a portfolio, use Twitter for feedback on visualizations, and publish R packages. Robinson credits his PhD in computational biology and work at Stack Overflow with teaching him that domain knowledge, SQL, and production-oriented thinking matter more than most curricula suggest.
Chapters
Hi, I'm Nick. I'm a Data Scientist at DataCamp, and I am here with Dave Robinson. Today, Dave and I just finished recording his new course. It's an exploratory data analysis case study course, which I'm really excited about. So welcome.
Thank you for having me.
So, I've got a few questions I wanted to ask Dave. I'm very excited to have him here. So, Dave, first off, I know you did your PhD at Princeton in computational biology, and you now work for a web company as a data scientist. You have a passion for statistics. You've developed some R packages. So there's a number of labels someone might apply to you. A statistician, a data scientist, a programmer or developer. I'm curious to know which of those you associate with the most and why.
So I identify strongly as a data scientist, and I think that I've really been a data scientist even while I was doing my PhD. It's been something that my passions have focused on. I think a lot of what happens in academics, science is data science is taking data sets, using programming to process them, and they're using statistics to draw conclusions from them in a rigorous way. So there's really this combination that is not similar to how a computer programmer or an engineer would just go about the jobs, nor is it similar to a statistician, but this blend that has its own set of tools, and I've been using them during my PhD, and that's one of the reasons that I felt rather comfortable stepping into a role at a web company. So, as I've said before, I think data science exists in both academics and industry. In academics, data scientists build things to answer questions, and in industry, data scientists answer questions to build things.
That's an interesting way of looking at it. So in a sense, associating with the statistician label or the developer label would be limiting. In a sense, it's actually data science is the thing that encompasses all of those things that I listed that you love.
Yeah, absolutely. But it also comes down to, I'd say statisticians. Statisticians will be better at statistics than me, developers better at software development, and it would be wrong to try and put myself in that category. I've seen a nice definition from someone else that was a data scientist is someone who is better at software engineering than any statistician and better at statistics than any developer.
Interesting. But there's a popular Venn diagram that actually shows a third component to a data scientist, which is domain knowledge.
Drew Conway's. Absolutely. So domain knowledge is something that's absolutely true. That is something you need to do. Good data science. So when I was in grad school, that involved building some biology knowledge. And since I joined Stack Overflow, that has evolved my knowledge of the business and of the community on the site. And one of the advantages I had there is I spent a very long time answering questions on Stack Overflow and I've been a lover of the community for a while, so that did give me that advantage.
Yeah, that's interesting. So there's a famous quote, and I'm blanking on who said it. The great thing about being a statistician is you get to play in everyone's backyard.
I think that might have been Tukey.
John Tukey. So maybe the modern, the modern alternative is the great thing about being a data scientist is you get to play in anyone's backyard. But to do a good job, you have to invest the time in learning the domain that you're working in, right?
Yeah, I absolutely think so. And I think that's what separates some of the greatest data scientists from others who might still be experts. But people that get the most done are usually the ones that really appreciate and spend time to understand the area they're applying it to.
Yeah, okay, cool. So another one of your passions is writing, which is obvious to anyone that is fortunate enough to stumble upon your blog. Variants explained. How did you get started with writing? When did you realize it is something you really enjoyed? And at what point did you decide to start your own blog? What was the origin of that?
Yeah, well, so I started my blog in the last year of my PhD, so it would have been fall 2014. And at that point, to me, it kind of grew out of my interest in teaching and my interest in education. I really had enjoyed teaching these R courses and teaching statistics to undergraduates and graduate students. And I realized that while a course is the perfect vehicle for a lot of education, a blog post can as well. One of my first blog posts was about how to interpret a P value histogram. That was something that I understood and everyone in my lab understood, but I realized most people didn't. And it would be productive to have a way that I could spread that knowledge and let everyone know it. I also, at the time, since I was about to enter the job market, I think of writing a blog as a really great way just to get. Just to get. It's a great way to spread my name and have people be familiar with some of the work that I can do outside of just the resume and so those were some of the reasons I started and I've really. And after the first few posts, some on data science education and others on analyses of various data sets, I found interesting. I really just started enjoying that process.
Very good, very good. My screensaver went up here, so I'm just going to jump out of the frame for a second. So that's really interesting. So a lot of people talk about the importance of building a portfolio as a data scientist, and often the way someone will encourage you to do that is to Maybe start a GitHub repository, start tracking your analyses in R markdown documents and posting those on GitHub, fiddling around with other people's packages. But I haven't really heard people talk about creating blogs as a way to position yourself well for entering the job market. What advice would you have for somebody who wants to start their own blog? Like, where do you get started? What do you write about? Especially if you're just getting started with.
Data science, I think one of the most. So if you're. For someone who's experienced in data science, I would say starting a blog, I would say, what are you an expert in that you don't even realize you're an expert in what knowledge are you walking around with that not many people have? And anyone who gets a little experience will have these areas. And that's a great opportunity for teaching and communication for people that are starting. I'd say one of the reasons I built this course this way, in this exploratory data analysis is you can learn so much by diving into a data set and finding things out from it. So I would say to anyone who's starting out, pick a data set that's interesting to you, learn some cool things from it, and then post your analysis that is not just good for your portfolio, it's good for your analysis skill and it's good for the skill of communicating your analyses, which you have to do whether they're public or private.
Yeah. And it's a great way to get feedback on your work, right?
Oh, absolutely. Yeah.
If you're not putting it out there for the world to see, then you might be missing out on some. On some good insights, some good feedback, opportunities to improve.
It's sad to me, I think, how many statisticians and analysts fill their hard drive with these really cool analyses and graphs and never think to share it. I'm also a big fan of Twitter, which is a really easy way to make one interesting graph and share it without writing an entire post.
Yeah, now you're Big into the Twitter game.
Yeah, there's a lot of fantastic data scientists on Twitter. And I think actually Twitter was, even before I started my blog, how I was able to start getting involved in the data science community.
Say more on that. For somebody who wants to start creating a better awareness of what's happening in the R community or the data science community, how can they use Twitter as a tool for accomplishing that?
Yeah, I'd start by following people that are influential data scientists. For me, that's largely the data science in the R sphere. So that includes Hadley Wickham, Hillary Parker, Jeff Leak, Roger Peng. There's a lot of people that I follow and retweet and am interested in, and by reading through them, you can see a lot of things that people are working on and see a lot about communication from these really great communicators. In my case, my involvement with Twitter really started when I released the broom package, which is discussed in this course for tidying model outputs. So after I released it, I tweeted about it and included Hadley Wickham, and that was how I started my professional relationship with him and how he and him, by retweeting it, kind of shared that. And that really, that was a way that after writing something and releasing something, I was able to get people to notice it and start giving feedback and start entering that into the larger data science community.
Interesting. So it definitely accelerated the feedback loop for you, which is extremely important when you're writing a new piece of software.
Yeah. I know other data scientists that have gotten started in that in a similar way, starting with blogging and Twitter.
Okay, great. So at datacamp, our focus is trying to prepare people for doing data science in the wild. We want to teach practical skills. And so I guess, like, from your perspective, now that you are a practicing data scientist, you're out in the wild. What sorts of things have you been forced to learn on the job or willingly learned on the job that you wish you had been exposed to earlier on, maybe when you were studying at university?
One of the biggest differences is I really hadn't appreciated a lot of business terminology and how much it ends up impacting the role of a data scientist, such as product knowledge, driving whether things drive decisions, actually appreciating the impact of particular.
So the domain knowledge that we were talking about.
Absolutely. But there's kinds of domain knowledge that I think apply to the entire industry that academia can be shielded from. So one example would just be working with hard deadlines and the idea of getting analysis done and moving on. In one month rather than spending a long period of time making it perfect for a paper. There were habits that I kind of had to unlearn between the publication cycle and the work cycle. And blogging was a good way to get into that a little earlier to get used to releasing iterative results. Another would just be. Another would be understanding impact. So it can be easy in statistics to spend a lot of work getting a mathematical model exactly right and not really thinking about how right does it have to be and not really thinking of, for example, when I would say the difference between particular kinds of models, a linear model, a generalized linear model, between some simple ones and sophisticated ones, getting a really candid understanding of when you can use a simple one and it gets you most of the results. It becomes especially important once models start being used in production. And more complicated models might be readier to fail and might be hard to communicate with people that develop them. And there are these other costs. These were things that I really started to appreciate once I started in industry. I think it's hard to teach these things in a course environment rather than in experience. And one of the things I tried to get across in this course is how using even a very simple mathematical model can still. You can still dive in to get exactly the insights that you're looking for.
Sure, sure. Okay, so maybe a related question is more broadly, like, as you look at the educational system and the sorts of things that future data scientists are learning in a university setting, what do you think we could be doing about Better to prepare would be data scientists for. Let's just call it the wild.
One of the big ones that immediately pops to mind, and it's kind of emblematic of some of the issues of data science education is SQL. So SQL is something that almost no PhDs in any field besides computer science end up building skills in. But it is absolutely required for a majority of data scientists. People that work at a web company are going to need to engage with the database and get information out of it. That's true. Even if they're not using big data technologies, even just a traditional SQL database, data scientists will spend time writing it and getting knowledge out of it. And I think it really is emblematic because it's something that lies at the border between computer science and statistics. People that are computer science students would probably learn in the process of database administration and building websites. But it's something the particular combination where almost all of my time, or really a lot of my time, is working with data that I got from a SQL table So understanding how to get it out in the form that is best for me is an important part of my job. So it's really interesting that people just that a lot of programs don't look at it. And I was very lucky that in my undergraduate and graduate career, which was mostly in statistics and biology, I did spend a lot of my extra time building, learning to build websites and work with. So I'd already be. And I'd already kind of become familiar with SQL almost by accident. Something that most of my colleagues. It's not something I would have picked up from my colleagues and I think that's one of the things I would name.
Yeah, okay, that's good. Very interesting. So it's clearly a very exciting time to be in data science. I think it's a very exciting time in the R community as well. A lot of things are changing very rapidly. What trends are you most excited about?
Personally, I think I can think of, I'll say two really important ones. One is the open source R community. I think this has been going on for decades with the use of, with cran, the central repository of R packages. But I've really noticed in the last few years a trend towards more people creating more scientists creating their own R packages for analyses. Part of what contributed to it is GitHub where people can. Anyone can put up a package without having to go through the CRAN review process even while it's in development. And similarly the DevTools package which allows someone to install a package from GitHub. This is something that I really only started making packages in the last two years. And I think that's true of a lot of people. And I often tell, I tell people that are involved, our users to start writing their own because it's such an important way to get your own tools to spread and become useful to a lot of people. The other is the tidyverse. So this kind of set of philosophically related packages, starting with some of Hadley Wickham's packages such as dplyr, ggplot2 and tidyr, that have become really powerful and have started being released in these last couple of years. So these packages kind of all work together in this way to get these analysis, to do an analysis with tools that I think the way Hadley refers to it is they are high quality tools but more importantly the glue between them is the ways to connect from one to the other are they're designed to work with each other and to be very easy and that really helps get into a good analysis flow. The thing that excites me is we're still very early in that ecosystem's development. I think we're at a state where it's still just starting to ramp up. Even this year has seen a lot of interesting tools for tidy data. One interesting1 is tidytext package that Julia Silge and I wrote together for doing text mining using tidy tools such as dplyr and ggplatteau.
Mm, okay, very interesting. So maybe I think there are a lot of people out there who still are not familiar with the so called tidyverse or. And I'm sure there's plenty of people out there who are skeptical of it, who may know of it, but are skeptical of it. Why should somebody invest the time to learn these packages when they already know how to program nr?
I think that investment is in your own programming skills, just pays off exponentially. It doesn't just pay off in the analyses you can do today, it pays off the next analysis you'll do and the one after that. And that's especially true when they're tools that help you learn faster, that help you think about your data faster, because they're tools that can get out of your way. I think R is a great language and there are a lot of fantastic tools in Basar, but I've noticed an acceleration as I move to this set of tools that has been really exciting. And that acceleration is, is always worth an initial investment. And one of the reasons I created this course, which is really centered around four tidyverse packages, ggplot2, dplyr, tidyr, and my own broom package, is to make this learning curve as easy as possible. I think this course will definitely be useful to new data scientists, but I also think it'll be useful to people that have a lot of our experience but want to see how these tools can be used to work together.
Okay, interesting. So from my own personal experience, one of the reasons I enjoy using dplyr and tidyr together is they actually help me think about what I'm trying to do more clearly. So they not only are useful tools for carrying out an analysis I already have in my mind, but they help me restructure the way that I'm thinking about a problem and they force me to break it down into small, simple steps. And I think that's very powerful when you can have code, when the code actually helps improve your thinking about an analysis, when it's not just a passive tool that's there at your disposal, but it's something that actually enhances your thinking about a problem.
I absolutely agree. I think the two most famous examples of that are ggplot2's grammar of graphics and dplyr's constrained grammar of verbs. So the grammar of graphics didn't start with ggplot2. It started with Wilkerson's book the Grammar of graphics and Wickham's 2010 paper. And what it really lays out is a way of thinking about the relationship between your data and your plot. So it may take a little bit more code to make ggplot2 than to call a function called plot and just create something, but by allowing you to think about the relationship between your data and the graph, and therefore between the way you're going to take your data and turn it into understanding on the viewer's part is really powerful. I think the same thing about dplyr's constrained grammar, where the idea is to have one way to do each type of operation, one way to filter your observations, the filter verb, one way to add new variables, the mutate verb, and one way to connect them together, the pipe. So while that can be a bit restrictive, and there are certainly times where it's worth stepping out of, by always thinking of things in terms of these steps, you get to fit a lot in your mind. You get to think a lot about what are the steps I'm going to need to run into. And it really helps take you away from the syntax and the programming questions, how to make this loop or how to get the code to do what you want. And really more into the critical thinking of what do I need my data to do?
That's good stuff. Cool. So a lot of the people who will be watching this are new to data science, they're new to R, and new to the tidyverse. What advice do you have for people who are just getting started besides taking your course?
Well, I think we hit on it earlier and it's advice I always give to new data scientists, which is create public artifacts. That is when you do an analysis or when you do a. Or when you write some code for yourself, see what you can do to communicate it to the world. I mentioned blogging, and I'm a big fan of blogging. And writing practice is also a really important skill. So I just recommend create some blogs. When they start out, they might be. You might feel awkward or uncomfortable working with them, but you will prove that. And the only way to do that is to start publishing them. I feel the same way about R packages, which are also really good to get you thinking about how to write code that's not just used by you but is used by others and people that say they're not ready to start writing R packages. I found that people, even people that are very early on in their R experience can learn to create an R package. There's a terrific book by Hadley Wickham called R Packages that's a good guide to this and once they do that it really helps accelerate their experience. So it's good for practice and it's good for writing, it's good for practice of programming and it's a good way to start getting your name out there and building a portfolio for finding a job. So that would be I think definitely creating public work and as I mentioned earlier, picking an interesting data set, finding some things out from it and then publishing the results are what I'd recommend.
Okay, very good. I think that's all the time we've got Nick. I appreciate it.
I'm very excited about the course meter.
More from Richie

#359 My Best Friend is AI with Valerie Tiberius, Professor of Philosophy at University of Minnesota







How AI Agents Will Work While You Sleep | Ruslan Salakhutdinov, Professor at Carnegie Mellon

#358 How AI Agents Will Work While You Sleep | Ruslan Salakhutdinov, Professor at Carnegie Mellon

