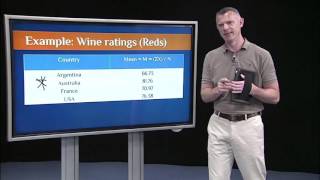
An instructor uses random ratings of eight wines from 100 experts to teach how to calculate the mean. The formula is simple: sum all ratings and divide by the number of observations. Australian Shiraz leads among reds in this sample, while US Riesling edges out the whites.
Chapters
Now, remember we had this example from the last lecture where we had 100 wine experts rate the overall quality of eight different wines, four red wines, four white wines. And again, higher scores indicated higher quality. Now, we might want to ask, well, which country had the highest overall wine rating? That was important to us. As we were doing this, we wanted to see how this would come out. And just for the record, to be clear, we did this completely randomly. So my assistant David, who is from France, and I, to be fair, we just said, let's generate this completely randomly so that we're not biased and so that we don't insult people around the world. A funny thing happened. David actually did this. He generated random numbers. He came back to my office with a really sad look on his face, and he said, france lost. Did we really have to do this randomly? And I said, yes, we do have to do this randomly. So let's look at the overall rankings, if we just want to look at the average. And let's just stick with the reds for now. Here are the means that we calculated from the data that we generated. So the mean for the Argentinian Malbec was 66.73. The mean for the Australian Shiraz was 81.76. The mean for the French red, I forget what the French red was, was 70.97. And for USA, it was a cabernet, it was 76.38. So in this simulation, Australia one. Okay, again, this is completely random. We did not fix this. But how do we calculate the mean? And hopefully this is review to you. But again, this is supposed to be an introduction, very first course in statistics. So if you're not familiar, the way we did this is we plugged the numbers into R. But if we wanted to do this by hand, all we would have to do is take all the ratings from the 100 wine experts, just put them in a column, sum that entire column, and then divide the sum by the number of ratings. So that's the formula right here. So it's the formula for the mean or average. It's just the sum of all the scores divided by the number of scores. Okay, so just sum of X over N is the mean. And these are the means for the red wines across those four countries. Now, let's consider the white wine. So which country won with respect to the whites? Again, this was totally random. I didn't bias this, even though I had a favorite in the race and that favorite won. So the us, the Rieslings from upstate New York, the cameraman's waving Yay. Again, this was not, this was not biased. This was totally random. Just slightly one. Right. So it just slightly beat out Australia and France for the overall average ranking. But again, let's get back to the topic of this. This segment, it's measures of central tendency. The mean or average is the most popular measure of central tendency. It's a very common summary statistic. I think most of you are familiar with it.