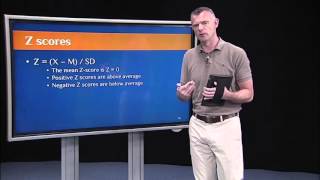
Richard Cotton explains scales of measurement and z-scores in statistics. The z-score formula is z = (x - mean)/SD, and z-scores always have a mean of 0. A body temperature of 99.6°F with mean 98.6°F and standard deviation 0.5°F converts to a z-score of +2.
Chapters
I've sort of been emphasizing how important it is to know what type of variable you're dealing with and emphasizing how important it is to look at your distributions in your variables. It's also really important to keep in mind what scale of measurement you're dealing with. So for all those histograms, I presented the histograms first in degrees Fahrenheit, then in degrees Celsius. Those are just two different scales of measurement to measure temperature, right? So I think we're all used to dealing with scales of measurement, but in statistics, what's nice is there's a standard scale and it's called the Z scale. So any score from any scale can be converted into a Z scale with Z scores. And this allows for really efficient communication across statisticians. Scientists can share data, different researchers can share data. If everything's converted to a Z scale, it's very easy to interpret, and it's very simple calculation. How do we convert what I'll call a raw score to a Z score? It's just this formula right here. We just take the raw score, that's x, subtract the mean M, and divide by the standard deviation. So we'll just take the raw score, subtract the mean, divide by the standard deviation. That gives us a Z score. And if we do that for every score in a distribution, then we can put our distribution on this common metric, the Z scale. So what's also nice about a Z scale or Z scores is the mean Z score in any one sample is always going to be zero, right? So I take the raw score, subtract the mean. If my raw score is the mean. So say body temperature. The average body temperature in Fahrenheit is 98.6. So 98.6 minus the mean. Assuming a normal distribution, 98.6 minus 98.6 would be zero. Divided by whatever the standard deviation is would give me zero. So the mean in any Z score distribution is going to be zero. What's nice about that is if you have a negative Z score, then I know your score is below average. And if you have a positive Z score, then I know you're above average. So again, let's look at this body temperature distribution. Here it is again in degrees Fahrenheit, it's this nice normal distribution. Here it is again in Celsius. Again, nice normal distribution. Here it is in terms of Z scores. Again, we did this in R and R did the breaks a little bit differently for this graph, but it's still a nice normal distribution and most importantly the average is zero. So the average body temperature in terms of z scores is 0. These are the same exact numbers. From histogram to histogram to histogram it's just in degrees Fahrenheit, degrees Celsius or in Z scores it's the same exact numbers. We just converted them. Direct conversion. So just to be clear, let's assume we have a normal distribution of healthy individuals where the mean body temperature is 98.6 degrees Fahrenheit and the standard deviation is about a half a degree. So 0.5. Suppose I pick one individual from that distribution at random and that individual's body temperature is 99.6 degrees. Now I want to convert that raw score, that x 99.6 to a z score. Well, all I have to do is apply this Z formula. I take the raw score 99.6, subtract out the mean 98.6, divide by the standard deviation which was 0.5. So that's just 1 over 0.5 or 2. So this individual Z score is positive 2.