Introduction to Claude
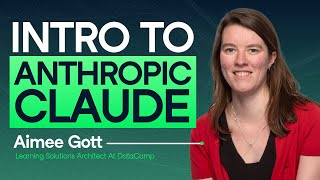
Amy from Anthropic walks through Claude for data analysis, showing how to upload datasets, generate interactive React visualizations with the Artifacts feature, and run statistical analyses on e-commerce product ratings. She covers practical tips like breaking prompts into chunks to avoid hallucinations, and warns that Claude can't execute code or handle proprietary data securely.
Chapters
Hi everyone, I'm Amy, I'm a learning solutions architect at datacamp and today I'm going to give you an introduction to Claude. So I'm just going to start off sharing my screen for you just to give you a quick introduction. We are going to jump into Claude and try it out. But first of all I just wanted to give you a brief introduction to what we're going to do today and what code is itself. Before we get started we are going to do a code along, a prompt along. I guess today we're going to have a look at some data that I actually simulated using code and I'll get to where you can find the code for that simulation in a little while but we are going to look at some data on product ratings for well a non existent e commerce platform. So that's the data that we are going to work with. The main goal today is to show you how you can use Chord to support data analysis tasks, but also really want to look at Chord artifacts and how you can use those to take your analysis that step further or just your general day to day working. So they're our primary goals for today. Before we get into Quad itself, and I will just say before I keep talking, you will need a Claude account if you want to follow along. Today I'll be using a paid account which I'll go into in a few moments as to why, but you should be able to follow along today with just a free account. So if you go to Claude AI and sign up while I'm talking a little bit, you should be able to follow along with what we're doing. So what is called and why use it? Well, I'm not going to go extensively into the background on Claude, but Chord at a high level is a generative AI assistant, very similar to Chat GPT. I'm sure you've all seen heard used Chat GPT before. Claude is another example of that sort of chat like interface. It's been developed by Anthropic and Anthropic is a company that was founded by a group of people who originally came from OpenAI and their goal with Claude was to build in responsible AI right from the start. We have lots of articles on our blog on what Quad is how to to compare to ChatGPT, lots of things like that. So I won't go into all of the details but you can find lots and lots of articles on how it compares to ChatGPT. I'm sure if you're, if you're here today you maybe have looked into some of those comparisons. But I think that the bottom line to say is that Chord's 3.5 sonnet model is has been proven to perform better than the latest GPT models. So on paper it seems like it's possibly a better tool. And today we're going to have a look at some of the benefits to using Claude and why it stands out. In particular, the feature that I really find quite interesting about Claude that I'm going to try and show you today is the Artifacts feature. Artifacts. I've got a couple of examples here and we're going to try and recreate these today. But artifacts are essentially pieces or snippets of things that you can take out of Chord. You can use that stand separate to the conversation. And this is a really interesting use case. What you're going to see is that we can start to create interactive tools that we can work with as part of our workflow. So with that I am going to jump straight into Chord at this point. Just a few things to mention. As I said, you will need an account with Claude to follow along. Today I'm using a paired account of Claude and the primary reason for that is that when I have been testing Claude there are usage limits to the free accounts as you would expect, as there are with a lot of these tools. And. And unfortunately I found that I run ran into those quite quickly, especially at peak times of day. So I'm using a paid plan here to make sure that hopefully we don't run into those issues. The good thing is that gives me a few extra features as well that I can show you today. It shouldn't impact if you don't have them, but I will show you those as well. We're also going to have a look at the Artifacts feature and you will need to turn that on. I'm trying to talk to make sure everyone's got a chance to open this up, but I will just show you briefly how to turn on that Artifacts feature from your home screen here. If you go across to the side, you'll get this side navigation come up and if I click down here at the bottom we've got this feature preview option. If I go into this feature preview option it will tell me about upcoming features of which artifacts is one of those. If you haven't yet turned this on, you can do so down here with this toggle. I've already got it switched on so I'm not going to touch that again. So but that's going to give us that ability to create those artifacts and you can even do this with a free account, so you don't need to pay extra to try this feature out. Just be aware that if you are on a free account, you may reach a point today that you can't run any more prompts or that it becomes too busy, especially because I'm sure there's lots of us going to be doing this all at once. So this is the interface to Chord. If you've not used it before, it's relatively straightforward when you get started and you've got your usual prompt here at the top. And I want to get started showing you some of the features of Claude. And I've put together in a Data Lab workbook a whole series of prompts that we are going to start with as the basis for today. ADELE has shared the links to these resources with you, so hopefully you're able to make a copy of this workbook inside here. You'll see that information there on turning on that Artifacts feature. And lower down, we've got some of the prompts that we're going to start with. I have run through all of these prior to this session, but obviously Chord, as with all other generative AI tools, is not necessarily going to give me exactly the same output as I got previously. So we may adapt some of these as we go along, but you have them there as a starting point so that you can see what we created. If you open up the files in the workbook as well, you'll find a whole bunch of extra files here. As I said, I have run this before, so I've included there for you some of those outputs so you can see what these generated previously. I've also included here the. The data that we're going to use and a couple of files that we're going to work with as well. So I'll highlight when we're going to work with some of these, but hopefully everything that you need for today is included in here. So before we jump into data analysis, I'm going to start with just some general examples of what Claude is able to do. One of the features that I quite like about Claude is being able to upload a bunch of documents and generate summaries of those documents. We're going to do that first. Before I started my role as a learning solutions architect at Data Camp, I was on the certification team. What better to try and summarize than one of the documents on certification? So you should have that file here in the files if you want to grab that. And I'm just going to also Grab this first document summary prompt. So going back across to quad here, all I need to do at this point is add my prompt into this window. So I'm just going to paste in the prompt that I have added. What have I asked of code? I've asked it to create an interactive page that summarizes all the areas I need to study to pass the Data Camp Data Analyst certification as described in the attached PDF. I'm not asking it to go to the Internet and find this. I'm actually going to upload it with that. I actually do need to upload the file. Uh, so just underneath here you can see I've got this option to add content. Uh, I've just saved this file onto my desktop so I can quickly get to that. Uh, but that is there. And if I now ask Claude to, to go away and do this, it's going to generate for me not just a text summary of this document, but actually an interactive tool. You can see from the prompt that it's returned. It's using REACT to create this and it's writing all of that code across to the right hand side here. This is where it's generating one of these artifacts so that I can now start to play around with this. It has generated my artifact. You might be a little disappointed here. And this is one of the downsides that I've noticed with Claude. All of the information tells you about how sophisticated this is. I think sometimes it's trying to be too sophisticated and I find often that I don't have the libraries or tools that it's wanting to use. The good thing is though, I can take this error message, let's copy this whole thing and paste it into coord and it will now go away. It's going to apologize to me and correct that output so that hopefully this time I'll actually be able to see this tool that it's creating. Okay, cool. What it's created for me here is a nice little interactive widget. I can actually click on some of these and see lots of information. As I said, this is actually creating unique content each time it runs. So this is actually very different to what I created. When I've previously run this, it's actually given me extra information this time. It's decided this time that I want to see the exam format. But it's also included in some tabs here, some nice little dropdowns where I can start to see here are the things that I need to study for for this certification and I can completely interact with this. Now this is a very simple summary that I've asked it to do. There's nothing particularly difficult about this in terms of the content. It's taken a document and it shortened it for me. But this gives you a flavor for just a fraction of what you can start to do with Claude. I could start to style this in any way I want or to make it look and feel the way that I want. And what's really cool is that I can actually publish this as well. I won't publish this right at this moment in time, but if I wanted to I could publish this and share this link with all of you so that you could then share this and start to use it yourself. So it's a really, really nice feature. Alternatively, if I wanted to include this somewhere else, I can actually just flick back and see the code. I could grab this code and put it into. If I wanted to include this in a web page somewhere else, I could. Some really, really nice features that Claude gives there. I'm going to have a go at a few more here to show you, so I'm going to go back to the homepage. I'm not going to keep asking Claude questions about different topics in that same conversation for a few reasons. One, it. It's just a good practice in any tool like this to. To keep conversation separate so that it doesn't start to. To get confused or hallucinate or anything like that. But also with Claude, it's worth bearing in mind I mentioned hitting those limits of how much you can prompt. Claude does send a whole conversation to the model to generate the output. So if your conversation gets very long, you're obviously sending a lot more and you're more likely to hit those limits. So where you can keeping them shorter is likely going to help you document summary. One nice thing that you can do. Another feature that was was new for me when I saw this was the idea of being able to create diagrams with Chord. So talking to you today about data analysis I thought well, let's try and create a diagram of the data analysis workflow. So that is what I'm asking Claude to do here. And you'll notice I haven't. I'm just going to get that started. I haven't actually asked Claude record to include specific steps. I haven't told it what the analysis workflow is. It's going away and it's going to do that for me. And the diagram there on the right hand side is what it's created. So this is really cool. It's not only telling me all the different steps of the analysis process, but it has created that graphic as well. You might notice if you compare this. This is the, the example I had in the slide just a moment a few moments ago. If I jump back across there, you'll. You might notice if I zoom in a little here, it's a slightly different diagram to what got created previously, but roughly the same information there. So you'll see here it included some colored borders and we can do that if we want in this flow too. There's lots more information. It's also returning for me. But I want to move on to show you something a little bit more sophisticated with these artifacts with Claude. And what I want to show you here is something that I've picked out that is a really interesting use case for me that goes back to when I started to learn statistics and then teach statistics. So one of the things I often did when I was both learning stats and teaching stats was create statistical distributions. And I numerous times created tools and widgets and interactive graphics to allow learners that I was teaching to interact with distributions and see how things change. That's taken many, many hours of my time. Of course, I was going to give this a try in CLAUDE to see what it does. I'm going to start running that and then I'll start to talk you through what I'm doing. It's essentially going to create a react component here. But I've asked Claude here to create me a tool to investigate statistical distributions. I'm being very specific then about what I want. I want a dropdown menu to select a distrib and I want a slider to select the amount of simulated data. I've given it very specific information about the range and what's going to happen after selecting values. I want it to draw a histogram of that simulated data and I want to see the mean and variance of that simulated data. So these are things that if you are new to stats, you might want to try out. And I've told it select four common distributions. I haven't told it what distributions to pick. And this, it is what it's just typically, just as I went to that, this is what it's creating for me. And this is exactly that tool that I've asked it to create. So I've got the option to pick from various distributions here. I've got the option then to slide across samples. I'm not sure why this is deciding not to run today, but you can see. Let's see if I can bring up one. I made earlier. You can see it's giving me exactly what I asked for there. So that distribution plotted as a histogram and underneath that the mean and variance. So this is something that, as I said, I've spent many, many hours creating these tools for teaching purposes. And with Claude, with one paragraph of text, I've been able to recreate that whole thing in just a few lines. So these are the artifacts that you can create and you can hopefully start to see that there's a lot of things that you can start to do here to improve your, your workflow. So for me, if I was teaching on stats, I could save a huge amount of time by just getting Claude to create this tool for me now. So that's sort of just generally I could spend a whole hour just talking through the cool things you can do with artifacts and, and definitely have a play around with this. It's a lot of fun to, to see what you can get it to do. But I wanted to, to talk about data analysis and how we can use Claude as part of our data analysis workflow. So just to give you an idea before we jump in, this might look a little familiar. It's actually a diagram created by Claude. And to create this diagram, I asked Claude how could it create a diagram that showed how Claude could support the data analysis workflow. And this is what it created for me. And I think this is a really good summary of how Chord is going to be able to help and that is in assisting in all of these different phases of the analysis workflow, whether that is cleaning your data, suggesting visualizations, or right down to the end interpreting and reporting. And what I want to do today is just show you a few of these and how CLAUDE is able to help with, with your analysis. With that, I'm gonna jump to a feature in Claude that is available with the paid plans. This isn't available on the free plans, but. But I just wanted to show you this because I think it's a really nice way of working, something that I particularly enjoyed as I was putting this together. And that's this idea of a project. So a project is a way within code to collect a whole series of files, chats, documents, anything related to a single topic so that you can very easily reference information, set code up to work in a particular way, and just continue a piece of work from something you've already done. I've already set one up here, so I'm going to show you what this looks like, but you can set up a project quite quickly if you've got that paid account and what you can see here is the option I have to start a conversation and that's within this project. So within this project it then has all of the, the context of all of the files that I have connected to this. So what I've done here on the right hand side, I've actually uploaded some files already. In this case I've uploaded the data. I'll come back to that in a second. I've given it the data dictionary. I've already pre uploaded some analysis that I've already done. But what is most interesting is that you can set these instructions for a project. So with any generative AI tool you'll find that it works much better and gives you what you want if you give it very specific context to the situation it should put itself in and how you want it to respond. And that's what you can do with these instructions for a project. So rather than having to repeat that in every conversation, I can set that for for all the conversations I have in this particular project. So in this case I've told Cord that it's a data analyst, an E commerce company and investigating what drives customer ratings. I've told it that I want to be using Python. Excuse me, that I'm working in a notebook environment and if it can it should create graphics using Plotly. This was really important for some of what I found. So for instance, telling it to use Python in a notebook environment because what I found when I was running this without that information was that it assumes you're using a non interactive version of Python and will save files and things like that. So this just helps to make sure that it doesn't save files to a separate location. So that was just a little tip that I found after repeating this so many times. Setting it in the instructions really helped all the. Sometimes it does choose to ignore it for you as well. It also helps in here that I've been able to define the data dictionary and with that I'll just talk you through very briefly this data set. So the data set, as I mentioned right at the start I actually generated with Claude. I asked it to simulate some data that would be interesting for a session like this and it came up with this data and the columns. I was then able to give it more information. So I've told it what relationships I want the data to have today to make that easier for us. I even told it to incorporate some common data issues and it did that without me giving it any extra information. So it has included missing values throughout Some of these columns, as we're going to see in a moment. In this example, I've also uploaded the data, but what I did find with doing that was that it didn't necessarily always help in this case because Claude would tend to put in information just randomly from this data without it actually being correct. So it's not able to run Python code. So it seems like it's giving you correct information. It seems reasonable on the surface, but underneath it wasn't. So actually I found the data dictionary approach was much more useful here. So let's have a go at some data analysis. I have included in this workbook the data dictionary there for you. If you are not able to use a project, you probably want to provide this as your first prompt to tell Claude what your data looks like. But I've already done that, so I'm going to jump down to this first prompt. So what I'm doing here is I'm asking Claude to write a Python script to do that first step in the analysis. So the first step, and I'll just get that started running the first step in the data analysis flow that it said was that it could help us process our data. And that's what I'm doing here. In this particular prompt, I'm asking Claude to create a Python script to verify the columns match the data in the data dictionary. I've already given it the data dictionary and it's going to go away and write Python code for me. I've then asked it to perform a certain series of tasks. Again, as I mentioned, being very specific is going to help you out here a lot. What I found if I just said validate this data, was that it created a very impressive looking widget that showed me ticks next to all the columns and said everything was correct, but it hadn't actually verified my data. So I'm being very specific with what I want. Confirm that it matches the descriptions, identify missing values, and then return information that it either matches or doesn't the artifact it's generated. For me here is a very extensive Python script. Just to show you this working. I'm going to copy this and I'm going to drop it here into Data Lab. I've already got this set up, it's got my data in there. If you've copied this, you should be able to do that yourself. You'll notice this is a very, very long section of Python code, but it's reading in that data for us and it's going through a whole series of tasks here. What I found Very impressive about this is it's actually taken on board all of that information that I've provided in the data dictionary and it's giving me checks here that actually make sense. Sense. So it's checking the age range. The. The range, sorry, of the age variable. So we've got that checks from 18 to. To 80. It's identified that there's 49 missing values. It's. It's even telling me that the values are in a sensible range. It's picked out that in the. The gender and country. So these were two categorical variables. The data dictionary includes what they should be and it's actually checked that they match those categories. So it's actually gone through in this case and done what I wanted it to do. This is really, really nice that it's done that. And now from that I can start to go through and tell it to do some more steps. What I found, if I just asked it to validate my data, was again, it would just make certain assumptions that I wanted to impute all of my missing values or remove them all. So it wasn't actually doing necessarily the. The right thing or what made sense, but it was just taking that entire action. So I definitely recommend breaking this down into smaller pieces and guiding it a little bit more through what you want. So in this first step, as you can see, there were missing values and I want it maybe to do different things depending on what the variable is. And that's what I'm going to do next. I'm going to carry on this conversation with Claude and I'm now going to ask it to create a script to do that missing data analysis for me. So again, it's generating some Python code and I've now got a couple of different scripts that are being saved over here. I'm not going into the detail as I'm talking, but you'll notice it is giving me a lot of information. It's telling me how to work with this file to make sure that it does what I want and what it's going to tell me coming out of it. So it's a very extensive output that it's given. And again, if I move across to Data Lab, these are quite long scripts, so apologies that if you're not able to keep track of what's going on here, they are all included in one of the other workbooks for you, but it's gone through here and calculated where there are missing values and done the actions that I asked. There are some interesting things to this. For instance, if you look at the detail you'll notice that it says there are zero missing age values. It did the same thing previously when I was doing this. And if you look, it actually counts the missing values after it's already removed them. So there are some oddities in the way it does this. If you ask it to correct that, it will go through and give you that updated code. I think what I noticed here is that it's not going to be able to give you completely perfect output the first time, but so long as you break that down and look very carefully at what output it is giving you, there's a really nice set of information that it's giving and I found this really nice to work with. We've cleaned our data, it's even saved it for me in a file called pre processed data. So now I can carry on. And it told me that I could use Chord for exploratory analysis. So let's have a go at that. I am going to go back to my project and start another conversation with Claude here. And that's as I said, it's just much easier to work with Chord in these smaller chunks so that it doesn't get distracted by the previous things that you might have asked it. I'm going to get that running again. But here I'm now starting to go into the actual exploratory analysis. So at this point I know that I want to investigate rating and all the other variables in the data, so I'm asking it to create visualizations, create summary statistics. I've asked it to generically create means, medians and measures of spreads, and also to include the rating variable itself. So we've got another set of code here. It's quite again, another lengthy piece of Python code. So let's go into lab here and see what it generates. And again, it spat out a lot here of different pieces of output and graphics with not really any work at all. I've got a whole host of graphics here on how the rating variable and every other variable interaction. Honestly, I'm quite happy with these. Just as a very quick exploratory analysis, I happen to know how this data was simulated. It's not super interesting data, but there was a relationship between two of the variables and that was rating and sign up year. You can see that it's created some nice interactive graphics here. I did tell it that I wanted plotly graphics where it could. I actually told it plotly, but it's actually used plotly in Python as well here. So that's really, really nice. I can very quickly interact with all of these graphics and for the most part, with the exception maybe of this second graphic here, turtle spend, they're generally reasonable graphics that that I would want to create as I'm starting to investigate my data. So this looks really cool. At this point I might want to investigate this variable a little bit more. I am very quickly jumping through the workflow here just to give you a taste for what Claude can do. But let's say I've done a lot more investigation and I know sign up here is impact ratings, so let's do some extra analysis on this. So I want Chord at this point to do something extra and I haven't actually told it anything that I want to do. I just want to do extra analysis to explore more. And again, it's generating a lot of code for me at this point. It looks like it's doing a whole range of different things and it's telling me here everything is doing. It's creating correlation analysis, it's doing a chi squared test, it's creating graphics and summary statistics. So let's see what it creates. Okay, so I've got a nice line chart here of the two variables that's a bit nicer than the one we had previously. It's giving me a more detailed box plot. Some nice. What have we got here? A correlation heat map by the look of it. Lots more broken down graphics. This is a really nice set of graphics and if I had a bit longer here, I'd definitely be looking in detail into what this was. It's done a chi squared test. I've got a very small P value here. If I look somewhere up here, it's giving me some information about what that test is that it has done. Really nice output here. I'm also quite impressed this time that worked. Every single time I tested this it generated a whole host of different errors. I think just purely because of the volume of code it was writing. That was very cool that that actually ran this time as well. So at this point in my analysis we're skipping through quickly but at this point I've maybe decided this is quite a significant relationship and I want to create some graphics now to output and present to stakeholders. And this is something that I think is a really interesting way to work with tools like Claude because there are taking that step from getting your analysis to getting to a presentation ready graphic is something that for me is a real time drain at the end of a project. I've got my data, I've got my analysis, but I can never remember all of the steps that I want to do. So how do I exactly customize the graphic to create exactly what I want? How do I need to update the colors to make sure that it's in my company colors, all of those different things. So this section is where I think I personally end up using AI tools a lot more. What I've done here is already generated an error, so we'll give that a second. I'll correct that in a second. But just to talk a little bit about what I've done here, I have. I've actually copied two prompts in here, so that's possibly where it's got a bit confused, but I've asked Claude to create an interactive graphic using Plotly js. Now, I previously uploaded the output of the average rating by sign up year to my project. Let me just go back and show you that Chord actually can't do analysis itself. If I want to create graphics in Claude of output, I need to give that data to Chord. In this example, all I've done is actually pasted into Accord option here. So if I want to example, add content and I've all I've done is added text content here and pasted the output directly from Python. The output that Chord generated for me and I've included that average rating by sign up year. So I've asked Chord then to create an interactive graphic of this data with year on the x axis and average on the Y axis. And that was where it generated an error. So let's throw that back into code and see if it can correct that for us. But yeah, this is where I'm asking it to create a widget here in the side, a nice tool. Unfortunately, this is not playing today, so let's see if I can find where I previously created this. So this is an example where I. I've done the same thing previously and asked it to create that interactive graphic for me and this is what it created. So an interactive plotly graphic right here in Chord. As with the previous tools that I created, I can grab grab the code for this, but I can just preview that here as well. But as I said, for me, this is the painful part because I often want to change features of this. I want to make it a bit more impactful for presentation and this is where it can speed up my workflow an awful lot. So in the next prompt here, what I asked was to give it a more dramatic title. It gave it quite a boring title and I also asked it to include some bullets to highlight the recommended Next steps based on this graphic only. I'm zoomed in so my title has gone off there but it has now updated this and included those next steps underneath. So this is really, really interesting now. So I've got now a piece that I can use and share with people that not just includes the graphic but include some recommended next steps. So this, these are also very interesting next steps. So finding out why new customers are giving lower ratings and things like this. If I keep going there, I can tell it now I want my company colors to be used. I've told it navy blue and orange. They're not the data cam colors but navy blue and orange have now been added throughout here and I can keep going and adding other features if I want. Here you can start to see where this is creating some really interesting looking graphics for us. The final example then that I had here is essentially creating the same thing in Python. So let's see if we can get the Python code for this same thing. So this is obviously really nice, but sometimes you do want that in a file that you can save out and use in a static location. So that's what we're going to do here. Again here I've given it information, I want it to create rating of the distribution of rating and the average rating by sign up year. It's going to be a presentation for executives and it should highlight the story that I want to tell. So let's see how Claude has got along with this. And I can see here I've got some nice graphics. It's. It's kept that navy blue and orange in here again made some slightly interactive there. They're using potly again here. But it's also acknowledged that piece that I asked that I wanted it to highlight the key, the key trend in this analysis. So it's included that information here. Ratings have declined and it's highlighted those points in orange from the others for me. So a really, really nice graphics output. Very, very quick to create that. We can go further. So this has used this, has used plotly to create this. But if you wanted to use other tools. So I've just included some extra pieces here to, to ask Claude to use Seabourn instead. It's already using navy blue and orange, but I include that I wanted to include a summary sentence and remove grid lines. I, I've decided I don't like the grid lines so I wanted to remove those. And in this example it's now decided, I just spotted at the end there, it's decided it's going to Serve this out instead of printing it out. And if I can spot that very quickly here, this is the, the graphic that it has created. I'm not certain if that is the one or if it's the one I previously had, but this is one I created earlier anyway. So it either created it just now or a little earlier today. But you can see that same features coming through. It's highlighting those points. And this is something that if I had had to do this without using Claude, this would have taken me a good couple of hours just to refine all of the little pieces in Python to, to get all of these arrows and labels and adding the dots in different colors. So really, really exciting to be able to, to create these graphics so quickly. I think at that point I'm gonna stop talking and ask if there are any questions. So, Adele, I'll hand back to you for a second.
That was awesome. Amy. Lots, lots of cool stuff that you can do with Claude. Maybe before I start taking in some audience questions, we have quite a few. Everyone do make sure to ask questions. We'll make sure to answer them. Maybe a couple of questions from my side. I love the artifacts feature and I think it's super useful, especially for building applications. Is currently artifacts supported in the API of.
That is a very good question that I don't know the answer to actually, but I'm not certain.
Okay. So I think that would be very useful, especially if you're building applications. And maybe one question as well, maybe what have been some of your favorite examples of working with artifacts especially?
There's been so many. I spent a ridiculous amount of time on YouTube watching people talking about artifacts artifacts and all of the different examples. There were some very cool people creating mini computer games using Claude artifacts. I don't personally have any use cases for, for that, but I think for me a lot of the stuff like here are a whole bunch of documents and summarize it in an interactive way was very cool. So yeah, absolutely loads. I think Google artifacts in Claude and you can go down a huge rabbit hole for many, many hours of searching.
Definitely. And then maybe I'll take a first question here from audiences from Adnan mentions what differentiates Claude from the OpenAI from ChatGPT, essentially. So yeah, maybe first. First question here.
Yeah, it's a really good question. And when I started using chords, I'm gonna be honest, I had chord and chat GPT up and side by side and I was going, right, what's the difference between these two? I'm gonna say it depends what you're doing, I think, as to which, which is better or if there's even any difference. I asked both tools to give me an outline for today, what should I talk about and they gave me very much the same answer. If I ask Chord to conduct a whole analysis of my data, it's not going to do very well there. I think that's where ChatGPT wins over. It's got that capability to do the analysis and run your code, but when it comes to artifacts and those widgets and tools, CLAUDE wins hands down. I haven't seen anything like that in ChatGPT, so I think it's going to depend on your use case as to which to use. I'm finding I've got now both open at any one point and using both for different things.
That's great. Another question here from Sean. Have you tried using Excel files on Claude and if so, how does it manage it?
Yeah, I did try this when I was using the free version of Claude and it doesn't support Excel files in the free version. That has just reminded me. I didn't then try it in, in the professional paid versions, but from my understanding it does work in the paid versions. I'm not 100% certain, but I'm pretty sure it does at that point. So, yeah, unfortunately not in the free version, but yeah, fair.
And then another question here I can't seem to be able to share for some reason. What are some of the limitations that you found with Claude? This question is from Martin.
Yeah, really good question. I think Claude, the limitations I found were more in what it appeared to do versus what it actually did. So I wasn't going through in a lot of detail. But you might have noticed, like it told me my chi squared test had a significant P value. It couldn't possibly have known that because it hadn't run the code. So it was just inventing output. So I think that's similar to any AI tool it could start to invent. But I think, yeah, that's definitely a limitation. If you don't know what you're doing, you could very easily just copy a lot of that and assume it was correct and it's completely fictitious. I am not too worried about the fact it can't do my analysis for me because I'm a bit of a control freak. I like to do that. So I like the fact that I can generate the code and see what it's done and kind of tweak that myself. If you want it to do your analysis full end to end, I Think that would be a limitation that is just not there yet.
Okay, fair. And maybe, you know, related to limitations. I think this is a great question as well from Joshua. Can you use CLAUDE AI for machine learning? What would be a prompt to see how well it could execute a machine learning task?
Because it's not going to actually run any Python code, it's not going to do your machine learning for you. But as far as generating code to implement machine, as we've been doing today, and move it across to Python, it absolutely would be able to go through that. I think you'd have to experiment a little on exactly what prompts you would use. But I would definitely be looking at telling it exactly which was my target variable. For instance, if there were any things that I particularly wanted to create. But I think for feature engineering, that would be a great use case. I mean, coming up with new features from what you already have, getting that inspiration, that would be a great use for Quad as well. So, yeah, yeah, being very specific, that's what I think. I can't say that enough about any AI tool that you're using. Just be really specific about what you want and you'll get there. If you're very vague, you'll get very big outputs.
100. And maybe one last question here. I think this one's going to be a bit of a doozy from a very important question. Tyler Martins, A big hurdle many face with attempting to use AI at work is our companies don't want us sharing company data with these AI models. Any recommendations on how to navigate that with CLAUDE or any AI for that matter?
Yeah, I mean, like the simple answer is don't give it your data. I think that's where today I showed you the example of just using the data Dictionary and telling it a description of what your data is. That's one potential approach, but even then some companies may not want you to do that. So I did test this out without giving it any information. I just told it my data is in a file named this. It will then generate code for you, but you might have to tweak it a bit more yourself because if you haven't told it what is in the data or what the data looks like, it can't totally get that right for you. So yeah, there are challenges to that. I think if you're working more with teams setups for this so you can get a team's version of code, you're not going to have quite those same issues. But yeah, I think the simple answer is don't give it your data? Absolutely. Don't give it your data, but just give it as much information as you can to help that out.
Yeah, maybe the rule of thumb is that if you want to share it on social media, don't share it to a large language model then. I couldn't agree more here. Team setup. Also, I do find just the data dictionary, the name of the columns. If you are able to share that, it's a very great technique because maybe you can then actually create one row of fake data and then see what you can do then maybe. One last question from John. How does Claude handle generating PowerPoint presentations?
That's a really good question. I didn't actually ask Claude at any point to generate slides for me. I asked it about content of slides and it did a pretty good job of that. If you're looking at I need to present this data, what are the summary points to include in my slides that it's going to give you extensive amounts of information. I even managed to get it to generate the whole script that I should give alongside a set of slides. Very good question that I didn't actually ask it to literally create the slides. I don't think it would. But in terms of what should go on those slides, you're going to get extensive responses.
Awesome. Everyone who has questions, we weren't able to answer them, do make sure to connect with Amy on LinkedIn. Ask her as many questions as as you can. If there's any questions that you know you wanted to ask but you couldn't get to us as well to make sure to send us questions again. It's always a privilege, a pleasure to be able to host these webinars. A huge thank you for Amy for sharing her Claude knowledge with us today. It's very, very insightful and thank you for everyone who has joined from across the world as well. We'll tune in for the next.
More from Richie

#359 My Best Friend is AI with Valerie Tiberius, Professor of Philosophy at University of Minnesota







How AI Agents Will Work While You Sleep | Ruslan Salakhutdinov, Professor at Carnegie Mellon

#358 How AI Agents Will Work While You Sleep | Ruslan Salakhutdinov, Professor at Carnegie Mellon

