Introduction to the Tidyverse Course
12 Feb 2019 · 1 min
0:51
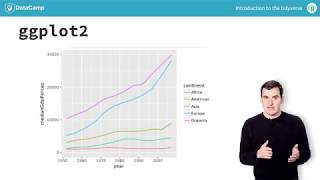
Dave Robinson teaches you how to explore and visualize data in R using dplyr and ggplot2. You'll work with the Gapminder dataset of country statistics to learn filtering, sorting, and creating charts that actually tell you something.
Chapters
More from Richie

youtube.com
#359 My Best Friend is AI with Valerie Tiberius, Professor of Philosophy at University of Minnesota
5mo ago







youtube.com
How AI Agents Will Work While You Sleep | Ruslan Salakhutdinov, Professor at Carnegie Mellon
5mo ago

youtube.com
#358 How AI Agents Will Work While You Sleep | Ruslan Salakhutdinov, Professor at Carnegie Mellon
5mo ago

See all content
