Learn how to do arithmetic on pandas Series and DataFrames. Convert precipitation from inches to centimeters with scalar multiplication, calculate percentage changes in temperature data, and combine Series with different indexes using the add method's fillvalue option to avoid NaN results.
Chapters
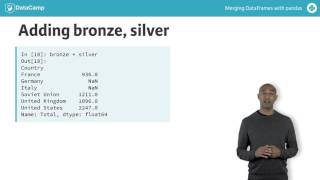
Let's explore various arithmetic and mathematical operations between Pandas series and dataframes. We load daily weather measurements for Pittsburgh from 2013. We make date the index and we use parsedates equals true to get datetime objects. With datetime indexes we can use convenient strings to slice, say the first week of July from the precipitation in column. The precipitation data are in inches. Let's convert them to centimeters. We use the asterisk to multiply a series element wise by 2.54. Remember, we can broadcast standard scalar mathematical operations here. Broadcasting means the multiplication is applied to all elements in the data frame. Let's find the percentage variation in temperature in the first week of July, that is the daily minimum and the daily maximum temperatures, expressed as a percentage of the daily mean friend temperature. We can compute this by dividing both the min temperature F and the max temperature F columns by the mean temperature F column and multiplying both by 100. To begin, slice the min temperature F and the maxtemperature f columns as a DataFrame Week 1 range. Next, slice the mean temperature F column as a series week 1 mean. Dividing the DataFrame week 1 range by the series week 1 mean doesn't quite work. The column labels don't match so the result has all null values. Instead, we want to use the dataframe divide method with the option axis rows. The divide method provides more fine grained control than the slash operator for division itself. This broadcasts the series week one mean across each row to produce the desired ratios. We can see the temperature range varies by at most about 10% from the mean in that week. A related computation is to compute a percentage change along a time series. We do this by subtracting the previous day's value from the current day's value and dividing by the previous day's value. The percent change method does precisely this computation for us. Here we also multiply the resulting series by 100 to yield a percentage value. Notice the value in the first row is NAN because there is no previous entry. Finally, let's examine how arithmetic operations work between distinct series or dataframes with non aligned indexes, which happens often in practice. Will use Olympic medal data from 1896 to 2008. Here are the top five bronze medal winning countries, the top five silver medal winning countries, and the top five gold medal winning countries for that period. All three data frames have the same indices for the first three United States, Soviet Union and United Kingdom. By contrast, the next two rows are either France, Germany or Italy. Lets compute the total medals awarded to each country we start by adding bronze and silver. Here we add two series of five rows and get back a series with six rows. The index of the sum is the union of the row indices from the original two series. Arithmetic operations between pandas series are carried out for rows with common index values. Since Germany does not appear in silver and Italy does not appear in bronze, those rows have NAN in the sum. On examination we see the value 2247 for the United States. Row is the sum of 1052 and 1195 from the corresponding rows of the bronze and silver series, respectively. We can get the same sum bronze plus silver with a method invocation using bronze addsilver. The null values occur in the same places. The default fill value is nan when summoned rows fail to align. We can modify this behavior using the fill value option of the add method. By specifying fill value equals zero, the values of Germany and Italy are no longer null. Just as the divide method is more flexible than the slash operator for division, the add method is more flexible than the plus operator field for addition. Adding all three series together yields six rows of output, but only three have non null values. That is France, Germany and Italy are not index labels in all three series, so each of those rows is NAN in the sum. We can also chain multiple method calls to the add method with fill value equals zero to get rid of those null values in the triple sum. Now you can get some experience with standard arithmetic operations and methods for series and data frames in the exercises.