Python tutorial on analyzing birth weights from the National Survey of Family Growth dataset. Learn to plot histograms with matplotlib, create Boolean filters to identify preterm births (under 37 weeks), and use sampling weights to correct for oversampling in the survey data.
Chapters
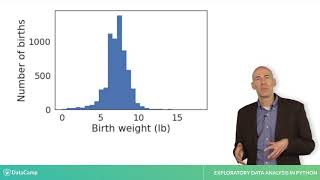
Let's get back to the motivating question for this chapter. What is the average birth weight for babies in the US? In the previous lesson, we used data from the NSFG to compute birth weight in pounds, and we stored the result in a series called Birth Weight. Let's see what the distribution of those values looks like. We'll use the Pyplot submodule from the matplotlib visualization library, which which we import as plt. Pyplot provides hist, which takes a series and plots a histogram. That is, it shows the values and how often they appear. However, Pyplot doesn't work with NANs, so we have to use Dropna, which makes a new series that contains only the valid values. The second argument, bins, tells hist to divide the range of weights into 30 intervals, called bins, and count how many values fall in each bin. HIST takes other arguments that specify the type and appearance of the histogram. You'll have a chance to explore these options in the next exercise. To label the axes, we'll use XLABEL and ylabel. And finally, to display the plot, we'll use PLT show. And here's what the results look like. The X axis is birth weight in pounds divided into 30 bins. The Y axis is the number of births in each bin. The distribution looks a little like a bell curve, but the tail is longer on the left than on the right. That is, there are more light babies than heavy babies. That makes sense because the distribution includes some babies that were born preterm. The most common duration for pregnancy is 39 weeks, which is full term. Preterm is usually defined to be less than 37 weeks. To see which babies are preterm, we can use the preg length column, which records pregnancy length in weeks. When you compare a series to a value, the result is a Boolean series. That is, each element is a Boolean value. True or false. In this case, it's true for each preterm baby and false otherwise. We can use HEAD to see the first five elements. If you compute the sum of a Boolean series, it treats true as one and false as zero. So the sum is the number of trues, which is the number of preterm babies, about 3,700. If you compute the mean, you get the fraction of trues. In this case, it's close to 0.4, that is, about 40% of the births in this data set are preterm. We can use a Boolean series as a filter that is we can select only rows that satisfy a condition or meet some criterion. For example, we can use preterm and the bracket operator to select values from birth weight, so preterm weight contains birth weights for preterm babies. To select full term babies, we can use the tilde operator, which is logical, not or inverse. It makes the trues false and the falses true. Not surprisingly, full term babies are heavier on average than preterm babies. If you have two Boolean series, you can use logical operators to combine them. Ampersand is the logical and operator, and the vertical bar or pipe is logical. Or there's one more thing we have to do before we can answer our question. Resampling the NSFG is not exactly representative of the US population. By design, some groups are more likely to appear in the sample than others. They are oversampled. Oversampling helps to ensure that you have enough people in every subgroup to get reliable statistics, but it makes the analysis a little more complicated. However, we can correct for oversampling by resampling. I won't get into the details here, but I've provided a function called resamplerowsweighted that you can use for the exercises. If you're interested in learning more about resampling, check out Datacamp's statistics courses. Now we have everything we need to answer the motivating question. Let's get to it.