Python Tutorial: pandas Foundations (part 4)
6 Mar 2017 · 1 min
1:14
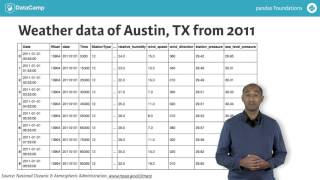
Load and clean two messy weather datasets for Austin: 30 years of climate normals from NOAA and 2011 hourly observations. You'll use pandas.read_csv options to handle missing values and parse dates, then prep both files so you can compare them.
Chapters
More from Richie

youtube.com
#359 My Best Friend is AI with Valerie Tiberius, Professor of Philosophy at University of Minnesota
5mo ago







youtube.com
How AI Agents Will Work While You Sleep | Ruslan Salakhutdinov, Professor at Carnegie Mellon
5mo ago

youtube.com
#358 How AI Agents Will Work While You Sleep | Ruslan Salakhutdinov, Professor at Carnegie Mellon
5mo ago

See all content
