Learn statistical analysis using the Daphne Major finch dataset from Peter and Rosemary Grant's decades-long study. Estimate mean beak depth with confidence intervals and test whether beak size changed significantly between 1975 and 2012 in Geospiza scandens.
Chapters
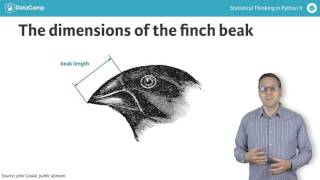
You are now carrying a well stocked toolbox. You know how to take a data set and explore it. You know how to think probabilistically and infer values and confidence intervals about parameters. You know how to formulate a hypothesis and use your data in Python to test it. Let's put those tools to use. In this chapter you will immerse yourself in what is, in my opinion, one of the most fascinating data sets out there. You may know that many of the important observations that led Charles Darwin to develop the theory of evolution were made in the Galapagos Archipelago, particularly in the study of small birds called finches that inhabit them. The islands are ideal for studying evolution because they are isolated so they do not have complicated effects from interactions with other species, including humans. Furthermore, some of them are small, so entire populations can be monitored on a given island. Every year since 1973, Peter and Rosemary Grant of Princeton University have been spending several months of the year on the tiny volcanic cinder cone island of Daphne Major in the Galapagos. This island has two dominant groundfinch species, Geospisa Fortis and Geospisa Scandens. The Grants have monitored them every year, tagging them, making physiological measurements, taking samples for genetic sequencing and more. In 2014 they published a book entitled 40 Years of Darwin's Finches on Daphne Major Island. They generously placed all of their data on the DRYAD data repository, making it free for anyone to use. The data set is impressive and a great set for using data, science and statistical inference to learn about evolution. You will work with the Grants measurements of beak length and beak depth. You will consider different aspects of the beak geometry, including how it varies over time from species to species and from parents to offspring. I will come back with short discussions as you are working through the data sets, but you are mostly on your own. You can do it. Ok, for your first analysis, you will investigate how the beak depth of Geospisa Scandens has changed over time. You will start with some exploratory analysis of the measurements of these species from 1975 to 2012. You will then perform a parameter estimation with confidence intervals of the mean beak depth for those respective years. Finally, you will do a hypothesis test, investigating if the mean beak depth has changed from 1975 to 2012. Have at it.