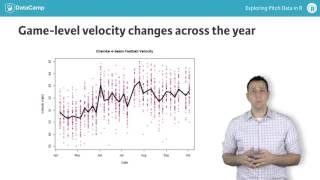
Zack Granke's fastball velocity shifted right in July, showing higher speeds that month. The overall pitch distribution is multimodal across different pitch types, and game-by-game trends show variability but no clear link yet between velocity and success.
Chapters
Throughout this chapter, you managed to tidy up your pitch data and explore Zack Granke's pitch velocity in a number of ways. First, you took a look at the distribution of velocities for all of Granke's pitches, noting that there are clear multimodal distributions. These were likely a result of various pitch types thrown at different velocities. You then focused specifically on fastball velocity and saw that in July graduates, Granke had a tendency to throw harder than the other months of the year combined. This was clearly represented by the rightward shift in the fastball velocity distribution you see here. Finally, you evaluated velocity and its game by game variability across the season. While there was a pretty clear uptick in velocity in July, there was also one just before June began. Overall, the results are somewhat inconclusive on whether Granke's success was specifically related to increased velocity. We will return to examining outcomes from these differences in chapter four, but in the following chapter you'll begin exploring Granke's different pitch types and how he uses them in different situations. Once you're ready to go, go ahead and get started on the next chapter.