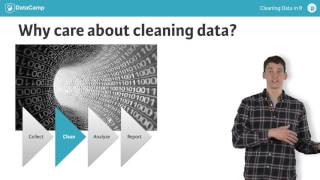
Nick from DataCamp shows why data cleaning matters in R, using a Boston weather dataset that looks tidy but has hidden problems: meaningless columns, duplicated time formats, mixed types, missing values. Data scientists spend up to 80% of their time on this janitor work. The course covers exploring raw data, tidying it, and preparing it for analysis.
Chapters
Hi, I'm Nick. I'm a Data Scientist at DataCamp and I'll be your instructor for this course on cleaning data in R. Let's kick things off by looking at an example of dirty data. You're looking at the top and bottom, or head and tail of a data set containing various weather metrics recorded in the city of Boston over a 12 month period of time. At first glance, these data may not appear very dirty. The information is already organized into rows and columns, which is not always the case. The rows are numbered and the columns have names. In other words, it's already in table format, similar to what you might find in a spreadsheet document. We wouldn't be this lucky if, for example, we were scraping a webpage. But we have to start somewhere. Despite the data set's deceivingly neat appearance, a closer look reveals many issues that should be dealt with prior to, say, attempting to build a statistical model to predict weather patterns in the future. For starters, the first column X all the way on the left, appears to be meaningless. It's not clear what the columns x1, x2 and so forth represent, and if they represent days of the month, then we've got time represented in both rows and columns. The different types of measurements contained in the measure column should probably each have their own column. There are a bunch of N A's at the bottom of the data and the list goes on. So don't worry if these things are not immediately obvious to you. They will be by the end of this course. In fact, in the last chapter of this course, you will clean this exact same data set from start to finish, using all of the amazing new things that you've learned. Dirty data are everywhere. In fact, most real world data sets start off dirty in one way or another, but by the time they make their way into textbooks and courses, most have already been cleaned and prepared for analysis. This is really convenient when all you want to talk about is how to analyze or model the data. But it can leave you at a loss when you're faced with cleaning your own data. With the rise of so called big data, data cleaning is more important than ever before. Every industry, finance, healthcare, retail, hospitality, and even education is now doggy paddling in a large sea of data. And as the data get bigger, the number of things that can go wrong do too. Each imperfection becomes harder to find when you can't simply look at the entire data set in a spreadsheet on your computer. In fact, data cleaning is an essential part of the data science process. In simple terms, you might break this process down into four steps acquiring or collecting your data, cleaning your data, analyzing or modeling your data, and finally reporting your results to the appropriate audience. If you try to skip the second step, you'll often run into problems getting the raw data to work with traditional tools for analysis in, say, R or Python. This could be true for a variety of reasons. For example, many common algorithms require variables to be arranged into columns and for missing values to be either removed or replaced with non missing values, Neither of which was the case with the weather data that you just saw. Not only is data cleaning an essential part of the data science process, it's also often the most time consuming part. And as the New York Times reported in a 2014 article called For Big Data, janitor work is key hurdle to insights Data scientists spend from 50% to 80% of their time mired in this more mundane labor of collecting and preparing unruly digital data before it can be explored for useful nuggets. Unfortunately, data cleaning is not as sexy as training a neural network to identify images of cats on the Internet, so it's generally not talked about much in the media, nor is it taught in most intro data science and statistics courses. But no worries, we're here to help. In this course, we'll break data cleaning down into a three step process exploring your raw data, tidying your data, and preparing your data for analysis. Each of the first three chapters of this course will cover one of these steps in depth. Then the fourth chapter will require you to use everything you've learned to take the weather data from raw to ready for analysis. Let's jump right in.