Learn how to use the j argument in data.table to select and transform columns. Wrap column names in .() to select them, call functions like sum or mean directly on columns, and assign custom names to results. The video covers automatic naming, recycling behavior with different column lengths, and using j for side effects like plotting.
Chapters
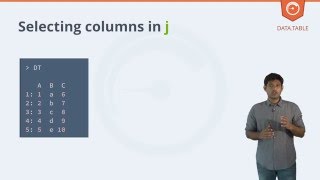
In the previous section, Matt showed you how to select rows using row numbers in the I argument, which is the first argument in data Table. In this section, we'll cover the second argument, which is j. The simplest thing what you can do in J is to select columns. Here's the data table dt, where you have three columns A, B, and C. To select the columns B and C, we just have to wrap them around with dot followed by a parenthesis. In addition to selecting columns, we can also call functions in j because the columns are as if they are variables, which we just saw in the previous section. Using the same data table from the previous section, we have three columns A, B, and C. Now, instead of just selecting on columns, we'll aggregate on columns A and C. We call the function sum on column A. That adds up the values 1, 2, 3, 4, 5 and returns 15. Similarly, we call the function mean on column C, which averages the values 6, 7, 8, 9, and 10, which gives 40 divided by 5 equals 8. Note that we provided total and mean as the column names that have been assigned as the column names in the result. Now, if we did not provide any column names, Data Table will automatically generate those values for us. When computing a, multiple columns does not all return the same length. The length of the shorter column gets recycled to match the length of the longer column. Using the same data table dt, with three columns A, B, and C, we select column B and calculate sum on column C. Now, sum on column C returns a single value which is 6, 7, 8, 9, 10 equals 40 and the length of column B is 5, and therefore sum of C value gets recycled to fit the length of column B. In fact, you can do pretty much anything in J. It doesn't even have to return a value. For example, let's do dt and it just plots the column A in the x axis and column C in the y axis. Note that we didn't have to wrap plot with the dot parenthesis syntax because here we use plot as a side effect and and returns a value null. In fact, we can also have multiple expressions wrapped within curly braces. So, for example, we print column A here onto the console, which returns 1, 2, 3, 4, and 5, followed by a plotting of histogram on column C here. However, histogram returns the values invisibly and therefore we explicitly set the return value null in j.