David Trainer explains why P/E ratios and accounting earnings mislead investors, and shows how to value stocks using cash flows and return on invested capital instead. He walks through examples like GM, Qualcomm, and Yahoo to demonstrate discounted cash-flow modeling and what the market is actually pricing in.
Chapters
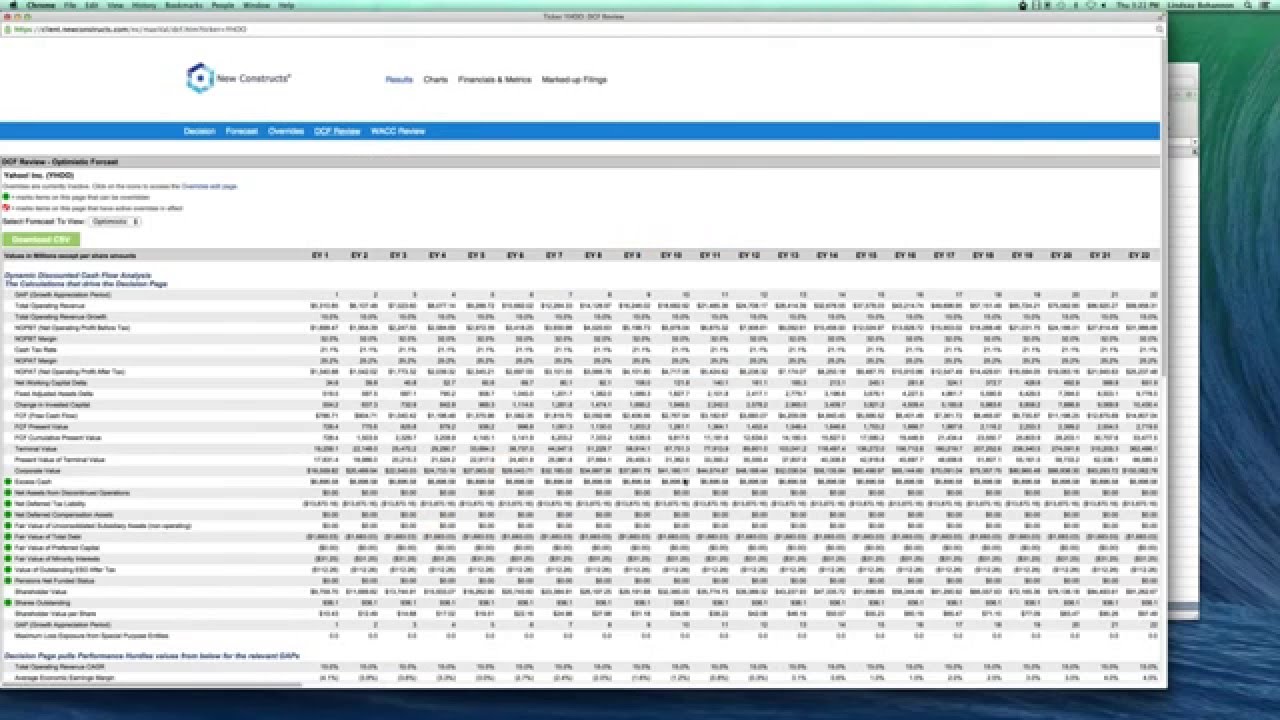
If you're an advisor, you're paying a lot of money to Credit Suisse or Goldman Sachs or Morgan Stanley to have access to research, and you look at these ratings and you want to trust them. Well, the truth is you can't really, right? And it's not just me saying this, it's Integrity Research, which is the watchdog or the primary firm that kind of grades research firms. And they got it from the Financial Times. We might have that. Here we go. Here's the Financial Times article PDF. There it is. It's the Financial Times. A stock picker confesses to recommendations you should not buy. All right. So my point is, you know, you're getting some misinformation and it's, and it's not just about ratings. It's about earnings too. You've heard me talk about this before, but it was, you know, this was featured on MarketWatch, right? That CFOs themselves say the numbers are fudged. And so I just think we need to start with that as part of our context. You know, I mean, You got to do some real work to get to the truth behind the numbers. And when it comes to making money in the market, right, the traditional theories are— there are sort of 3 ways, right? There's the greater fool theory. And I remember I learned this after a few years on Wall Street during the tech bubble when one of my good friends on the— who was a sales guy literally said to me, you know, that he was investing in some of these crazy stocks that we all knew were just ridiculously overvalued. I said, what are you doing, man? And he said, David, haven't you heard? It's the Greater Fool theory. I go, what is that? He goes, as long as someone's willing to buy it at a higher price than me, than what I paid, then I'm going to buy and sell later. That's a great theory. How it works out in practice may not always be as well as people would like to believe. I mean, you're basically betting on the lack of rigor or analysis or intelligence of other people. That's a, you know, that's a lot of cases that could be a good bet as long as the market's moving in your favor. There's technical analysis, which I think everyone's very familiar with. You know, that's effectively looking at past price performance and stock movements to justify what your investment strategy is going to be. And the last method is fundamental. Now, everybody loves to talk about doing fundamental analysis. You know, I talk about it a lot, but I think most people don't realize how difficult fundamental analysis is, right? And so, you know, we've got all kinds of resources. I'm just thumbing through a bunch here that, you know, explain to you investors you can— or mistakes you can make and how to actually do good research. How I've given this speech to people and, you know, on the CFA Society, I'm on their distinguished lecture speakers tour, right, where I go in and help explain to CFAs, who are among the smartest investors that I find out there. I think that's impressive, right? If you've got an advisor who's a CFA, that's a good thing. If they're not a CFA, you know, you, you want to make sure that they've got a good research process. And don't just trust whatever research that they're getting from an investment bank, because as I've just pointed out, look, the investment banks aren't always that good at providing good research. But fundamental analysis kind of rests on these concepts. First and foremost, that the market is not perfectly efficient, right? And this is just sort of a basic normal pie chart. It is not— or normal distribution chart. Let me say, tell you honestly, I made these numbers up, but it's just to illustrate a concept, right? Most stocks are fairly valued here in the middle, but there are little fat tails here of stocks that are extra cheap and extra expensive, right? Obviously, we want to focus on buying things that are cheap and expensive, but we want to do one better than that, right? We want to also focus on where there's a disconnect between what the market thinks profitability is and what profitability really is. Right? So, in most cases, accounting earnings aren't too terribly off. Now, in general, accounting earnings do overstate profitability. That's why you see a shift, you know, to the right here in terms of most stock— most earnings are overstated for a lot of reasons we can go into. Feel free to email me or hit us up on Twitter for any questions about that, or really, honestly, just check the blog because we got about, I don't know, 100 articles on that. Okay. So there are fat tails again here where accounting earnings understate profits and fat tails where accounting earnings more drastically or more meaningfully overstate profits. So where do we really want to be long? Where's the best risk-reward? Where is the least amount of risk and the best potential reward, right? Well, it's going to be in stocks where you've got understated cash flows at a cheap valuation. That's good, right? The downside risk is pretty low because we already know they're more profitable than the market thinks. The valuation is already cheap, really, most of the time. And I'll give you some examples of stocks like this. GM is one we wrote on recently, just to point out one that's big. Qualcomm is another great one that we just wrote on recently, where the cash flows are better than people think and the valuation is super cheap. A lot of times, the valuation of these stocks that we put on our on our long pick of the week and our most attractive stocks list, a lot of times those valuations imply permanent profit decline, significant permanent profit decline, right? The risk there is pretty darn small, right? The companies, the profits have to decline more than what the market has already predicted as reflected in the stock price for the stock to go down. On the other hand, short or sell companies that have really high or extended valuations, and overstated cash flows. Double whammy, right? At some point, they may have an earnings miss, revenue miss, or guide down in terms of earnings, right? In which case, that's going to crush the stock. On top of that, they're going to have a valuation potentially that's overstating the possible— overstating by a long shot the potential profits of the business, right? And this is, you know, by the way, this is a construct that is new. But it's catching on across all elements of the business, right? I know because I've been doing this for almost 15 years, right? We've got some of the biggest technology consulting firms in the world taking this to corporations and saying, hey, by the way, you know, your profits are understated and your valuation is too low. You need to get your story straight, right? I'll give you another example. Of exactly what kind of message, what kind of power there is in this work that we do. Right? So the message is, you go to the big corporations, let's say a GM or an Intel, and you say, your valuation relative to the market and the way it awards value in general is low. You need to be— do a better job of explaining How you can— how you're actually creating value. That's what Google did, and they had a $65 billion day when their market cap went up by $65 billion. And just so you understand, this chart explains the correlation between return on invested capital, you know, one of our favorite metrics, and really price-to-book, or enterprise value to invested capital, which is a ratio of what the market values the company's assets at compared to what their book value is. So effectively, what this correlation shows, what this regression analysis shows, is that for the S&P 500, there's a 92% correlation between changes in return on capital and changes in valuation, right? And stats— statisticians will say, okay, well, your analysis is a little bit off, David, because, you know, you've got this one outlier. Okay, well, we take that one out. And we're still at 64%. This is a natural, I think, very natural and elegant and intuitive way to think about valuation, right? Return on invested capital. What does that measure? Measures how much cash flow companies generate relative to how much capital they've been given. So doesn't it make sense that the market would reward those companies that create the most cash flow relative to their capital? As our analyst team know, as part of our training, we point out how this effectively scientifically makes sense. There have been studies done by Carnegie Mellon and others that show that markets will survive based on their— basically the structure of our capital markets will survive despite the intelligence of the traders over the long term. There's in fact, there's a study done by Carnegie Mellon called I'm gonna— I may get this not quite right, but if you Google it, you'll still find it. Market Efficiency Despite Zero Intelligence Traders, Carnegie Mellon. Anyway, it showed that despite the intelligence of the traders, the markets still assign capital according to this construct, right? Because if the market does not do it this way, if the market assigns value, rewards companies that do not create value, what happens to the market? The market goes away. It goes to zero if it gives money to the companies that just take it and don't give it back. So this has to be true. So let's talk about some examples. I put together a couple of screens using our screening system. And this is a list of stocks that have More than $5 billion in market cap and a high PE but a cheap valuation. A high PE but a cheap valuation, right? And I'm saying high is anything above where the market is. And this is, this is on trailing 12-month earnings, right? And so I think the S&P on trailing 12-month earnings is about, uh, is at about 10. So all these guys are way above the S&P. Right? And yet they're cheap. So what's the difference? What's the problem? Right? Well, let's take GM as a great example here. Or even GM because we wrote on it recently. So our analysis shows that when GM's earnings are adjusted For unusual items related to a settlement in Korea, related to some— what we believe to be mostly one-time recall costs, right? Their current stock price implies that their profits will decline by 50%, right? So they got a high PE that looks expensive, but in reality, it's not. So here's a good— here's a quick summary. One of the things we do is provide tremendous transparency. But in 2014, they reported $2.8 billion in accounting earnings. We show $7.8 billion in after-tax cash flow. Big difference. Big difference, right? We took out some non-operating after-tax items, right? We put that— we backed that out, those expenses. We then had a bunch of total non-operating expenses hidden in earnings that we backed out as well. Right. And that should— and that at the end of the day shows the profits are higher than what you think. So 2 big lessons here. P/E is misleading. Number 2, earnings are misleading. Right. And that's why you won't really see P/E most anywhere in our system, just except as a point of reference to help you get a sense of, you know, what the market might be looking at. Right. And we make money in this business by being smarter than the market. Doing things that the market doesn't know. If you're doing what the market already knows, you're just swimming with the— you're just swimming with the— running with the herd. And you don't really make a difference, and you can't be differentiated if you're just running with the herd. Let's look at another analysis I did. Here's a couple of companies that have low PEs but are actually really expensive. Let's take a look at Yahoo. And if anybody has any suggestions, throw them up here as a question. I'll take a look at some tickers for you. We'll run it through our system. Just so you know, it's not staged, right? Let's see what the quality of earnings looks like here. They showed $7.5 billion in accounting earnings. We show $1 billion in after-tax cash flow. A lot of that stuff is on— these are reported non-operating items. So this is mostly— this is stuff on the income statement. But if you're just taking the earnings and the PE that you're gonna get from like Yahoo Finance, right? I guess it's funny for me to use— to look at Yahoo and Yahoo Finance, but anyway, you see the PE looks really low, right? because the earnings aren't correct. Now there's earnings adjustments that are obvious, like the ones I'm talking about for Yahoo, but there's a lot of earnings adjustments that are not. You know, and that's why we have some of the largest hedge funds in the world as our clients, because that work takes a lot to get to. All right? And we saw a big jump in their invested capital base here in this year. Even though we're taking out $10 billion in excess cash, there's a bunch of money related to bad acquisitions they've made in the past, $7.8 billion. You know, when you really want to look at what kind of capital's gone into that business, right? But let's get some more detail on the valuation here, all right? So yeah, we've got it here, low PE, but we're seeing expensive red flags here on expensive. So what does that exactly mean? Well, the price-to-economic book value ratio for Yahoo, basically that's saying— that tells us the market is saying that it believes today's price tells us that the company's profits will be 720% greater Than they are today. Over the lifetime of the company, it's gonna generate profits at 720% of what they are today. All right? So that's, that's pretty big, especially when you're looking at a company like GM where it's 50%, right? Right, that's the whole idea between our most attractive and our most dangerous stocks. Let's, let's focus on being long stocks that are safe and cheap. And let's make sure that we recognize the danger in stocks that are really expensive and have misleading earnings. Right? And that's what we've got with Yahoo here. So let's dig a little bit deeper. Let's go into our model. All right? And let's get a sense of what's really baked in here. So if you've seen any of my webinars or tutorials on our discounted cash flow model, you'll know that we have a really good model for understanding the expectations baked into the stock price. Yeah. And the reason that we like to focus on the market's expectations is because those are the most important expectations. Because if you have the same expectations for the market, then as a fundamental investor, you shouldn't be long or short because you believe the market price is accurate. That's for fundamental people. There may be other reasons— greater fool theory, technical— you can believe what you want to believe about the near-term direction of price. Those are strategies that, that can work some of the time. I think it's better to layer with fundamental But I like to begin with fundamental at least, and then maybe layer some of these other strategies on because I want to be safe. Because these markets these days, I think, require us to be a bit more safe. And I think honestly to be diligent, to do right by our clients, right? All we're giving here really honestly is transparency. Why would you not want that for your clients? I know I want it for mine. So we're going to quantify the market expectations as reflected in the stock price. Now you can look at your own expectations, absolutely. But the point is, this is a whole lot easier if you can be a critic of the fortune teller than having to be a fortune teller. Because guess what? The market has to be a fortune teller every day, right? The old Ben Graham's old Mr. Market analogy, right? Every day the market's giving us a price. So let's see what the market thinks. So using consensus estimates, we've got $32 implies, 6% growth in revenue, almost 7%. Compounded annually for 45 years while maintaining a return on capital versus cost of capital spread of 3.1%. Now notice both the growth rate and the profitability rates are meaningfully above what this company's done in the past, and they got to do it for 45 years. Hello? 45 years. Okay. That's a long time to grow at any rate, but at a rate much higher than what you've ever done in the past? And at a level of profitability meaningfully higher than what you've done in the past, both of those things. So we can go into some more detail here. We can look at what the NOPAT CAGR implied over 45 years is. That's after-tax cash flow. So 45 years, NOPAT CAGR. Mm-hmm. Here we go. All right, my mouse isn't very fast, bear with me. So we're going out to year 45 because that's the year in which we get a price equal to, but closer than, the current stock price, right? $31.70 in the DCF model, you get 6.8% growth in profits. All right? So let's, um, you know, let's go with, um, A scenario that maybe is a little easier to get our head around, right? Let's say— let's talk best-case scenario for Yahoo. Let's put on our own forecast, right? So we do that by clicking on the forecast page. Then we click Edit. All right? And so let's say, you know, the market's got consensus estimates for revenue growth of 15% next year. Let's just— and then it has it dropping down to 2%. And then it has it dropping down to 2%. And then we quite generously, I might say, long-term put them back at 6.5% because that's sort of the long-term nominal growth rate in GDP. And we like to just kind of keep companies around that, around that range. But let's just say we're going to be really, really aggressive. We're going to give them 15% profit growth for the next 25 years and then we'll drop it down, right? We'll leave margins here. See all-time peak margins. 32%. All right, let's put that in. All right, we'll leave the cash tax rate, working capital, fixed asset needs around where they are today. I think those are probably about right. If you're going to be growing at that pace, you're going to have fairly intense capital. We're going to call this optimistic. So we're going to save that. Let's go back to the decision page and see how it compares. So this best-case scenario, 15% growth, all-time best margins, has to be maintained for 9 years. That's what $32 has baked into it. Let's go in a little more detail. Let's see what the cash flow growth, 9 years, the optimistic scenario in our discounted cash flow model. I know this is a lot of data for you. No PAT CAGR, 9 years. So they're going to effectively have to grow— to justify the current stock price, the company's got to grow profits at 17% compounded annually for nearly a decade. Historically, we can look at no PAT growth, right? And see, it's negative, negative, and it's gotten positive here. But in the last— let's just take a look at the last few years here. 10, 7, 3.7, 4.5, 9.3 on a trailing 12-month basis. So I'm not necessarily saying that this stock is extremely expensive. I don't have to say that. I just have to say that it's And this— for this scenario, it's a whole lot more expensive than what that PE suggests. A whole lot more expensive than what the PE suggests. And, um, in my opinion, the stock price has a lot of pretty high expectations baked into it. A lot of very high expectations baked into it. You probably want to go to stocks with lower expectations. What are the most important metrics of valuation? Good question. So we're getting some questions starting to roll in here. I'd love some more, uh, I'd love some tickers. I'll let you take a look at this page, Fake Cheap But Truly Expensive, if you wanted to— want me to run in any— run through any of these. What are the most important metrics of valuation? Well, it depends on what kind of investor you are. For me, it's about cash flow right now. I may have some great technicals lining up I may have a lot of fools that I think are going to be willing, or some great market trends that I think are going to be willing to buy the stock. But let's just, you know, cash flows are a good place to hide or a good strategy to build around. It's a bunker for your portfolio. It's a foxhole when markets get rough. You know, one of my investors told me we should write a story back when the China news was really big and everybody was asking questions about that or thinking China was going to blow up. And he said, you know, you should write an article saying the one place, you know, the stocks you can invest in when China blows up, when the economy goes off the rails. Because at the end of the day, if the company is actually really generating cash flow and the stock price hasn't already reflected that, you may see some drops with the market, but long-term, medium-term, and most of the time, honestly, in the short-term, you're going to be much better off because there's substance there. There's real substance, just like we showed in that regression analysis. The market, at the end of the day, it has to award value to those, to those companies that are creating value. That's what it's about. Is the market more short-term or long-term in terms of valuation? Depends on the investment horizon. Depends on whether or not you're short-term or long-term. It's a great question, by the way. You know, they like to— Warren Buffett says it well. In the short term, the market's a voting machine. In the long term, it's a weighing machine. It's another way of saying in the short term, it cares a lot more about sentiment. In the long term, at the end of the day, you're going to be weighed based on your cash flow. Here's a request to look at a certain company. STZ, Constellation Brands. We did a danger zone on these guys. So that's one of the first things I recommend you do whenever you're like looking for something. You can, especially if you're just a free member, you haven't signed up yet. Check out some of our articles. So on STARS, we saw some misleading profitability, right? GAAP net income, free cash flow. A lot of that's because they're spending a lot of money to buy these other companies, right? Grows the top line. We talked about this with a bunch of the new tech companies, the cloud-based companies. They're great at growing the top line and great at growing the balance sheet and great at negative cash flow. All right. And that only lasts for so long. Right. Shady acquisition accounting and balance sheet red flags. Right. Constellation boosted net income artificially in that— in the prior year by over $1 billion in non-operating and illusory gains from the acquisition of the remaining portion of Crown Imports. So they had a little loophole where, like, they were able to accrete income in by finishing out the acquisition of Crown, right? They paid a premium for the part of Crown that they did not already own and recorded the revaluation of its stake in Crown as income. So basically said, oh, we overpaid, so we're getting that back, and so we're gonna get income from the fact that we actually overpaid in the past. That's a cool trick, right? We also saw that they had employee stock option liability over $726 million. Lowest— one of the lowest ROICs in the group. Anyway, let's get to the model. All right, so here's what we think. And let's see, that article was written October— about a year ago, right? So STC has done really well in the last 90 days. We've got a new set of financials for 2015 since then. Looks a little cleaner. What it has in the past. You know, this is one of the— probably the biggest red flag here. $2 billion in assets, right? Or, you know, the company has effectively written off $2 billion of assets related to acquisitions. And that's a pretty big number. Let's see, what's 2 out of 15? So for every dollar of assets on their balance sheet, they've written off 13 cents. All right, that's not horrendous. And we see the price-to-economic book value is 4.8. That gets our worst rating. The market implied growth appreciation period is 12 years. Negative 1 free cash flow. You know, quality of earnings doesn't look too good. So let's open the model, dig a little deeper. All right, so this revenue growth rate has been really strong in the past. It's been acquisition-oriented. Returns on capital really flat to down. So the market in our— based on the consensus estimates, our default estimates is saying that to justify $135 or so, the company has to grow revenues at about 9% compounded annually over the next 12 years while also improving its return on capital to cost of capital spread from 0% to 3.8%. So we can go to the forecast page to get a sense of what, you know, revenue growth has been historically. Huge growth in the last couple years, right? That's all acquisition-oriented. You know, for 1, 2, 3, 4, 5 years before that, negative profit growth. So— That means that they're not growing without acquisition. And what we've seen in the years when they did these acquisitions, 2013, '14, and '15, right, for every dollar of revenue, they're paying as much as $3.30, right? So going forward, if they're going to continue this kind of high growth rate, Probably be fair to like boost this ratio up to more like 70 cents for every new dollar of revenue. And I would just say as a general rule, we try to be really conservative in our default forecasts, right? We don't want to put crazy numbers in here. We want the crazy numbers to effectively fall out of what the market thinks. So I'm going to boost that up because I'm also going to boost this. You know, let's give them credit for 20%. For the next 3 years, 10 after that. That's a big number, all right? And this again, these are capital utilization numbers that are far below what they've used in the past to generate that kind of growth, all right? Margins at 25%. Let's say they stay, you know, that's, I think it's a pretty fair number considering, you know, peaked around here, but still lower than where they are. They're trending down. You know, we'll call this optimistic nonetheless. So we got for the optimistic scenario, you got 7 years, 14% revenue growth, still big improvement in profits, and they got to do that for 7 years. I like to always look at what the, the NOPAT CAGR is over timeframes. So 16% compounded, 15% compounded annual growth in profits. 14%. For at least 7 years. It's a big number, you know. What have they done in the past? Let's take a look at NOPAT growth over the last 13 years or so. NOPAT growth, right, acquisition-related, 12 months is more like 5%. Acquisition-related, negative, negative, 5%, negative. Pretty big numbers there. Those could be— those look like they were acquisition-related too, numbers. Right. When you see a big jump in invested capital, 4 to 6, that tends to be from an acquisition. 6.5 to 7.7, probably another acquisition. 7.7 to 9, definitely another acquisition. The NOPAT just still went down. Maybe it could translate in the other year. Anyway, for— in terms of organic growth, I'd say expectations for Constellation Brands are really high. Let's face it, when Anheuser-Busch is trying to buy SABMiller, there's not many acquisitions left to make. So anyway, I hope that's been helpful. Our 30 minutes are up. And one last question, valuation adjustments. I might as well show that off while we're here. So you'll see that in the discounted cash flow model. All these adjustments here, notice there's a green dot next to all of them because they can be changed. We're not here to sell religion on how to do analysis. We're here just to make sure that you're making a fully informed decision. You may not like our adjustments, and a lot of times our adjustments have a zero, but at least you know that someone out there is turning over every stone to make sure that you're making a well-informed decision. One that's not based on misleading earnings, one that's not based on misleading ratings from Wall Street, one that's unbiased, independent. And really align with your best interest. We do well when our clients do well. No two ways about it. We're out there to do this work for you. We're bringing a new level of transparency to this business, and we think it will help your business to participate in this new level of transparency. We believe we're not too far from a future where everybody will operate with this level of transparency. Who wants to look their client in the eye and say, oh, I don't really care about that footnote stuff? I'm not willing to pay $99 a month just to make sure I don't blow you up or any of my other clients up. Anyway, it's a new construct, a new construct for transparency, a new construct for fairness in investing, and a new construct for giving you the analytical tools you need at a price you can afford and simple enough to use so that it fits in the time that you have to spend on this. To do this work on your own, to replicate this work, would take hours, days, months, years. Trust me, I've been doing this for 12 years. We've spent millions of dollars on technology and training people and uncounted, untold hours of hard work on this. It's a lot of work. It's a very scalable product, and that's why we can offer it for you at such a great price. Thank you. Please fill out our seminar.
More from David




Earnings Recap: Decoding Signals from SpaceX, Palantir, Merck, AMD, Caterpillar, McDonald’s, & More

Watch Our Earnings Recap: Market Heavyweights Apple, Microsoft, Amazon, Meta, Visa, and More



Earnings Recap: Top Insights from JPMorgan, Bank of America, Taiwan Semiconductor, Netflix, and More


The IPO Melt Up: How Smart Investors Use AI to Find Abnormal Investment Opportunities