David Trainer of New Constructs explains how rising stock prices can hide danger. His Danger Zone rating system flags stocks with deteriorating margins, inflated valuations, and hidden accounting items using forensic analysis. Twitter and Groupon show how revenue growth masks falling profitability.
Chapters
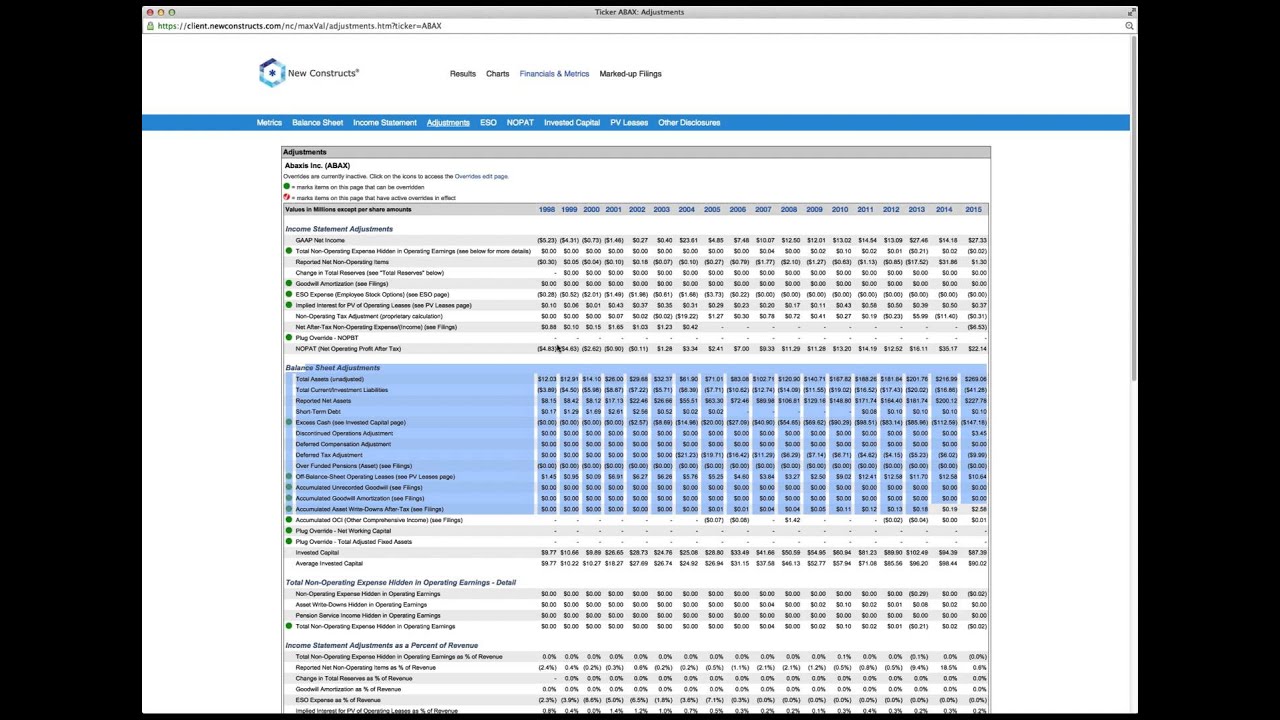
Hello everybody. Welcome to our latest webinar on how to find, or really to avoid, dangerous stocks. You know, I think that the dialogue on risk in many ways on Wall Street and on CNBC and the Wall Street Journal and certainly in sort of the self-directed investing world has unfortunately really kind of come under the spell Almost this sort of mental illness around risk and how the dialogue on risk has been really turned upside down, that there's this idea now that the more a stock goes up, the safer it is. And the last time that sort of thinking predominated that I remember was the tech bubble. And I remember speaking to some very intelligent investors salespeople at Credit Suisse. And I'd say, listen, who are you kidding? How can you tell me you're actually going to own or buy the stock? And he said, David, haven't you heard? It's called the Greater Fool Theory. Don't you know what that is? I said, no, I don't. He said, you buy the stock as long as you think there's a greater fool than you. As long as there's someone who's going to buy it at a higher price, and you buy it and then you sell it. And that's a game that works really well in certain kinds of markets, like the ones where people aren't really doing their homework and you've just kind of got a feeding frenzy in stocks. And you know what? We've had a feeding frenzy in stocks for probably, I don't know, going on a decade or more, you know, with a few, few rather large interruptions, but temporary interruptions. But for the most part, markets have been really positive. And so understanding risk has really not been important because you've had the Fed willing to write unfathomably large checks for a long time. You know, we thought, oh, the Fed can't keep doing this, the Fed can't keep doing this. Oh no, they can. And by the way, it's not the— not just the Federal Reserve of the United States, but it's the central bank in pretty much every country around the world. The export— the U.S. exports a lot, and a lot of what we've exported recently is, is, um, is central banking intelligence. And we learned our lessons in the '70s when we raised rates in the spirit of thinking we're doing what's right in the long— best in the long term. And it really isn't that way. What's really best in the long term— and this is not to— I'm not really criticizing the Fed. I'm saying that at the end of the day, the best thing to do has been to keep markets buoyant, to keep consumer sentiment buoyant, because we're better off getting through the hard times with a good attitude and not focusing on the negative. than we are just throwing in the towel and saying, let's just cut, let's just cut our teeth and deal with it head on and in the most direct and difficult way. And so my goal today is to make sure that everyone who's on this, on this call walks away knowing and believing that they've got a better understanding of risk and they've got a place, a research firm that's going to be honest with you about risk. And I would say, you know what, we're honest very often. We're honest every week with our Danger Zone pick. Danger Zone picks. I mean, you know, if you haven't read these articles, you need to because we're talking about risk with Twitter, Groupon, just 2 of the most recent ones. And by the way, we got a new one coming out Monday that's just as good. And this is, by the way, this chart that Kyle and Alan and Max put together is awesome. I mean, it's— this happens so much. Revenues are going up, profits are going down. And look, on the right axis here, they're not just going down, they're more negative, okay? And these are— and it's not getting any better. But where, you know, what we do a lot of times in terms of finding bad stocks, right? You know, there are a lot of ways to screen for these things, but I'm going to go into some sophisticated screens here where we're going to look for, let's say, all the companies that have A rating that is worse than neutral, right? And then I'm going to go in, I'm going to say, you know what, let's look for some major adjustment items like asset write-downs after tax. Let's look at, uh, Off-balance-sheet debt. And let's search across all companies. This is part of our institutional service, these detailed type of searches, right? So this immediately gives me a list of all the companies in our system that have a dangerous or very dangerous rating and also have a great— a large amount of write-downs, the largest amount of write-downs. Right, and a lot of off-balance sheet debt. 2 bad things. Here's a list, right? This is a great starting point, right? But probably what most people want to do, you know, is to look at the risk in their current portfolio. And the best way to do that is to have a portfolio, you know, create a portfolio. Let's just create a new one. We'll call it Review. And of course, as you guys know, you can create a portfolio with any kind of name or whatever you want to call it. And in this Review portfolio, we could put in any kind of tickers we want. So, right, this is for benefit of people who aren't always on the call. But just so you know, very quickly, throw in the stocks that interest you. Paste them in here and see what we say. And that's the quickest way to understand risk, right? And you want to understand why it's dangerous? Click on the details section. It will explain to you. When you see orange and red, this means that the company is on the very far end of riskiness with respect to these criteria. All right, these criteria aren't based on a normal distribution. We don't have an equal number of companies in each category. These are criteria that are set to identify stocks when their valuation is out of whack, meaningfully out of whack. We don't, we don't need to worry about things being normally distributed and having each other. No, no, I'm here to help people identify where the stock is getting crazy, right? And let's talk about specifics on stocks getting crazy because we talked about Twitter here. And, you know, when we talk about crazy, you know, one of the things we do is we start with, first of all, bad economics, which is what the team here is pointing out early on. Revenue doesn't mean profit, right? We're seeing that even though revenue has grown significantly for Twitter, net operating profit had moved in the opposite direction. So we're looking first, bad profits, right? The next thing that we like to look at Is valuation, all right? Because we all know there's a difference between a bad company and a bad stock. It could be a bad, bad company, but if the valuation already implies that it's already going to be getting worse, well, then you know what? There's not a lot of risk. But for Twitter, there's a ton of risk. To justify $37 a share, the company has to raise its profit margin from -32% to +5%, where LinkedIn and Yelp are, and then grow revenue for about 30% for the next 17 years, okay? So extremely large risk, extremely high valuation. Let's put this into better terms. I love it when Kyle and the guys do this because, I mean, this is— some people think, you know, we see these numbers and maybe if you're not a modeling geek like we are, you know, it doesn't mean anything to you. Like, oh yeah, 29% growth in revenue for 17 years. What's the big deal about that? Well, as an aside, that's a big deal. Few companies in the history of the world have ever done that. And it's harder to believe that a company that's not making money is going to grow that much versus a company that's already making money, because when you're not making money, you really don't have a business. But let's, let's put this into more understandable terms. What's the revenue per user? $129 a month for active users. So in order to achieve the $106 billion in revenue, which is what you get to when you grow 29% for 17 years, That means the company has to have 82 billion monthly active users at $129 per user. Hello? That's how high the expectations are. So I would say even if it were a good company or the profits were strong, the valuation's ridiculous. But the point is, this kind of analysis is a terrific starting point. This is what you get when you are looking at our rating system. You are getting the red flags on Twitter— bad profits, bad valuation. And what happens when you do this kind of work is you start to think, okay, well, you know, what's, what's going on here? What's the issue? Is there a business model flaw? And usually a lot of times there is. Right. And so what we'll also put into our Danger Zone reports and what I think our clients benefit from with this kind of research and insight is that starting backward from someone who's done the great research— and I'm talking about our own research. Yes, I know I'm being a little pat myself on the back. I apologize. But someone who's done the hard work to understand the true fundamental profits of the business, to understand the valuation of the stock. They're going to actually be the best source for understanding where the business flaw is. Because if you misunderstand the profitability of the business, if you think Twitter's profitable, then you're not going to go looking for a business model flaw because you're not going to think there is one. But we did understand there was a business model flaw. We went looking, we found one. It's actually pretty large. And that's the fact that the best interest of the users, quick and easy content, quick and easy access to content they're choosing, are not aligned with the best interests of advertisers getting more attention of users not necessarily looking for them, right? The more Twitter injects advertising into that, into your feed, into the experience that you as a user of Twitter have, well, the less value Twitter is to you. And if they don't inject more advertising, they're not going to have any chance of getting this negative notepad to be positive notepad. Right. Similar situation with Groupon. It's a broken business model. This one's a little bit more obvious. Well, first of all, you know, you've got significantly declining gross margins even while revenue's going up. Again, everyone's saying, oh, revenue's going good, but the margins are getting terrible, right? Profits trending down even though revenue's heading up, right? And Basically, they've got a business model flaw too, and mainly it's because they're in the business of selling coupons and there are no barriers to entry to selling coupons. And the fact that they're trying to get into the retail business and actually sell goods means that they are, as we reference up here, they're getting into moving from a low margin business to a lower margin business, from bad to worse, right? Transitioning away from its third-party coupon sales business towards direct business. Through the direct business, they act as a merchant, just like Amazon. And I think we've pointed out to you in the past, margins at Amazon aren't so good. The margins at any retailer aren't so good. The key to everything retail, success at everything retail, either you've got more scale or you've got some proprietary product. And I think it's fair to say coupons are not proprietary, and neither are any of the other goods that they're selling. So again, The work that we do to get you to stocks and we show that are very dangerous or dangerous, and we point out low quality of earnings, bad valuation. This is how you manage risk. This is how you identify business model flaws. It starts with understanding the truth about profitability and then aligning that with where the valuation is. And there's a lot of sophisticated ways to do it. You can do it with the simple screeners. Yeah. Right? Go in and say, okay, let me see all the very dangerous and dangerous stocks in the healthcare sector. Here they are. I can download these to a CSV. Right? And any of our users know that this takes— whoops, there it is— takes about 2 seconds to show up. There's the list, right? Copy that list, put that into a portfolio. There they all are, right? If you have an existing list in an Excel file, we'll Whoops, didn't show you. So I pasted that list into this box, hit Add, and those tickers are already in there because I did that when I forgot to change the screen. I apologize, but there they are. The key point here is I want you guys— want everyone to know that it's easy to copy and paste tickers in here, and if you— whatever you're holding, run it through. Understand why the company's getting a dangerous rating. You may disagree. You may have reasons why that dangerous rating doesn't matter. That's all well and good. But at least you know there's a false positive going on here. You want to dig into what that false positive is? You open a model. First thing I would do is go to the financials and metrics section. Check out the adjustments. See what kind of adjustments we're making here. Nothing too major on the income statement side. And actually nothing too major on the balance sheet side. So maybe it's trends? Return on invested capital is dropping. That's the issue. In a year when accounting income is actually going up. ROIC going down, GAAP net income going up. That's the issue. And when you look at the economics of the business, let's see, is it the NOPAT margin? NOPAT margin dropped in half. Invested capital dropped a little bit. But capital turns went way up, so that's a good thing. But ROIC overall went down even though EPS growth was 90% positive in 2015. That's where the economic earnings are messed up. Margins went down, EPS went up. We can tell you that quick and dirty. If you want to understand again more about the adjustments here, You can see GAAP net income went up a bunch, but not as much as revenue. And you'll see that in the NOPAT page where you can see total revenue went up by about $30 million, and NOPAT at the end of the day actually went down. NOPAT dropped. Even though net income rose up. So anyway, that's, that's exactly the details behind what it is we're doing and why our ratings are what they are. And look, nobody's more transparent than New Constructs. I've been around the country talking to the biggest firms in the business. Bloomberg, FactSet, Thompson, S&P, Capital IQ— nobody can do what we can do. We have unique technology. We have unique expertise. And it's not because we're that special. It's because we're the only people been doing fundamental research for the last 10 years. We're the only people hard-headed enough to keep believing in the fundamentals. And while we've been toiling away, the market's been focused on momentum, technical measures. We've been toiling away focused on building something that's special. Something that no one else can do. Reading annual reports is a lost art. I know. I've met with institutional investors around the world for the past decade. Nobody has time to do that. 200 pages of legalese and accounting jargon. Are you kidding me? So we're doing the diligence so you don't have to. Please ask me some questions. I like to take questions. If a stock is rated dangerous, why do investors continue to buy in? That's a great question, right? And this gets back to the dialogue about risk. You know, people don't understand. They see, for example, with Abaxis here in May, huge drop in the stock price. Is it cheap now? No, still expensive. Netflix, a great example. I don't know if anyone saw my last Interview on CNBC on Netflix. But it's a great example because we've talked about how it's been expensive for a long time, but it still goes up, right? Why do investors continue to buy in? Because they don't care about profits, right? A couple times ago when I was talking about CNBC, the guy who was the bull on the show opposite me literally said, who cares about profits? Nobody cares, right? It's about price action. Investors are buying into stocks that are really dangerous because of price action. Price action is going up, momentum is going up, well then, you know what? They're very willing to play the greater fool game. And that's a good game to play when markets are buoyant. And they may stay buoyant for a little while. Shoot, they've been buoyant for way longer than anybody thought. And you may have made a lot of money, but are you still willing to take that much risk? And what we're really here to help people do is just to be transparent about the risk. For advisors to be honest about risk with their clients. In order to be honest about retirement plan outcomes, you've got to be honest about the risk that's being taken. What's worked in the past doesn't always work in the future. Most people would agree that this bull market is closer to its end than its beginning. Which means you should care about risk. All that money you made, don't blow it up. So, great. Another great question. What are some of the biggest red flags we've seen in the time working in forensic accounting? You know, this is a great question, and honestly, it's sort of a moving target, right? So here are all the loopholes in forensic accounting. And for a long time, it was off-balance-sheet debt, and people got smart about that. The big one these days is the hidden items— non-operating expenses, non-operating income hidden in operating earnings. These are things in the MD&A and in the footnotes that people don't know to look at. They're often buried. in cost of goods sold or SG&A, and you don't know they're there. We're finding a ton of these, right? And this is one of the things I love to talk about. We're going to start tweeting about this and doing more work on this because, you know, it's— you know, our product is not just good for the individual investor. It's great for the individual or the retail advisor. But the power for us is in the business-to-business relationship, right? Why does Morgan Stanley not offer this to all their advisors? Why does S&P not use this kind of data to power their ratings? Why doesn't Goldman Sachs equip all of their equity research analysts with this kind of data to start with so they can spend their time looking at business model flaws in Twitter as opposed to trying to crunch the numbers to do scenario analysis, right? So for example, In the last fiscal year, before we did this work, I mean, when we wrote this report, I think we wrote this in the summer of 2013. Let's make sure, let's check. Yeah, summer 2013. So the fiscal year, in the 2012 fiscal year, we found 9,188 non-operating expenses hidden in operating earnings. In 2,000 different companies. So a lot of— it looks like, you know, you got about 7 per company. Anyway, interesting, right? We're— this is— our database contains 34,000. It happens a lot. It happens a whole lot. And the same is true on the non-operating income, right? Unusual gains buried in cost of goods sold, right? In the fiscal year 2012, we found 1,800 of them. We have over almost 10,000 at a value of $160 billion, right? So these are the big ones these days because, you know, a lot of things are moving to the MD&A. Does anyone have any idea why things were like hidden items and accounting shenanigans are moving into the MD&A? The first person to answer the question gets a free month of Pro subscription. I'll give you 3 seconds. Okay, time up. The reason is because, is because XBRL doesn't cover the MD&A. Now XBRL doesn't work in general, not even the income statement, balance sheet, or cash flow, okay? It doesn't work, all right? And when I say it doesn't work, I mean When companies are allowed to create so many custom tags that you can't actually use the XBR out of the box, and you got to go in and correct for thousands of custom tags in order to make the data work in a database, that doesn't work, right? Because if it's supposed to be machine language readable, that means the machine does it. If I have to have an analyst, we have to have an analyst go in and fix the freaking data, well then why don't I just have the analyst do that to begin with? Because I've already got a system. Now, I know for people who are doing everything manually, it's somewhat of an improvement. Yes, absolutely. But if you want to be smart about data, it doesn't do us any good. Now, we've got a system that's unique. We go in and fix stuff and have it fixed permanently. That's because we've got really special technology. Anyway, even if— despite all that, despite all that, we still have to have our technology because you know what? XBRL does not apply to the MD&A. That's why you're seeing more and more items get thrown into the MD&A. So how are our ratings different from other firms' buy-sell ratings? Well, you know, one thing I'll show you, our ratings are independent and fair and objective. Other firms are not. We've done some research on this, and the fact of the matter is— that's not the one. Morningstar ratings are terribly biased, just like Wall Street ratings. So that's the same, you know, that's the biggest difference. Our ratings are objective. There we go. We don't have a disproportionate amount of our ratings as positive as Morningstar does, right? Very small number. Negative, right? Neutral bonds, silver, gold. All right, almost all positive, yet I got some neutrals, right? If you look at the distribution of our ratings, man, when have we done this recently? All right, I can't think of where we've shown this overall, but you can get this data really if you just run our screener. I think you got everything in here. So you did a download of CSV. Oh, it only does 200 companies at a time unless you have an institutional subscription. So you could get this if we're just going to say all. I'm going to save that. Remove, remove. And so I'm just getting the overall rating. For all companies, and I could download this into a CSV. Here it is. Oh, whoops, I gotta open it. Sorry, hold on one second. And see here, we've got all 3,000 companies accounted for here. And what happened? Oh, here's my overall rating, right? So This is the file with all stocks under coverage, right? And so you can see going all the way up from 5 to 4 and dangerous out of 3,000 stocks we cover. Only 1,286 get a neutral or better rating. More than half of our stocks get a negative rating. All right, so that's one of the main differences. The other difference, I think, is, is just in the overall focus on risk-reward, you know, and looking at the truth about profitability and valuation and focusing on risk-reward and giving you what I believe to be the most important starting point for analyzing a stock. What is the profitability of the business? What is the valuation? Because no matter what I think about— the greatest cupcake-producing company of all time, the greatest whiz-bang technology of all time, the greatest car technology of all time— Right? If it's— if the stock is priced for the company to be able to invent the next shuttle to Mars, for which they're going to charge a million bucks a seat, at which point in time there's going to be a billion people willing to pay a million bucks or whatever, I mean, whatever the best-case scenario is, if that's already priced in, well, then you know what? I don't even need to pay attention. I need to start where the risk-reward is good, and then I'll go in and look at the business model. That's how I avoid blowing my portfolio up. Not falling prey to the propaganda streaming out of the news media constantly and on Wall Street constantly to buy this, buy that. Oh, this great new thing. Oh, it's so great. Oh, I love to wear this Fitbit thing. Oh, it's really cool. Yeah, it's going to take over the world. It's priced for protection already. There's no upside in it for you. And that's what we're here to help you with. It's this key starting point. For everything we do. So, you know, one other thing I want to do real quick, I'm going to go a little bit over because I like to highlight one of the key features of these models, you know, because a lot of times, you know, and I did a meeting earlier this week or a few weeks ago, we talked about La-Z-Boy. And one of the things that we talked about was, well, the questions I got was, because in my default scenario, Right. We're showing the stock to be really— we're showing the stock to be really expensive, right? And sorry that we lost the screen there for a while. The thing wasn't showing. That's my bad. I apologize. I don't know for how long that was going. So I'm going to go a little extra to make up for it. Stock looks really expensive, is a dangerous rating. And the question I got was, well, did you know that there's a turnaround going on? Does the model know that there's a management turnaround? I said, you know what? I don't know if any model can know that, because we don't know that the turnaround is actually going to be successful. But what I can tell you is how much of that turnaround is priced into the stock. So we went to the forecast page, and we created a couple scenarios. We looked at— Okay, say neutral. Let's say the company does 10% revenue growth for the next 25 years, right? 10% is pretty good. Hadn't done anything close to that since 2001 when it was in the 30s, low 30%. Otherwise, it's been negative, negative, negative, very, very low negative, negative, negative, 0, 4, 8, 2, 5. All right, 10%, that's positive. All right, let's give it a really good margin. Let's give it a better margin than it's ever had over time, 9%. We'll call that neutral. Alright, we'll also create an optimistic scenario. We put in 8% revenue growth, which is as good as any year except for 2013, they did that well. We're going to give them ridiculous margins, about 12% margin, which is way better than they've ever had. See what happens, right? So those are plugged in. And I'm saving us the step of putting those net entries in because I'm going to just shortcut to the takeaway. And you can see that basically the turnaround is pretty much priced in, right? If they do 10% revenue growth with the best-ever margin, they still got to do that for 6 years to justify $26. Do you believe they're going to do 10% revenue growth with the best-ever margin? I do. How about 8% revenue growth with a, like, 33% better margin than they've ever had before? Still need to do that for at least a year. That's already priced in. So takeaway, I think a lot of the upside is already priced in. The turnaround is already priced into the stock. It's another way to avoid being in a dangerous stock. Go in and see what kind of expectations are baked into that stock price. Have complete transparency. Let's edit the optimistic scenario. Instead of 12%, which we know to be ridiculous, let's go with 10%. This is how fast it is. I put in 10%, I save that, and in about 20 seconds or less, I'm able to look at a new scenario and understand the valuation of stock in that context. Now I ask you, how much time would it have taken you to recreate this on your own manually? Be honest. I don't know about you, but it took me, when I was doing models, building them manually, the quickest I could ever build a model, and these were tech companies where I did— where the annual reports were short and only did 5 years, and I was using a template that I created, and that template only took me about, I don't know, 10 years to figure out. 5. 10 years. 5 years to get right. So let's just pretend that you've got an awesome template. I couldn't do a model in less than 3 hours for 5 years of history. That's the, that's the fastest I ever did one. So, and then a model that can have multiple scenarios takes a little bit longer too. And the ability to display like this, that's another deal. But anyway, my point is in 20 seconds we took what takes at least 3 hours. Best-case possible scenario. So it's efficiency, and it makes being able to assess risk easier. That's the thing that new constructs is bringing to the table. Before, you kind of had to choose. Either I'm not going to invest, or if I am going to invest, I have to use shortcuts because I don't frankly have the time to do this kind of work. But with new constructs, you get your cake and eat it too. You can invest and you can do so with proper diligence. You can do so with transparency about risk. That's the value we bring to the table. Thanks very much for being with us today. Please fill out the survey.
More from David




Earnings Recap: Decoding Signals from SpaceX, Palantir, Merck, AMD, Caterpillar, McDonald’s, & More

Watch Our Earnings Recap: Market Heavyweights Apple, Microsoft, Amazon, Meta, Visa, and More



Earnings Recap: Top Insights from JPMorgan, Bank of America, Taiwan Semiconductor, Netflix, and More


The IPO Melt Up: How Smart Investors Use AI to Find Abnormal Investment Opportunities