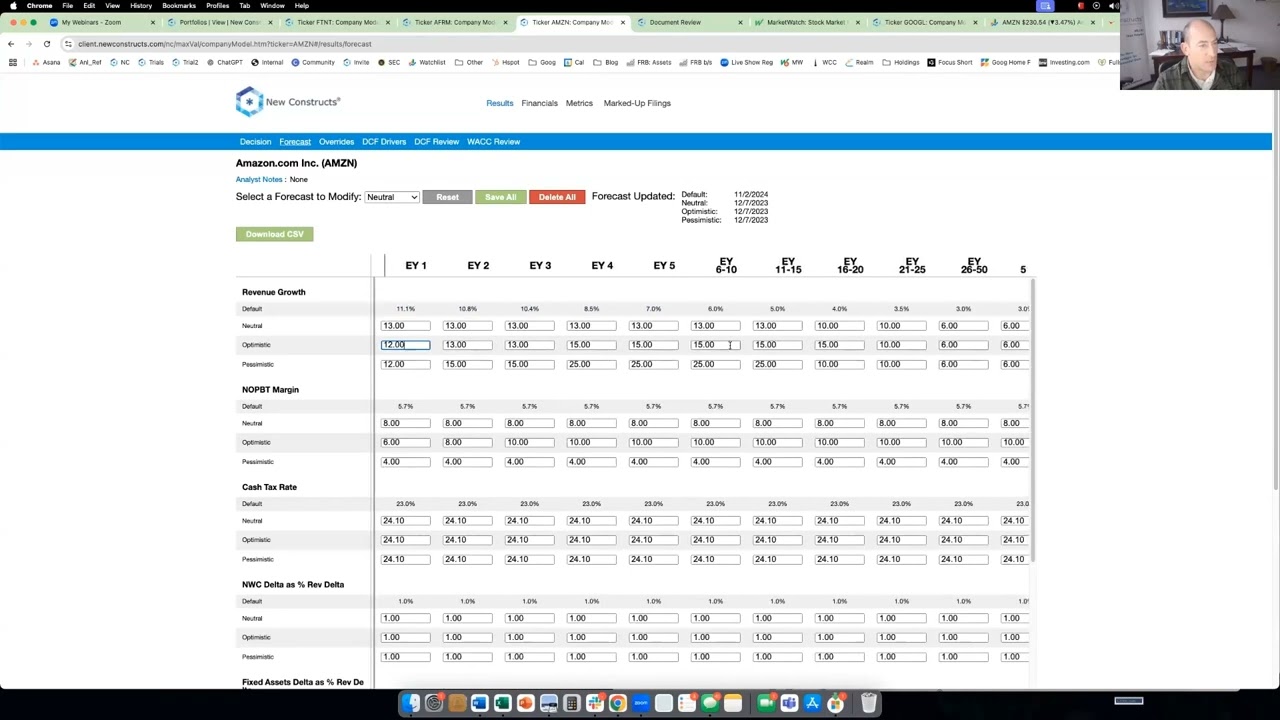
New Constructs applies DCF models to Amazon's $238 stock price, which assumes 11% annual revenue growth for 39 years and $33 trillion in future revenue. The valuation requires Amazon to sustain 65% returns on invested capital, a level few companies achieve, making the stock expensive relative to what's already priced in.
Chapters
Hello everybody. Welcome. We're expecting a big crowd, even bigger than normal because we'll be talking about Amazon, and I promise you I've got some Amazon insights that will likely shock you. As always, get your questions, ticker requests into the chat sooner rather than later. If we have time, we'll take some requests. And we will love always Q&A. Let's jump into the deep end. I think I've got some research that's gonna shock you about Amazon. While this has been a, a great business and they have sort of been one step ahead of the competition for a long time, I mean, let's face it, they were wolf in sheep's clothing for a long time, right? Oh, it's just a book company. Oh no, that was just cover for the fact that they wanted to take over the world when it comes to retail. Oh, we're just a retail company. Oh no, that was just a cover that we wanna take over the world with respect to logistics. Oh, we're just the logistics and retail business. Oh, that's just a cover for we're going to take over the world for computing power. I think Amazon's done a great job of reinventing itself. But I wonder 2 things. Number one, how much reinvention is really left in the market given the obsession we have already with everything AI, quantum computing, and blockchain? And 2, how much is already baked into the stock price? So let's, we'll take a quick look at the news on Amazon today. They did okay on earnings, nothing great, but people were a little disappointed in the AWS growth. Not surprising because there's a lot of competition there. Google, Microsoft, and others. And I think a lot of the big companies themselves are getting into direct competition. I think Facebook and Oracle and these other firms are building their own data centers, power centers, because they really want reliable access to computing power and AI. And that's a trend that's not going to change. But Amazon's taken a pretty big hit today, especially compared to the rest of the market. So let's get into what I really think about Amazon. Let's look at the model on Amazon. First, we'll take a look here at our rating. This is from a professional membership perspective. I'm also going to be demonstrating a lot of our really powerful institutional tools. So you'll get access to see how all of those work. But I'm excited really most of all to talk about our rating for Amazon. And I'm going to show you how our cutting-edge valuation tools, which we have for thousands of stocks and which drive this key criteria in the rating, is going to have some shocking information for you today. So if you've got friends who are interested in Amazon or colleagues or other portfolio managers, get them on the call right now because I'm going to show you something that I guarantee you've never seen anyone ever talk about with Amazon. And I'm going to give you numbers. I'm going to give you math to help you understand that this is not something I'm making up. There's no hyperbole. That's not what we have to do at New Constructs. We have the benefit of technology and superior information. As long as that's what you care about, we're the best in the world. Are we good at hype? Are we good at hyperbole? Are we good at meme stocks? Crypto? Sorry, not my thing. But if you want to know the truth, you care about fundamentals. You want to feel good about what it is you're doing, new constructs is your place. So Amazon, kind of a classic good company, bad stock. Good profitability, high return on capital. Not an amazing return on capital, but for a company of this size, it's impressive. Absolutely impressive. Huge value creator. But over here, when we get in the red, stock looks expensive. What does that mean? Well, it means that when we look at the future cash flows required to justify the stock price, which is how we do valuation work in new constructs, we look not at what the company's done, but what the company has to do to justify the price. So I'm not in the business of being a fortune teller or making predictions. I don't have to be. The stock market gives me a prediction every single day. This price Tells me what Mr. Market thinks. Mr. Market thinks it's worth $238. So what's the present value of future cash flows required for a model to generate $238 a share? What kind of forecasts have to go into a model to generate that number? Well, that's exactly what we do in New Constructs. This is one of our models. You get access to the model with this button for institutional clients. There's also, of course, details on all elements of the rating system. By the way, Harvard Business School rated our rating system superior to Wall Street rating. Ernst Young published a paper proving that our metrics are superior to everybody else's metrics. And then another paper in the Journal of Financial Economics proves that all the data driving all of this is superior. So we work really hard to be the best in the world, and we've got the proof to show that we are. So let's jump in here into the deep end with Amazon. Now, I told you that we were going to quantify the future cash flows required to justify the price. Here in this rating system, we boil it down to you in one metric here. This is the market implied growth appreciation period, or the number of years of profit growth required to justify the stock price. Now, this is where it gets interesting. Nobody knows the competitive advantage period of a company, just like nobody knows the real value of a stock. You don't have to. You just need to know what the market thinks and then decide how different your opinion is than the market. If you think Mr. Market has it right at $238, $239 a share, all right, don't mess with it. Don't play with it. If you think Mr. Market's too low, buy. If you think Mr. Market is too high, sell. Well, how do we really understand what that $239 per share means? We have to run a discounted cash flow model to quantify what the future cash flows are to justify the price, not to predict the price, but to quantify. So that's exactly what I did here with Amazon. Notice I created an optimistic scenario. We do this here on this forecast page where we go out and we create a variety of scenarios here for Amazon. The optimistic scenario is the one I want you to focus on. You can see consensus estimates are up here. We've got way better than consensus estimates going out for a long time on the revenue line. Then on the margin side, the pretax margin side, optimistic, optimistic here. You can see historically the company's been in the low single digits. Best ever, 7.1. Well, in our optimistic scenario, we're assuming that Amazon gets up to 6, 8, 10. It's a good number. It's a really good number for a very business in a competitive spot, right? And that results in return on invested capital of 8%, going up to around the 20s, the 30s, and a NOPAT margin in the optimistic scenario that gets up to 7.6%. So when we run that optimistic scenario, we can look at it here. We can see what it implies with respect to the value of the stock. And so you can see when you run this optimistic scenario out over time, in 39 years, The model gets a price equal to $236 or $237 a share. That's closest to, but still less than the current stock price. And so you see up here in the summary, the way to read this is that to justify $238 or $239 a share, Amazon's got to grow revenue at 11% compounded annually for 39 years while achieving a return on capital versus cost of capital spread of 35%. So the revenue growth number here, that might not be that impressive. It's kind of what they've done in the past, maybe a little bit lower. But for 39 years, oh, that's a big number in 39 years. I'll tell you exactly what I mean here in a second. 35.1%, that's also a meaningful improvement. Point is, we're looking at a pretty optimistic scenario here. So let's put some context around what Amazon's business will look like in 39 years if it achieves the expectations baked into the current stock price. Not my expectations, but the expectations baked into the current stock price. So let's see what that means. All right, we'll take a look here at the implied revenue. You can see where revenue's been in the past compared to where it's been in the past. Stock price is implying Pretty big number here. Turns out 11% compounded annually for 39 years—that's a big bleeping number. It's 33 trillion. 33 trillion. How big is 33 trillion? Well, why don't we look at GDP for the top 15 countries in 2024? 33 trillion, quite a bit bigger than the U.S. and almost as big as the U.S. and China combined. So, $33 trillion is a big number. What does this mean in terms of return on capital? Well, they've kind of been all over the place. It's been higher than lower, way higher. 64% is what it means in terms of return on capital. So, let's— why don't we take a look at where return on capital is across the S&P 500? This is a chart I put together. or, or file I put together using our dynamic data screener. I can demonstrate that later if you guys have questions. I went to the new Construct system and I pulled down for the S&P 500 a bunch of cool stats. I've got market cap here, of course, NOPAT margin, return on capital, dollar value of NOPAT, and total revenue. So where does 65% put Amazon? Would put it at 11 today. So 65% would mean that that they'd be in the top 11 of all companies in the S&P 500 while generating $33 trillion in revenue? I would say expectations are pretty high. Let's slice it another way. Let's look at the implied NOPAT. Where does that stand? So NOPAT would get up to $2.4 trillion. Well, let's search this. Let's rank the S&P by NOPAT, largest to smallest. Best right now is $109 billion. So Amazon would be going from $53 billion, they'd be getting up to $2.4 trillion. That's what's baked into the current stock price, my friends. 65% return on capital, one of the most profitable businesses in the S&P. And yes, in 39 years, $2.4 trillion. Yeah, you could say, yeah, David, these numbers are small because they're based on the S&P 500 today. 39 years from now, things would be very different. I get it, get it. And I'm not trying to be precise, just trying to give you a sense of when you look at our rating for Amazon and you see Red over here, 7.0, 100 years. I want you to know what that means, right? Again, I'm not saying this is a bad business. Great business, great credit rating, right? Free cash flow is a little off this year, but quality of earnings, great business. Done a lot of great things for the world. I mean, I use the heck out of Amazon. Unbelievable. And the way they've set it up, so like the shipping is super cheap, so you don't care. Like, oh, you think you need something, you just order whatever you need, it just shows up. Prices are good, lots of variety. They get everything. And so, and the convenience is off the charts. It's off the charts. And so, yeah, great company, but is it a good stock? Is it a good stock? People will tell you, David, you've, you've been pointing out that Amazon has been expensive for a long time. And that is true. What's different today? Competitive landscape. They're not getting the jump on anybody anymore. They got the jump. on large-scale computing power with AWS, Amazon Web Services. Got the jump on the rest of the market. Google, Microsoft, everyone else, they're playing catch-up. What are they going to get the jump on next? And I would submit to you that even if they did get the jump, whatever good news comes from, or whatever future cash flows come from whatever new business they get into, I believe that's already priced in. Glad for you guys to be with me today, and I'll look forward to seeing you next week.
More from David




Earnings Recap: Decoding Signals from SpaceX, Palantir, Merck, AMD, Caterpillar, McDonald’s, & More

Watch Our Earnings Recap: Market Heavyweights Apple, Microsoft, Amazon, Meta, Visa, and More



Earnings Recap: Top Insights from JPMorgan, Bank of America, Taiwan Semiconductor, Netflix, and More


The IPO Melt Up: How Smart Investors Use AI to Find Abnormal Investment Opportunities