The Great Rotation of 2026: Why the Easy AI Trade Is Over & Where Smart Money Is Moving Now
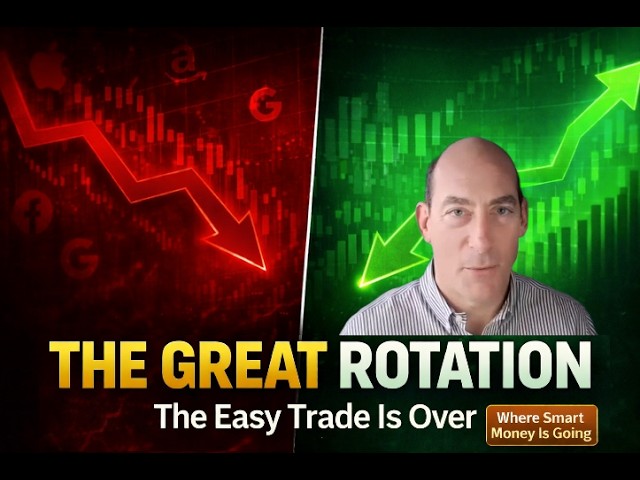
In this 2026 webinar, David Trainer, founder of New Constructs, argues that the once‑dominant "buy any AI stock" narrative has collapsed as earnings season revealed massive valuation distortions and hidden accounting tricks. He explains that smart money is rotating out of over‑valued mega‑cap AI champions and into fundamentally sound sectors—primarily telecom services and consumer non‑cyclicals—where real earnings quality and free‑cash‑flow metrics are attractive. Trainer showcases New Constructs’ proprietary AI platform that parses every footnote and MD&A of U.S. public filings (over 3,000 companies, millions of pages) to compute core‑earnings, economic earnings, free‑cash‑flow yield, and other proprietary scores. He cites the platform’s track record: indices built on its data have outperformed the S&P 500 by 27‑32 bps over five years, and its stock picks have beaten buy‑side analysts and Wall Street consensus. The presentation also critiques generic AI tools (ChatGPT, Perplexity, Claude) for merely echoing popular narratives, and highlights the firm’s academic validation (Harvard Business School, MIT Sloan, Ernst & Young, Journal of Financial Economics). Finally, Trainer offers a limited‑time professional membership (with model portfolios, sector ratings, API access, and exclusive reports) as a way for investors to gain the same data‑driven edge.
Chapters
Welcome everybody. Good to be with you. Glad to see you guys all out there. So today we're talking about the great rotation of 2026, why the easy trade is over and where the smart money is moving now. This is a really unique time in the market. We're getting more data than we'll get all year long. And we're seeing a significant churn and rotation. The big leaders that we've seen leading the market for years are stumbling big time. And Wall Street is moving behind the scenes based on data and information that no one else has except for us. Disclosures and disclaimers. We are not investment advisors, tax advisors. Go to someone else for that. We are here simply to provide research and insights. We want to make you smarter. And I want to hear from you in the chat. Put your tickers in the chat. I'll review those at the end, time permitting. Please let us know if you're a professional or individual investor, and if it's your first time with us, we want to know that too. We especially care about making sure our first-time investors are treated with unreasonable hospitality. Right now, here's the big message: we are at a critical juncture. The market is telling you one story, but the data is telling us another. The gap between the two is where fortunes can be made or lost. Q4 earnings season is almost over. We're getting full year 2025-2026 fiscal year-end data. Footnotes are in high season. This is the one time of year you're going to get the most footnotes data. We're seeing all kinds of new crazy accounting tricks. Our current pro members have already seen a report that talks about a huge half trillion dollars accounting trick that we've exposed, and it changes the game for the AI race. This data is coming in fast and furious, so it's a very exciting time for us at New Constructs, and it's delivering huge insights. We're smack in the middle of the most important data event of the year, and we're rigorously analyzing for 3,000— over 3,000 10-Ks, 10-Qs, or about 600,000, maybe even a million pages of information. All that's to update financial models and stock ratings with the freshest, most detailed data and analysis in the world on U.S. stocks. And this is what gives you a sharp advantage over everyone else for your money or your client's money. Now, we know earnings season has a huge impact on market movement in stocks. And we have the best technology hands down to identify stocks that offer upside and carry too much risk. There are 800+ stock rating changes happening in these few weeks during every footnote season that happens, during every earnings season that happens, even more on average during footnote season or 10-K season, which is what we're seeing now. As an example, just in the last month, 5 new stocks were added to our Most Attractive Stocks list. 9 new stocks were added to the Most Dangerous Stocks list. 6 new stocks were added to the Executive Comp Aligned with ROIC Model portfolio. I think there's only 15 stocks in that portfolio, so almost 50% turnover. 4 new stocks were added to the Safest Dividend Yields Model portfolio. And 9 new stocks were added to the Dividend Growth Stocks model portfolio at this time last year. We expect the same thing to happen in this month. The ratings you saw in December and January, they're changing completely because the company's financials have changed. And we have the only models that capture that with true integrity and completeness. Because we have the only AI that reads the footnotes and calculates real core earnings. And as we analyze the latest filings, we hear one common question: how can I protect my hard-earned capital and find the best stocks to profit from in this market? Great questions. And that's exactly why you're here today. We are going to hand you the AI to answer those questions and to get you a true sustainable edge when it comes to investing. If you don't know me already, I'm David Trainer, founder of New Constructs, author of Modern Tools for Valuation and The Valuation Handbook. And I've spent 25 to 30 years in the investing business and learning and building AI. After a few years on Wall Street, I saw the writing on the wall. I saw how the games were played and decided to build something better. A firm that could give people honest, true, clear answers, because that's not what Wall Street's in the business of doing. And over the last 2 decades, I've been perfecting an AI-powered tech stack to deliver superior stock research that digs deeper and produces alpha that beats the market. So this isn't just better research. It's better research that works because it produces real alpha. The alpha comes from, from proprietary data. This is data nobody else has. I don't know if you guys have seen that big article that went viral on Twitter about how software stocks— are we cooked? By Nicholas Bustamante, FinTool. Great guy, very smart guy, recommend you follow him. He talked about 10 moats for software businesses. Almost all of them were cooked except for one: proprietary data. If you have data that no one else has, you have a moat. If you don't, you don't. We have proprietary data that no one else has. And even better, we categorize that data in a way that produces alpha. That's why Google chose us to build the only AI they've ever built for investing. And that's why that AI works. And that's why our research works. Because we've got better data and a better ontology that's proven to generate alpha. We're getting the data that gives us the true economic reality on what's going on with companies. And the outperformance of our superior fundamental research speaks for itself. Our stock picking has beaten 16,000+ buy-side professionals for 56 straight months to get the number 1 spot on SumZero. 56 consecutive months. I don't know anything that's actually happened for 56 consecutive months in our world. And it's in multiple categories too. We got consumer discretionary, we got industrials. We're moving up the ranks a bunch already this year as well in a variety of categories. Here's another thing, folks, no other research firm can say. Our research has been vetted and validated by some of the most prestigious institutions in the world: Harvard Business School, MIT Sloan, Ernst Young, The Journal of Financial Economics—they've published papers proving that our data and our research is superior and provides abnormal stock returns. That's the academic way of saying novel alpha. Name another research firm that's done that. Put that into the chat, and if it's true, I'm happy to give you a free report of what for one of my model portfolios. Even better than academic research, the outperformance of the actively traded indexes based on our research proves our value-add for you. This isn't just hypothetical. And by the way, papers from Harvard Business School and MIT Sloan professors aren't pure hypothetical either. Those guys do diligence. They can't get it published in the Journal of Financial Economics if they don't. So it's better than hypothetical, but Nothing beats live stock market track record. And that's what you get. The Core Earnings Leaders Index beat the S&P 500 by 900 basis points last year, 27 to 18. Not too bad. Over the last 5 years, beating the S&P by 32%. Then you've got our very attractive stocks index, stocks that just holds all the companies In our system that get the very attractive rating. It's not many of those. And they outperform by 37% over the last 5 years. Year to date, this one's up big. The core earnings weighted S&P 500 index beat the S&P by 23% over the last 5 years. That's a huge amount considering it holds all the same stocks as the S&P 500. It just weights them differently. That's what I love to say about this one. Someone else can choose the stocks. We'll still outperform you because we're going to weight those stocks based on what the market cares most about, which is real earnings. Keep in mind, all these indices are based on our superior data and research. These indices are produced and managed by Bloomberg, so they're not available for the public. You can't invest in them. But The research that they're driven on is something we can get you. For example, our focus list stocks, the long and short model portfolios from 2021 to 2025, our long stocks focus list beat the S&P 500 by 12%. The short model portfolio beat shorting the S&P by 50%. By the way, those are both doing very well this year as well. Look, I don't think you're here by accident. You didn't just stumble into this meeting. You're here because you sense something's rigged. You're here because you sense the market's not necessarily what it's cracked up to be. You're here because you're seeing change and churn in a way that you haven't seen in years, and you're wondering, is there something else out there that's better? Is there some way that I can be in front of this as opposed to a victim of it? And today I'm here to help you navigate this puzzling market and give you the answers needed to make money. Let's get to it. For 18 months, the narrative was AI is going to revolutionize everything. Buy tech, buy all of it. It's all AI. Everything's AI. Don't be discriminating. Don't be discerning. Just buy it all. Wall Street pounded this narrative relentlessly, relentlessly. FOMO became the dominant emotion. You got Dan Ives wearing his funny clothes, Jim Cramer, buy, buy, buy, Cathie Wood. The answer was the same. The message was the same. Buy it all. It's all going up. If you're not in tech, you're making a mistake. Valuations got stretched. People said, oh, this is crazy. They just got more crazy. It didn't make sense, but people said, you know what? I don't necessarily need to make sense as long as I'm making money. That works for a while, even for companies and stocks that are trading at 200 or 300 times earnings. They're growing fast, but they're not growing fast enough to justify the multiple. And really, are they making any money? Is anybody asking? Are they making any money? And for a while, the narrative was strong enough to override the math. Yeah, it's expensive, but it's worth it for AI exposure. But then earnings started coming in here in 2026, and the company started talking about how much they're investing in AI. And we all of a sudden realized that $650 billion a year means those profits that were going to once go to me as an investor are going somewhere else. And by the way, they're all plowing in. And we've got some really cool cutting-edge research coming out for existing Pro members. They've already seen it. And if you want to become a new Pro member, you can see it. But it is, it's a humdinger. Half a trillion dollars in accounting tricks hiding cash flows. That's going to change the AI race in a big way. But we're already seeing in general, the competitive landscape is changing. Suddenly, the narrative about AI is is cracking. And here's what happened to these AI champion stocks from their 52-week high. Look at that. I mean, some are down 80%. You're lucky if you're down 40%. Could be as much as 85%, 70%. Right in front of our faces. Kept happening day after day after day. Year to date, it's pretty disastrous for a lot of these stocks. Most of these stocks, all danger zone picks. If you had access to our Danger Zone stock reports, you'd have known. A lot of them on our Zombie Stocks list as well. Many of them on the Most Dangerous Stocks list. Why? Because even if they were somewhat profitable, they were super expensive. Super expensive. Way too much risk. So we're seeing trillions of dollars of market cap lost in just a few months. That's a pretty sudden change. What's Wall Street saying? Oh, I'm sorry, we had it wrong. No, they're not really saying anything. I mean, Dan Ives is still out there going, oh, so Jim Cramer. They're just saying, you know, double back down, just like they said with crypto, just keep doubling down. This AI solves everything narrative, not so true. Colliding with reality in a way that's crushing investors. And we're bummed about that because we were out there telling people, be careful because not every company benefits from AI. I mean, I've been in the business long enough. I was at Credit Suisse during the tech bubble. If there's one thing I'm seeing that reminds me of that, and I talk to my buddies who've been around in the business that long, it's like, oh my gosh, not all these companies are gonna be winners. Yes, it's gonna change things. The world will never be the same with AI. Productivity is gonna, I think, really skyrocket. It's gonna be really interesting. But not all these companies are gonna be winners. That's not how it works. Winners take all. A few winners take all. By definition, it's just a few companies. The market is not just correcting. So even the potential winners are feeling the pain because investors are finally, oh my gosh, wait a second, we've been investing on hope for a long time. It's time to rotate, to rotate. And they're rotating hard and relentlessly. The easy trade of buy any tech stock and make money is over. The core issue, valuation distortions, stocks trading at multiples that are unrealistic. 150, 20, 30 times revenue. Not good. Palantir, 300 times forward earnings. Not good. You know, it's just silly. Why take that kind of risk? Now, here's the other thing we want you to make sure you understand. Corporate insiders are dumping shares at the fastest pace in 5 years. Look, friends, you know, don't take my word that the market narrative is changing. The insiders, the single best indicator of near-term performance of a stock, insider selling. Having corporate insiders corroborating our thesis here, that's huge. Look at that huge jump, the biggest since going back to COVID. And this signal, what's it saying? These super high valuations, just not sustainable. I think we're seeing a 2-tiered market. Tier 1, the mega-cap safe bet stocks, Mag 7 and AI. And then there's tier 2, everything else— telecom, financials, consumer non-cyclicals. Tier 1 is expensive. Tier 2 is undervalued. Tier 1, maybe some fake profits there. That's in that report I told you about. Tier 2, they got real numbers. They got real profits. What do people think when the market starts to crumble? What's the life raft they jump to? Real earnings. And that's what we do better than anybody in the world. With our core earnings research. So the smart money is rotating from Tier 1 to Tier 2. For the last 18 months, fear of missing out created the following: if I don't own Nvidia, I'm making a mistake. They want you to believe that. But FOMO-driven investing nearly always ends the same way. You don't buy at the right time, you hold through the decline, you realize you made the mistake. And we're now seeing classic value trap behavior. Wall Street still rates these AI champion stocks as buy or hold. Whatever you do, don't sell. The logic? These are great companies with strong growth potential. They're going to power through it. And guess what? The narrative doesn't change until the stock goes down. Look at the history of Wall Street ratings. The best time to buy a stock on Wall Street is when analysts change their consensus rating to sell, because that's when it's bottomed out. I'm not kidding. Check the research, academic research on that front. So the problem is here, like, if all this growth potential doesn't quite materialize— and by growth, it has to be profit growth. Revenue growth works for a little while, but in the end, it's got to be profit growth. So these companies can't become great. They just become overpriced stocks. And when people realize that, they fall hard, just like those charts I showed you a minute ago— 70%, 80% in just a few weeks. That's what happens in a market that moves as fast as this. AI is making everything move faster. Right now, we believe real value lives in sectors that Wall Street has ignored. And as you can imagine, our database rates the technology sector as unattractive right now. Here it is. Now, I want to take a second to explain what's going on here. So first of all, quality of earnings is going down. We're going to publish our most recent report on this topic, hints at what's going on. Talk specifically about cash flow, but quality of earnings headed down in a way that we've not seen in tech in decades. Tech has been the undisputed heavyweight champion of profits. And that's why the Mag 7 in some ways was justified for a while because they deserve to be the majority of the S&P because they're the large majority of the earnings for all those companies. But what we're seeing in the data is, look, this top quintile ROIC, it's been really high for a long time. What's happening now? Fourth quarter last year, beginning of this year, down, down fast, and valuations expensive. So part of the benefit of, of being a pro subscriber, an inside user of my own data, is that I can see trends into the future when we can combine red with yellow here. It's a bad trend. This yellow, a good leading indicator that this return on capital is coming down. The challenge here is that these returns on capital are so high that— and higher than everyone else because tech has been such a leader— that you don't see it coming down as soon as you might otherwise. This earnings season opened a window. This is why— this is what you need to hear right now. This earnings season opened a window of opportunity. For you, because old winners are becoming losers. New opportunities are emerging. Capital is rotating out of the expensive, super-rich names and rotating into fundamentally sound stocks. The window's open right now, but not for long. Now, as we promised, we're going to reveal the 2 most attractive sectors winning from this rotation. It's important to note a couple of things before we dive into this research. With market-moving catalysts emerging daily, sector ratings are bound to change. So look, what we're showing you today could change. I mean, this is a dynamic market. There's good and bad in every sector. Just because the rating for a sector is good doesn't mean every single stock in that sector is good. You got to be discerning. You can't paint every stock, every sector, every group with the same brush. This is why last year, about a year ago, we started looking for AI stocks that we could get behind. Guess which AI stocks are outperforming those years? Those stocks. Because we didn't want to just be negative on all AI stocks. Let's find some that still look good, that people haven't figured out yet. We did. Guess what? Those are the ones that are still working. So the point is that there are attractive stocks in bad sectors and there are unattractive stocks in good sectors. Our screener is the best in the world. You can determine the best and worst stocks within the best and worst sectors. You can see it all based on the best data and criteria in the business. Let's dive in. Telecom services and consumer non-cyclicals. The last time we saw telecom rank this highly, I don't remember. But guess what? Some of these telecom companies, they just churn the money. I mean, they just make it. They're making it all day long and people aren't giving up cell phones. All right, now the cell phone might get better and the pipes that are sending data might have to get bigger because what is AI going to do? Demand more data, demand more computing power. So these devices and all the interconnected computers, they need bigger pipes, they need bigger plumbing. Telecom stepping in. Consumer non-cyclicals undervalued, shunned. A lot of stocks on our attractive stocks list and focus lists. They fall in this category. The market's been missing these stocks for a long time. Let's take a closer look at the best-ranked sector in the market right now, telecom services. Doing a deep dive here. So we're seeing this is the top-ranked sector, and here we're seeing that, look, strong quality of earnings, not the greatest return on capital. This has not been the sexiest sector, but it's cheap. Check out our analyst commentary on this. As a pro subscriber, this is what you get. You get to see outlook, investment recommendation, and guess what? We'll give you the details. We're not playing around like, oh, hell, there's a bunch of great stocks. You can actually break down this analysis into all the sub-industries within the telecom sector. I'll show you in a second. But then also we'll show you find the best stocks, avoid the worst stocks, the best ETFs, the worst ETFs. Same for mutual funds. We're here to show you the information. We're not hiding the good stuff. We're giving it to you. Now, let's analyze the second rich sector, consumer non-cyclicals. You can see here strong quality of earnings, a little bit more expensive, a little bit better, you know, a little bit better profitability. That's why it's not number one. But this is going to tell you that this is where we see the most good stocks right now. It's a great leading indicator to that. And you get the same detailed commentary and analytics for this sector as you would the other sector. Again, get the details. We'll show you the best and worst stocks, ETFs, and mutual funds. All right, let's do a demo here. Let's go to ratings. Let's go to sector ratings. Here's sectors. So what we showed you just a second ago, telecom and consumer non-cyclicals. And let's take a look at the technology sector again. We can do the breakdown on any one of these subsectors. And here's what we saw before, right? Earnings neutral. This used to be rising EE as well. Used to be all green and just some yellow and red. The shift from green to yellow here, very telling. And then the valuation for the entire sector, really pretty nutty. And just as bad for the S&P. But with the S&P, you got a little bit better quality of earnings because the S&P's got some stuff that's not tech. Here's the commentary. Super simple. If you want to jump over to the screener, bam, there it is. Tech stocks already pulled out for you. You want to say, listen, I only want the ones with a very attractive rating and the strongest quality of earnings and a GAAP earnings distortion rating. Bam. Not a lot of companies, folks. That right there is pure gold. The amount of time it would take you to do this work across the US stock market, it would cost billions, I think, to do it with this level of detail with GAAP earnings distortion score. That's the same earnings that drives the outperformance of an index that beat the market 27 to 18. Are you kidding? This is unbelievable information right here. So back to the sector stuff. So I love the sector analysis because it's not just the high-level stuff that's super informative at the sector level, but you can go in and look at every single little subsector. Electronic equipment and parts, that's a little bit better. Software, IT and solutions, that's a little bit better. If you want to add this sector to your portfolio, you can add the entire sector. We're going to call this training sample, and we're going to come through here and say, let's Add that sector. So when we come back and look at portfolios, training sample, we got that sector in there. Then we can add a bunch of stocks. Yeah, APL. Anyway, you get the idea. You can quickly add additional stuff to it. Going back to our ratings and the sector stuff, super ability to get the high-level view, to get the best and the worst stocks, to go straight over to the screener. To see how the sector falls out in terms of number of stocks, right? And then the market cap, right? So there's a lot more attractive stocks in terms of number, but they don't get a lot of capital. Quick summary of the best and the worst stocks. Here's how economic earnings and reported earnings are going. Here's how return on invested capital is looking. Look, it's flattening out. 2-year average free cash flow, huge declines. Warning sign, warning sign. Aggregate free cash flow and enterprise value. Not a great chart because the value's so huge, so you can't even see free cash flow. And then aggregate market cap and economic book value. So, you know, you see free cash flow going down and yet enterprise value going up. Bad sign. Bad sign. All right, let's get back to the rest of our training. So if you're feeling uneasy about all this, Especially about your portfolio? I think you should be. Because the tools that most investors rely on simply aren't designed to cut through this kind of noise and misdirection. So you may be wondering, why not just use the new AI tools to find the best stocks? Well, let's try that. Let's explore that for the tech sector. We asked 3 different AI tools, what are the best tech sector stocks? Here's what GPT said. Nvidia, Microsoft, Apple, Broadcom, Arm, CrowdStrike. You can see the list here. Anything surprise you? Yeah. How about when we asked Perplexity? Almost all the same stocks. And Claude? All the same stocks. Undifferentiated. Once we went through that exercise, we noticed a few things. None of these stocks get an attractive rating from New Constructs. Second, there's nothing to back this stuff up. When you look at what the analysis is based on, you ask them, It's market cap and momentum and large companies. They're just repeating what they see most often on the internet, which is the same stuff that's driving all the misleading headlines. Keep in mind, New Constructs, our roboanalyst AI and stock picks are based on proven research and information, proven in the stock market with live trading, proven by some of the top professors and investors in the world. At Harvard Business School, Ernst Young, and the Journal of Financial Economics. So we can confidently state we know how to determine whether a stock is truly a buy or not. But what we notice from the free AI tools such as ChatGPT, Perplexity, or Claude, they tend to select stocks that are big-name mega-cap stocks, often overvalued companies that were— they're already up big. No news there. Hey, Nvidia is great. They're not finding stuff that nobody's talking about. They're not going to give you an edge. They're just going to parrot back to you what the rest of the market is saying. None are attractive right now. Legacy AI tools, they're just FOMO machines. Wall Street loves that. There's no real value add. The good news for you is that there is a new technology that can pick the right stocks. And it shifts the focus. from narratives to verifiable and proprietary financial data. Let me show you exactly what I mean, because that, in my opinion, is how we protect your portfolio and find the right stocks while others are being misled. Intelligent investing starts with fundamentals, including footnotes, not the surface-level metrics everyone else uses. And we've developed a cutting-edge AI that transcends the system and the noise systematically. That's why Google Cloud chose us to build the only AI agent for investing that it's ever built. Our AI ingests and analyzes every page of financial reports, 10-Ks, 10-Qs, but especially footnotes and the MD&A. Guess who else tracks the MD&A? Just about nobody. It's built for truth-finding, not narrative spinning. And when I say tracks the MD&A, I mean systematically analyzing it or pulling data from it. Just about nobody. Our AI is built for truth-finding, not narrative spinning. It exposes bad information legally hidden in the company's footnotes. Here's a great example. And this is one of the reasons why Bloomberg, Google, Harvard Business School, the Journal of Financial Economics, Why they work with us? Because no one else can be this transparent. No one else is going to take you straight to the footnotes where they find the data that can be market moving. You know, this is on page 113. How many of you have ever actually read a whole 10-K back to back? All right, raise your hand here in the chat. How much did you enjoy it? And how many times There we go. And how many times have you done it since? I know a lot of people have done it once and they're like, I'll never do that again. I saw a lot of those on Wall Street, a lot of junior analysts. As soon as they could get out of the business of analyzing 10-Ks, they got out of it. And if you still do it, then you know better than anyone how valuable our research can be. Because if you still do it, you know you can't do it on as many stocks as you'd like to do it. Now let me share 3 key ways our clients leverage our AI to pick the right stocks. First, we're updating 3,000+ company models with the latest financial data. These model updates drive hundreds of ratings changes, and ratings changes can identify winners and losers every day we get new filings. And by the way, we get new filings almost every day of the year. Not all of them have the same fiscal year. Not all of them report on time. Some of them report early, some report late, some have different fiscal year ends. But here's what happens when we parse these filings. As an example, Motor Car Parts of America upgraded from neutral to attractive after we parsed this 10-K last year, was up 60% in the next month. Dell Technologies up 32% after we parsed its 10-K. Proof is in performance. Second, our clients enjoy the most rigorous fundamental analysis in the world on US stocks. Here's a peek at the screener inside our membership. I showed you this a second ago. The most powerful tool in the world for US stocks, hands down, no questions asked. You can screen the entire market and find the best and the worst, and from there dig in as deep as you want. But to screen the entire market, we've turned the whole screening business upside down. When I was in the business of screening, the idea was I'm going to use these rough tools because I can't get the data right at that kind of granularity for that many companies. So I'm going to use these really rough tools to get the universe of companies I should focus on down to a small enough number that I can go do all that work by manually. Well, when we did all that work per company extremely diligently, then you can screen on that stuff. It's amazing. That's why we have so many model portfolios that do so well. If you wanted to try to replicate what we're doing on just one company, I think that costs you $50,000. Yeah, that's what you'd have to pay a Wall Street person to get that on one company. Now, even then, you really wouldn't be able to have a rating system because a rating system on one company is not a rating system. You can't like rate a company unless you can compare it to others. This consistency that we do this across so many companies. Means you're getting results you can trust across thousands of stocks. So the person who raised their hand to say that he still reads 10-Ks, and his comment to me is, I think inflation makes your $50K estimate low. So more than $50K to do this, coming from someone who's actually done the work. That says a lot. So the point is, this kind of diligence and consistency trusted across thousands of names, it's amazing. To give you the context of how our proprietary research scales, I'd like to bring up Warren Buffett. Let's have some context here with Warren Buffett. Experts estimate that he's read around 100,000 financial statements in his 70-plus career. At New Constructs, we've done 2.5 times that. Folks, that doesn't count the AI work it does on its own, where the AI tests itself because we say, hey AI, go see how you can analyze the financial statement and then grade yourself on how our expert humans Have done. And those expert humans, this is a perfect financial statement, reviewed 1,000 times. We're like, sure, it's perfect. And then the AI iterates until it gets better and smarter. It's like, oh, I missed that. Okay, I need to add that to my system. Right? That's our training data. That's, that's the data that no one else has, folks. It's how to find these critical data points in the footnotes and give them real value, put them in the right spot in the database. No one else has done that. And that's what we've been building for 20 years. Good news, it's amazing for you. Bad news for me, it was a lot of hard work, but it's paying off in a huge way. So new constructs, you're talking about 2.5 times as many financial filings. When I say paying off, that's a lot of work to do what Mr. Buffett did for a long time. And I think, you know, it's fitting as Mr. Buffett retires and moves on, it's time for an AI to emerge to do what he did because his leadership will be sorely missed and people need a touchstone. They need a place they can go where they're going to hear things they know they can trust from someone who they know has done the work. Third, we maintain true independence. We have no investment banking conflicts, and it shows up in our ratings. Less than 4% of our stocks get a very attractive rating. Less than 13% get a very attractive or attractive rating. Not so true on Wall Street. 96% of stocks on Wall Street are buy or hold. Remember I told you the The best time to buy a stock according to Wall Street ratings is when it gets a sell rating. You know what? See how it's flipped? 4% of their stocks get a sell rating. 4% of our stocks get a very attractive rating. Maybe there's some to that. Don't forget, less than 4% of stocks are responsible for all of the wealth creation in the stock market since 1927. That 4% number is probably a really good number. The reason Wall Street guys have somebody buy and buy ratings is because their paychecks depend on it. They make no profit from the research. They make profit from relationships with companies. Do you think companies give them investment banking business if they have a sell rating on the stock? Nope. And according to recent data, 50% of Wall Street ratings for stocks are listed as buy. Look at that. Buy, 50%, even now. Even now, here are some specific recent examples where Wall Street rated stocks as buy while our rating system disagreed. In case you wanted to know if I was just making all this up, here we go. Let's talk about Coinbase. A buy rating over the last year for the most part. Look and see, buy or hold, one sell. It was unattractive or neutral for us all this time. Guess what? Down 44% in the past year. Who was right? How about GitLab? Buy or hold? Large majority of buy ratings. New constructs? Unattractive the whole time. Down 58% over the last year. Who do you trust? Wall Street? Reddit? According to Wall Street, Reddit was a buy or hold this year. Look, large majority of buy, strong buy. Unattractive new constructs the whole time. Down 39%. Who do you think's doing the work? The value of our AI solution is proven by our performance. Let's not forget the Core Earnings Leaders Index beat the S&P by 32% over the last 5 years. The Very Attractive Stocks Index beat the S&P by 37% over the last 5 years. The Core Earnings Weighted S&P 500, right, the Enhanced S&P 500, same stocks, we can beat it by 23% over 5 years. I think there's some value in core earnings. Our AI data-driven system allows clients to cut through Wall Street's misleading narratives and identify stocks where the fundamentals are strong regardless of the noise. This should be written in stone on the New York Stock Exchange. This is what AI should be doing for investors. And conversely, we can identify overvalued companies where where the narrative overstates the financial reality. If that's not the most important thing to have in your world of investing right now, I don't know what is. It's what Warren Buffett's been saying for years, for decades. You can't predict what stocks will do in the short term, but you can predict what businesses will do over time. Just take the 20th century. The Dow went from 66 points to 11,500 points, and you had 2 world wars, a Great Depression, flu epidemics, American businesses will do fine over time. The only one that can cause you to get a bad result in stocks is yourself, and that is by trusting the media. So how do we do it? What's our secret edge to outperform even the most chaotic markets? Well, if you've been part of the community for a while, you know our edge is our robo-analyst AI, same AI that Google Cloud chose to build the AI agent for investing called FinSights. So how do we do it? Well, we use the first, best, and only AI agent for investing. This robo-analyst technology gets the data, builds the models, and reveals the truth. Why do you want machines doing this kind of work? Because it's complicated. And when you try to scale complexity, humans make mistakes. Because scaling requires people to do sophisticated things a large number of times in a row, and nobody does that. It's one thing to put caps on tops of bottles like in Laverne and Shirley, right? 100 times, do that all day. It's blah, blah, blah. But you're talking about complex stuff. And even today, they don't have humans doing that work on bottles. Those are all automated. Why? Because machines do these things better. The key is that you can only trust a machine if it's programmed to do it right. Just like you can't trust AI based on the internet, you can't trust machines to pick stocks if they don't have the best data. They don't have data that gives you an edge. Here's what our ratings look like. It's very simple. Green is good. Red means bad. We focus on quality of earnings and valuation. 5 key metrics. Economic earnings versus reported earnings. This is how— and you saw a chart a minute ago— how the real economic earnings number compared to what the company's telling you. You need to know because that delta tells a story worth a million words. We want to understand return on invested capital. How good a steward has this company been? With its capital. What kind of returns on capital does it earn? 2-year average free cash flow, probably the cleanest free cash flow yield measure in the world. We also exclude cash. We look at a 2-year average. We get the best measure of free cash flow every single year, and we have the best measure of enterprise value. Those are great. Smoothing that out over a 2-year period, amazing. Price to economic book value. I hear people talk about this, the shorthand version of this, all the time. They say, look, just take earnings and multiply times 10 because that's a simple assumption for 10% cost of capital. And that's the no growth value of the business. And you look at the stock price and the difference between that no growth value of the business, right? Or in other words, about a 10 PE, right? Price to economic book value is a much more sophisticated analysis that takes into account the real true core earnings of the business. We adjust that for leverage. We adjust that for— Yeah. Pensions, we adjust that for options. We adjust that for deferred compensation. We adjust that for deferred tax liabilities. So it's truly a real no-growth value. And then we look at the ratio of the price to that. And then there's the market-applied growth appreciation period, also known as the market-applied competitive advantage period. The best reverse DCF model in the world, the only one built at scale, and then the only one, of course, fed by great data. This is actually one of our most popular and most powerful metrics because it's the most forward-looking and it's based on, again, the most sophisticated reverse discounted cash flow model in the world. So should you be surprised that some of the biggest firms, the most sophisticated firms like Morgan Stanley, Goldman Sachs, Merrill Lynch, Raymond James, Two Sigma, these firms have been using our system for years, some decades? not going to give you all that same crazy data those quant folks put into their magic multifactor portfolio. We make it simple. Now, the green means good and red means bad is all based on the same data, but we're serving it up to you on a silver platter so you get one clear signal to start your research with. We're the only stock rating system in the world with a US patent. That's not bad. 20 years of optimizing AI for financial statement analysis, and we've analyzed over 250,000 Violence. This slide is worth seeing twice. We've created an auto-parsing technology to collect data based on what humans have explained over 20 years to do. We put that into a proprietary ontology. What does ontology mean? Just a system for putting meaning around the data. And then we're getting data from footnotes and MD&A analysis and employing it in a way that produces idiosyncratic alpha. In a nutshell, We use a proprietary technology to standardize complex disclosures into accurate measures of core earnings and free cash flow. These metrics are proven vital for assessing a company's true financial health. Proven, my friends. And I don't know, Kyle, did anybody have an answer to my request for another research firm that has any proof about the sort of superiority or success of their data and their research? I did not see one. Yeah, I think I've been asking that for a long time and we've not seen one. Despite the fact that there's all these tools out there, Fiscal AI and FinTool AI and Anthropic and whatever, no one's got that. You know why? They're all pushing around the same pile of dirt, the same data that the quants and Wall Street and analysts have been using for decades. We should not be surprised there's no alpha there. You got to go do something extra and special to get alpha. So let's keep it simple. Our Robo Analyst AI does two really important things for you: it gets data that the market is missing, and it does the diligence for you that no one else does to understand what that data means. This gives you an edge you cannot get anywhere else. Value Line—is that a joke? Value Line is not going to footnotes, my friend. Historic before computers equals Value Line. Yeah, it was before computers, but like, they, they were sort of like what we do. I remember people telling me when I first started with constructs, oh, aren't you like Value Line? I'm like, no, we're actually going into the footnotes. Value Line's a great summary, super simple. Used to deliver a book. But yeah, I'm not going to give you that one. So most investors and professionals don't have the time to read 200+ page 10-Ks and 10-Qs and do proper due diligence. Even if they wanted to, they don't have the time. Even if they had the incentive, which they don't, they don't even have the time. Because the process, as we heard from one of our participants today, the process is super expensive. $50,000 per company. If you're going to do this across 3,000 companies, that's millions of dollars per quarter. That's why nobody does it. It's simply easier for firms to blast out Buy, buy, buy, buy now. Now I have a few questions for you. Do you see yourself being able to use RoboAnalyst AI and our proven superior research to find excellent long-term investments for you or your clients' money? Pretty simple. Do you see why you cannot rely on the unscrubbed data that corporate America and Wall Street publish, especially during earnings season? Do you see the power of unbiased, complete information on the economic profitability and valuation of companies? If your answer is yes, I'm about to offer you something special. Our professional membership, regular price, $11,000 a year. You get ratings on 10,000+ securities. You get the screeners. You get sector ratings. All those things I showed you before. Go and click a link in the chat that we just provided. The comprehensive nature of our research entails countless pages of data and documentation, including information from balance sheets, income statements, cash flow statements, but most importantly, footnotes and dozens of other disclosures. If you've ever noticed, every single income statement, balance sheet, cash flow statement has a note like this at the bottom. It's one of the first things I noticed when I was an auditor. Going back to like 1995, I remember going through and doing this work. I'm like, huh, what's in these notes? And I went to my manager and I said, hey, I noticed something kind of funny here on this income statement. And she makes a big display out of going to her folder and pulls out this folder and it said CYA. She goes, that's for the CIA folder. That's for the CYA folder. I was 23 years old. I didn't say, I don't, what do you mean CYA? Like, why do we have to CYA? Footnotes. Here's how it looks in our system. Institutional clients would come in and click through and see these marked-up filings immediately and check them all. And you notice earnings distortion from hidden items. That's what we call items hidden in the footnotes. And you can see you get all the regular financial statements, valuation adjustments, balance sheet adjustments, all that. We want to show you how much work we do. We want to be transparent and we want you to challenge any of our competitors. To match our transparency and accuracy. There's another set example of a footnote in a filing. So here's the takeaway, folks. By understanding the true profitability and identifying the hidden risks, we can build a superior financial model for finding the best and identifying the worst stocks, period. Our stock ratings are grounded in the verifiable numbers from the filings, not speculative narratives, not AI hallucinations. Or biased analyst reports. This gives you a much more accurate picture of the company's sustainable profits and helps to discover stocks such as Mind Technology last year after we parsed its 10-K, up 32% in a month. Alibaba up 24% in a month after we parsed its 6-K. We also help you avoid stocks such as Caesarstone downgraded from neutral to unattractive, down 24% in a month after we parsed this 10-K. See what I'm saying about the window being short? We've already parsed a bunch of 10-Ks. It's coming in. It started just in the last few days. So it's— this window is not open for long. Voyager Therapeutics downgraded from neutral to very unattractive, down 22% within the next month. You got to get on this, my friends. Our professional membership provides unrivaled insights about thousands of stocks in the US market. We can answer questions better than any other AI. I've got this in the demo of FinSites. We did this with Google Cloud. We published it on their platform. We can ask questions like, what are the best stocks in the AI business? What is the most profitable energy company? Which healthcare stock has the best earnings quality? Show me companies whose stock price implies they will grow profits by 50% over the next 10 years. What are the best dividend stocks in any sector? What are the most attractive stocks in any sector? Which is the best sector? What's the worst sector? What are the most dangerous stocks? Our AI, our professional membership can answer those questions for you in seconds with integrity and superiority that's unmatched. Keeping it open, by the way, you got the whole rest of the session to give me another firm that that can match any of these claims. The difference between us and them, between all these other people and us, our data and research has proven to work. Just put all these other things I said aside. I've got proof. And as of yet, nobody in this audience and nobody that I've ever been on— talked about this on CNBC, on Fox Business, Wall Street Journal, Barron's— I say nobody can do what we can do. And trust me, I've been in meetings where people said, I want to challenge that assumption. And I, and I did this when I was working with some folks in St. Louis in a tech accelerator program. But with those guys, I went to see the top, some of the biggest firms in the world, data firms, to challenge the assumption that we had data and could do things that nobody else could do. They weren't even close. They weren't close. They haven't figured out that trying to get their analysts, their credit analysts to help the technology people collect data was a dead end. It's like asking those analysts to just go ahead and give my job away. Like, their secrets are secrets among other analysts, much less to a machine that's going to replicate it at scale. Kind of funny. That's why we're so ahead, folks. These big legacy firms making so much money for so long, they had no incentive to innovate. So they just let us come right along and disrupt them. Remember, MIT Sloan School of Business, Harvard Business School, Ernst Young, the Journal of Financial Economics. Nobody has anything like this. Also remember, producing and maintaining this level of detailed research would set you back millions of dollars every quarter. That's what our clients tell us, our institutional clients who use it, you know, across billion-dollar and trillion-dollar portfolios. This membership gives you access to a level of depth of financial research that's considered a goldmine to financial advisors and hedge fund managers. This high-level research includes Our superior unbiased ratings on 10,000 stocks, ETFs, and mutual funds. Portfolio tracking. If you put all these things in your portfolio, guess what? If anything changes, there's a new filing, a new analyst note, company gets acquired, you'll get an email first thing the next day. Every single day. If you don't want emails, you can turn them off. If you only want them weekly, you can just get them weekly. If you want it daily, you want it to go to an extra email address, we can do all that. Look, we got the best data. We're not going to make it hard for you to get it. That's why we do green is good and red means bad. And you have this portfolio tracking system that's super, super, super simple. You got a screening tool that's super simple to use. You saw me use that a second ago. In addition to all this, you get PDF reports and ratings on all these securities, portfolio tracking, daily email alerts, screening, all of our model portfolios, monthly long idea dinners. The danger zone idea reports, the long idea reports. These reports are amazing. This research—I was on Wall Street. I've seen good reports. Our stuff is really good. And not only do we give you great picks, but we'll give you our ten-page thesis on it, explaining why it's great. And we do all that because we want people to understand you deserve to know how good it is. There's also an API and Excel add-in. We are like an entire Wall Street research department that's. Covering four times as many companies and unbiased at your disposal. We go far beyond the competition with the quality of our research. You can see nobody else checks the boxes as we do, and even on here where you're checking the box, you're missing footnotes, and you're definitely missing the MDNA. You're missing the meaning of the data. XBRL's got all kinds of problems. You know, I know people who've built databases based on XBRL, and he said this taxonomy had like something like six thousand buckets. And then he's like, yeah, and then I gotta go look at the extensions every quarter when the companies come in and they change the stuff. Our automation technology does all that automatically extremely well. And by the way, when the XBRL is broken, which it often is, or the XBRL is wrong because companies make up new tags, we've got a proprietary parsing system already in place. So we take XBRL where it helps, we ignore it where it's broken, or we fix it. So with our professional membership, here's what you can do that you can't do anyplace else. Invest with confidence knowing you have access to the most accurate research and ratings available. How much is that worth? Infinite. Maximize your profits by making informed decisions based on proven superior research. Leverage a true AI. Google Cloud did it. Who knows more about AI than Google Cloud? Leverage a true AI for investing that empowers you to thrive in any market. Enjoy real due diligence and have the complete financial picture when making financial decisions for your clients. How do you say no to that? Let's do a couple case studies. This is from John, one of my favorite clients, longtime great client out there in Oklahoma City where they got some good wrestling. This guy is a genius, a true genius, was doing things before his time. And had a huge exit. And he did what a lot of folks do is they put his money with a big blue blood firm. And that's what he says, mistake. Incompetence can be wrapped in a very pretty package. When he took over his account and started using our tool, the stocks he sold off returned 5% and we did double. So I think this tells a story about your tool. I was skeptical, but results gave— given me confidence. Again, folks, Let's talk about results. No hypotheticals. So you're probably wondering, what's the price of the professional membership? Here's what it would cost for you to do it on your own. This is just from 3rd quarter last year. And this shows you day by day the work that was getting done, the number of filings that are getting parsed every single day, the number of employees it would take. And if you had to pay them $100 an hour for an 8-hour day, this is what it would cost you. $2.7 million. I think that's pretty fair math. I hope you guys are here in the chat and seeing what's going on. There's some good stuff here people are talking about, and there's some great stuff about XBRL. Thank you, guys. So imagine how much would an institutional client pay us for something like this? Look at this, $2.7 million a quarter. So $12,000 a month is a really good deal for them. Not to mention, if you got a trillion bucks, we save them from making one mistake. And that's 0.1% of their portfolio. That's— what is that, like $100 million savings? So $12,000 a month, not too bad. It's a great deal for them. That's why you see them paying us big money like that. But we're not asking you guys to do that kind of big money. That's not what this is about. We're trying to demonstrate value. You don't have to pay $10,000 or even $5,000 for a professional membership. Remember, the regular price is $999 a month. For a limited time, we're going to make a special offer today and give you a discount as part of our Great Rotation deal. So option number 1, if you decide to invest in the professional membership today, we're going to give you 1 month for free, and your 6-month price at a discount is $5,000 for 6 months. That's a savings of $1,000. Not bad. Why are we being aggressive on our pricing? Because we think you deserve to know how good our research is before you pay for the full price. So we're going to give it out there at an incredible discount because we believe that you're going to be a customer for a long time, and we want more people to understand what it is we're doing. We don't want to make this difficult for more investors to achieve. Option number 2, gold. If you invest in the professional membership today, 3 months for free over a year, that's just $9,000 for 12 months of access. That's $3,000 of savings. Not too shabby. Elite, if you want to go for 2 years, this is our best deal because you're saving $6,000. And you get the pro membership for 24 months for $18,000. 2 years. of no worries about getting tricked, misled, misinformed, and getting a screening tool that would cost hundreds of millions to replicate. And that's not all you're getting inside this pro membership. There's more to this offer. Number 1, access to the most attractive stocks. Number 2, access to the most dangerous stocks. Access to the dividend growth stocks model portfolio. The safest dividend yields model portfolio. And by the way, when we're saying safe, we're doing safe in a way that's better than anyone else because only we can analyze the cash flows in the true way, in the best way. So we know which companies can afford to pay their dividends and which can't. The executive comp aligned with ROIC model portfolio, my favorite one. This goes out and finds all the stocks that get an attractive or very attractive rating whose boards also pay The managers based on return on invested capital. The best idea I think I've ever had for a model portfolio. Each earnings season results in hundreds of rating changes and updates to our model portfolios. 5 new attractive stocks were added to the latest portfolio, 9 to the latest most dangerous stocks model portfolio, 6 to the executive comp aligned with ROIC model portfolio, 4 new to the safest dividend yields model portfolio, and 9 new to the dividend growth stocks model portfolio. All right, I got 2 more things. Focus lists, the best of the best of our ideas. This is us using our own best data and writing detailed reports. You know, a lot of our long ideas do extremely well. Only a few of those make it into the focus list. Same is true for the danger zone. Only a few of the danger zone picks make it into the short model portfolio. These extremely value, and you also get access to all the long idea and danger zone reports. So you can see the best of the best of our ideas before they go in the model portfolios. And these reports are also extremely well-written and great pieces of research. So during the great rotation in this market, we want to throw in 2 more special bonuses. Bonus number 1, we're going to give you the top ticker, our favorite ticker, our favorite stock in these top 2 sectors that we talked about. So we went through, we took a look, Kyle and I, we looked at the top stocks in the telecom sector and the consumer non-cyclicals, and we said, you know what, this is our favorite and this is our favorite. That's exclusive to this offer. Bonus number 2, the winners and losers in AI report. Now, this is going to blow your mind. Professional clients, you've already got it. Good for you. You can extend your membership if you want via the same deal. So it's open to you all as well. It's not just to existing clients, right? We're like AT&T. We take care of new clients and existing clients. But this AI report, unbelievable. We found $501 billion of hidden off-balance sheet accounting tricks. That are going to change the landscape for who's a winner and who's a loser. I'm not giving it out, but trust me, no one else is doing this. No one else is doing this. And what we're finding, there are some really clear winners and there's some really clear losers. And so all this churn you're seeing, it's going to accelerate because some people are going to get freaked out because it's not long before some of these companies are going to have to make a change to their balance sheets and how they run their business. Which is going to dramatically affect their investors. And that, I think, is going to be the next big spook, spook to the market. It's either that or they drop out of the AI race. Lastly, look, to make sure you get off to a good and successful start, I've got one more special benefit, a bonus founding members only call with me. A full 30 minutes, ask me anything. The date is set. You get to go and join. We'll send the link if you're a subscriber. Ask me anything. This is great. Listen, we're an open book at New Constructs. I do these calls a lot with clients. I do it a lot with advisors, people asking me how to get healthy exposure to AI, core earnings leaders, right? And they want to know what's true and what's not true about AI. Well, we do that in New Constructs. And so this is something we take pride in, is that we're willing to be with our clients and speak to them face to face because we know we've got the best research in the business. Now, yes, in this call I'll show you how to best take advantage of the membership and ask me whatever you want. Not only that, but you also get ongoing monthly training because we do every 3rd Tuesday, I believe, we do our Long Ideas Dinner. This is a great conversation. We just did this a couple days ago. I love it. It's really fun talking with our professional clients. We've got a lot of really smart people and a lot of really good ideas. We do some really cool stuff with the reverse DCF model. Where we challenge some assumptions. We had a really good, really discussion about a silver company that looks expensive in our system. But when you take into account the underlying dynamics going on with silver, as one of our professional members pointed out, maybe that stock is cheap. Maybe it's really cheap. So it's a really great discussion, lively discussion with a lot of really smart people, all for professional members. And we love hearing from our clients like Nancy talking about the integrity of what it is we offer. Saying that, look, he endorses New Constructs as a must-have for investing. A former business owner, knows how much work it takes to go through and get the real data and how much companies can disguise profits. And then, just super valuable. I found your analysis superior. I rarely buy something that does not have a solid rating from New Constructs. It provides me with concise investment insights that I cannot duplicate on my own. In a world where trust is going down, right? All these institutions, you know it. What do you trust out there? We're here to give you a reliable port in the storm. We believe in trust and transparency, and we back it up in the way that we deliver our research and the way our research performs. We're not talking and touting stocks that we're compensated to promote. Now here's what you get inside of your professional membership great rotation deal. 6-month access to professional membership, 6-month access to model portfolios, to the focus lists, to the long ideas and danger zone reports, API access, our bonus top 2 tickers, the losers and winners and AI report. I don't know why they put $100 on this because this thing is freaking amazing. Our founding members live-only training. You know, we had a client pay us $10,000 for 1 hour, 1 client. So the total on all this is like $28,000. You're getting it for $5,000. That's saving almost $24,000. I'd say that's a good deal. Click the link in the chat that we just provided and sign up now while the window is still open. All right, let's take some more questions and do some more demos. Kyle, who we got in terms of top stock picks? And while you're looking that up, I want to answer this question in the Q&A. How do your results compare to Altimetry by Valens? Research out of almost 6,000 companies, their A ratings are only in 42 companies and B ratings at 1,126. You know, I don't know if they published any reports about the performance. They have any live traded indices from a firm as reputable as Bloomberg to show performance. I know my performance. I don't know theirs, probably because they haven't really published it. I don't think that Harvard Business School or MIT Sloan or Ernst Young or the Journal of Financial Economics. I've written any papers on our friends at Altimetry. Great folks, cool stuff, universal accounting standards. It goes about halfway to what we're doing with respect to our roboanalyst and the footnotes. So it's for sure a move in the right direction. Does it give you the edge we have? It does not. All right, Kyle, what are we— what are you recommending here? What's our top requested stock pick? First one, CRTO. Yeah, C-R-T-O. Most attractive stocks model portfolio. Who gifted us this guy? That's pretty funny. That's a pretty good one. So somebody on this call is very generous because it looks like they've done some screening and wanted to share a pretty good-looking stock with everybody. I think we like this. Let's do a little deeper breakdown that you can do with your professional membership. Checking out accounting earnings and economic earnings, that's headed in the right direction. We love to look at shares outstanding. This is a new addition based on a client to our analysis. We love seeing what that looks like as well because we like seeing companies buy down shares, man. That's a good sign, way better than shares going up. By the way, some of those AI winner stocks secretly having to raise capital because guess what? They've been losing money but hiding it off balance sheet. And then you've got return on invested capital, return on tangible invested capital. Super cool. You can see you got 5 years of historical results here. Plus the current trailing 12 months. You get 2 different ways of looking at the drivers of return on invested capital. You can look at the margins or the operating efficiency, and then you can look at the capital turns or the capital efficiency. The free cash flow yield, you get the 1-year and 2-year average moving pretty good here. Free cash flow steady, pretty steady except for 1 year, solid. Free cash flow margin, By the way, you want to see what this looks like for the tech sector? Price-to-economic book value ratio. We love that, right? You can see this. You see the economic book value? Bam. Stock price? Bam. That's— this is a recipe for opportunity, that dichotomy there, for sure. Growth appreciation period? Less than 1 year. Typically, when your economic book value is that much higher or your no-growth value is that much higher than your stock price, you don't need any growth appreciation. time at all to justify the current stock price. All right, Kyle, what do we got next? Next one, MOH. All right, attractive, not quite as good. We'll take another cool look here that we get with the professional membership, and that's to see adjustments. So we can look at where GAAP net income comes in, and then we can see where NOPAT is, and we'll show you where the adjustments come from. Was it hidden in the footnotes? Nope, not for these guys, except for 2021 and 2023 and 2022 for that matter. But small amounts. Most of the adjustments straight from the income statement. Same is true for the balance sheet, right? We're showing— they're showing $15.6 billion in total assets where invested capital is almost half that. Just half that, right? Where's a lot of that coming out? Non-interest-bearing current liabilities. Looks like a big part of that, the biggest adjustment. And then on the valuation side, we're making adjustments as well. Big debt number here that you need to take into account. So we're always going to show you how we get to where we're going. We'll give you details on adjustments too. We'll show you how their adjustments are trending in terms of getting better or worse. And then we'll go into detail, like on the income statement, like, well, hey, these are how many adjustments we made, which was the biggest one, how many companies made more adjustments, how many are worse. Same is true on the balance sheet and for the valuation side. We want you to know how much work we're doing, hands down. All right. Well, also, you get your GAAP earnings distortion score. You get a credit rating. Super cool as well. That's amazing. Traditional versus adjusted, right, analysis, which is huge because a lot of times there's a big difference between the unscrubbed and the scrubbed numbers. And you need to know, especially if you're a fixed income analyst. Those are some of our best-paying clients over the years, fixed income analysts, because nobody's scrubbing the numbers for them. And if you're not, you might have a very different view. That's the traditional view of free cash flow. This is the adjusted view. All right, Kyle, who is the last one? The one that just came in, Boeing, BA. Yeah. Credit rating is neutral. Stock rating, unattractive. Strong miss, poor disclosure. So I think they moved a lot of— they had a lot of disclosure maybe around some of the financing parts of their business, and those went away. And so we don't like that. We don't like that. And, you know, look, this is a turnaround story. This is a great example of one of the stocks we've often talked about at a Long Ideas dinner where I'll use my institutional membership and I'll open up a model. And we will run through scenarios where they turn the business around, turnaround scenarios. And we'll say, okay, like best-case scenario for revenues, best-case scenario for margins and taxes and capital appreciation or capital utilization. And then we see what the implied values of the stock are based on that scenario. Sometimes makes the stock look cheap. Sometimes makes it look expensive. The key is we got the tools to do that kind of work. All right, everybody. Thanks so much for being with me today. I'm sorry we went over. I was really excited. We had a lot to talk about, and I look forward to seeing you at our next Long Ideas Dinner and having you on as a client very soon. Bye.
More from David




Earnings Recap: Decoding Signals from SpaceX, Palantir, Merck, AMD, Caterpillar, McDonald’s, & More

Watch Our Earnings Recap: Market Heavyweights Apple, Microsoft, Amazon, Meta, Visa, and More



Earnings Recap: Top Insights from JPMorgan, Bank of America, Taiwan Semiconductor, Netflix, and More


The IPO Melt Up: How Smart Investors Use AI to Find Abnormal Investment Opportunities