Two Ways Stock Options Detract from Shareholder Value
David Trainer explains how employee stock options reduce shareholder value through two mechanisms: option expense versus option-related liabilities. He walks through how New Constructs models these costs using Black-Scholes data and footnotes, with examples from Microsoft, Tesla, and Oracle, then shows how to adjust for them in DCF valuations.
Chapters
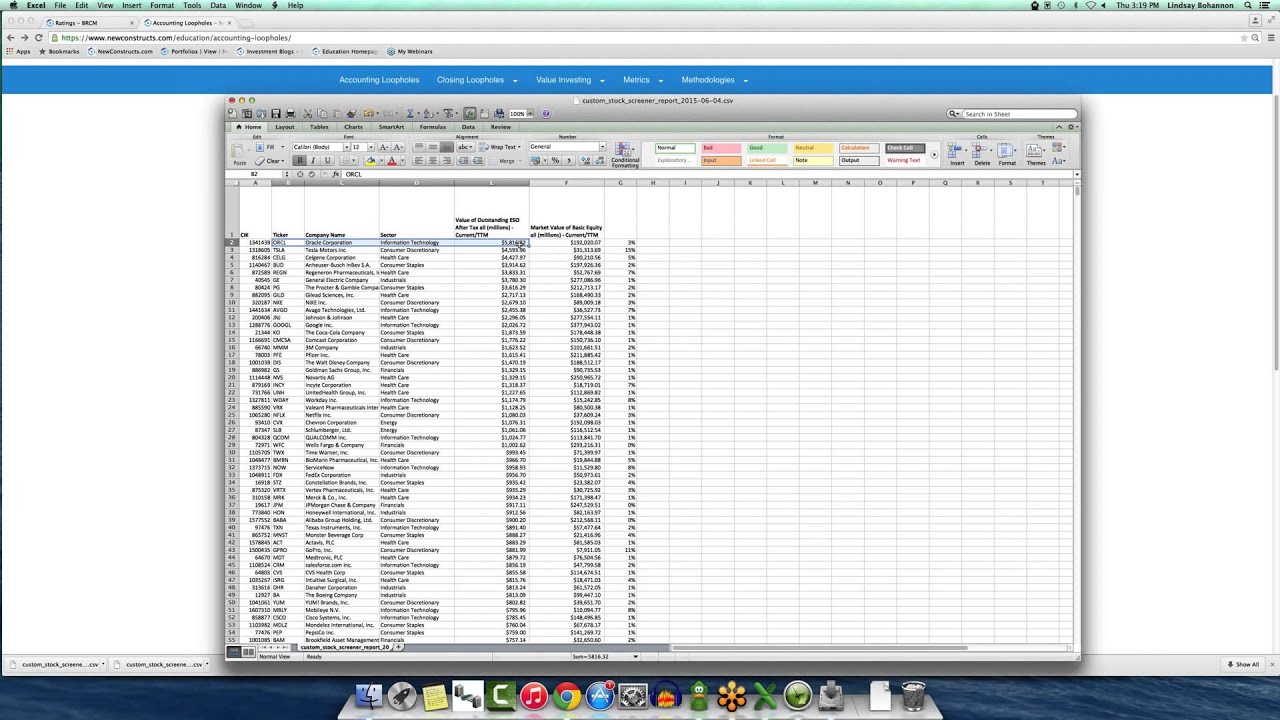
Thanks for joining me today. We are going to talk about employee stock options and how they affect profitability. People who are familiar with our site know that we've got a really rich education section, and here we talk about loopholes, and there's oftentimes Most folks don't realize that one of the adjustments you need to make for income statements is option expense. Most people know that. What they don't realize is the impact of stock option liabilities on the valuation side. So, you know, this white paper will talk to you about option expenses, and this is a chart taken from when times when companies did not have to report option expense because As some of you may or may not know, for a long time companies didn't have to report option expense at all on their income statement. And we adjusted for that. So our models are going to be consistent going back to 1998 and provide an option expense even when the accounting regulators did not, so that you have apples-to-apples performance with option expense going back over time for a company like a Microsoft or Broadcom. Right. Even before FASB required that companies report their option expense. That's not the one that I'm going to talk about today, though. The one I want to talk about today is the liability. So it's, it's one thing to understand how much options are costing you every quarter, every year, but what people tend to overlook is how much of a claim all the unexercised and outstanding options lay on future cash flows. And there's a way to build a model to talk about this. Black-Scholes model is the way you value individual options. But you can also go through and look at the footnotes and gather how many options are actually outstanding. What their sort of— the tranche value gives you a sense of what their strike price is. And you can also— they'll also provide for you in the footnotes details on how many options are outstanding, what the remaining contractual life is, right? This is a spot from the footnotes, straight from the footnotes for a particular company. This is our click-through feature. In our models where you can actually go through and see the underlying data behind adjustments, right? So the number of options outstanding, what the remaining contractual life is, the weighted average exercise price, right? That's all we care about. And with that, we build a Black-Scholes model around what the value of all these outstanding options is. And that value is a liability. It's a claim. And that's a really important adjustment that we make across all 3,000+ companies. Every rating that you see is going to incorporate that. You type in a rating for a company like Microsoft, we're taking into account the option liability. Value of outstanding options after tax, here it is under the valuation liabilities. It's gone down to zero for Microsoft, right? Microsoft is known as a company that doesn't need to hide what its performance is because its returns on capital are so good. Let's take another look at someone else. Broadcom, recently purchased for quite a bit of money here recently. What kind of option liability do they have? $430 million. Right. Not as big as it was in 2010. Still pretty big. It'd be fun if we go look in their model. Let's see what kind of option expense we've seen in the model over time. So here's the model. I've talked about this a lot. Or I've shown you our models quite a bit. And I'm going to cut to the chase here on the options side, right? So let's go to adjustments. Let's look at option expense and notice that we got it going all the way back to 1998, right? Now we don't have to make an adjustment anymore because they're reported in the financials, right? And the reason we don't break it out separately, unfortunately, is because too often— They lump equity compensation or compensation expense into one bucket. We can't distinguish what is particularly the ESO expense, and an ESO is a very particular type of accounting animal. It's effectively what they call in official accounting terms an incentive stock option, which means it is issued at the market price. So it has no intrinsic value when it's issued. Anyway, I don't want to get too geeky on you, but that's the particular type of option that was— Obsessed. are allowed to be overlooked by the accountants when it comes to being reported on the income statement. So we brought that back on. Anyway, we see historically what that's been for that expense for Broadcom. You can see in a few years here, you know, it's a huge number, $2 billion. In 2000, $646 million, right? Way bigger than earnings have in some cases ever been for the company, right? If we look at NOPAT, you know, bigger than revenue. In 2000, you know, it was way bigger than revenue, right? This is an example of if you give companies loopholes to take advantage of, they will take advantage of them. We can also look at the liability related to the options over time. That's here, the fair value of outstanding options after tax. Pretty big number, $2.6 billion in 2001 compared to a market cap of $10 billion, right? That's a pretty big chunk. And now we're looking at a much smaller liability. And look, a lot of these companies have cut way back on the option activity because, well, it's no longer a way to hide a cost, so they don't do it as much anymore. One of the key features of our system is that we have this data en masse, right? So under our dynamic data screening tool, which is an institutional quality— institutional-level tool, will allow you to look at a lot of different kinds of adjustments or data points and download them. One of them is the value of outstanding options after tax. So I like to show this because I'm going to— we're going to add this as a criteria, right? Then let's look at market value as well. Go to next. Let's look this up for— you know, you could do this for your portfolio if you wanted to, right? I could do this for all the companies in my portfolio. I'm going to do this for fun to show off our analytical horsepower here. Do it for all companies under coverage that have options, right? There's 2,900 of them, right? Or all companies under coverage right now is 2,998 total. Then I hit next. Here's the data. I hit download CSV. And now I have this data, an Excel file. Why isn't it showing up? There we go. Wait a second. Open. Sorry about that. I don't actually use this machine. This is our machine. For video presentation. So I apologize, a little bit clunky here. But here's all that data in an Excel file. The reason I chose to look at all companies is because I wanted to show you that a lot of times when you're looking at these adjustments, it's important to look at them as a percentage of something so you get a relative measure. So I'm going to look at the value of outstanding options as a percentage of market value, right? I'm going to make that a percent. I'm going to apply that all the way down. Whoops, this crazy big mouse thing's throwing me off, right? And then I can sort by column G descending. I can immediately get A nice little screen here on those companies that have the biggest option liabilities as a percent of market cap, right? Right. These aren't always the biggest numbers, but as a percent of market cap, they're big, and that's where it matters most. Sorry about that. Right, so these are some small market cap companies. And the big market cap companies, not surprised, Tesla, right? And it's a function of 2 things for Tesla. Huge amount of shares out or options outstanding, right? But then it's also the valuation's really, really high. We can scroll down the list here and look for some other big cap companies. Workday, that's a nice one. That's been in the danger zone before, right? We're talking about 8% of the market cap in options, $1.1 billion. That's a similar situation, a lot of options outstanding probably for these guys, but then also a lot, you know, an overpriced stock. I mean, we see a broken business model there too. You should check out our danger zone article on that. Regeneron Pharmaceuticals, 7%, $3.8 billion liability. Insight Corporation, $1.3 billion liability. Avago Technologies, $2.5, 7% of market cap. So this gives you a good sense of what the data point means so far and How to analyze it, how to look at it in contrast to all the other companies out there. I'm going to take a couple questions that have come in. I encourage you to go ahead and put your questions in now. I'm going to spend the rest of this webinar on questions. We've got about 15 minutes. I've got 3 or 4 already in the queue here, so I'm going to knock these out and Ask now or forever hold your peace. So how do we calculate the employee stock option costs? All right, that's, that's a great question. We went over that pretty quickly before. The best way to think about that is to go to the models page and you can look at the ESO tab and it walks you through a lot of the calculation. All right, and again, doesn't apply so much anymore because like in a lot of cases, Broadcom, they stopped granting In 2011. And the employee stock option adjustment, we had— we got— we stopped making that in 2005 because companies were reporting option expense on the income statement. Right. One of the key things I think is really good about this page right here is it can help you see how much companies are monkeying with their numbers when they do value the options on the income statement. And, you know, Broadcom's a great example here. Ladies and gentlemen, right? So let's look. Their stock price volatility assumption for their options before they had to report the option expense, way high, right? And the higher the vol— and by the way, the vol— these are the 4 of the key assumptions, that and the stock price. These are the key assumptions that drive effective value of the option when measuring the cost of options. Dividend yield, risk-free rate, vesting period, and volatility. Volatility is pretty much the only one you can play with that much. All right? Because there's not a lot of room to argue about what your dividend yield is. Not a lot of room to argue about the risk-free rate is, what is, you know, you're either using a 10 or 30 or maybe 15-year, right? Volatility. We wrote a great article that was picked up in Forbes, Fortune, Businessweek about how companies mess with this number. And we got a lot of press on this in 2005 because what we saw a lot of was that when companies started to have— started to actually report option expense, well, guess what they did? They lowered the volatility number big time, right? Big time. And interestingly, we've never seen, despite the market turmoil that we all saw in 2008, the volatility assumption never got back to even close to what it was. During these times. Now, we had some tur— we had some tumultuous markets in '99 and 2000 as well, but anyway, it's a lower number than it probably ought to be, and it stayed down that low because guess what? There's transparency now. Nothing like a little sunshine to get people to be a little more honest about their numbers. So that's how we— this, this will walk you through how we look at things. So The economic cost of annual option grants is a compensation cost, right? And then the value of all outstanding options is a liability that we deduct from shareholder value when doing our DCF. So you multiply the value of each option granted by the net number of options expected to vest, right? The value of the option is determined by the Black-Scholes assumptions down here, right? The net number of options expected to vest equals the number of options granted minus the number of options expected to be canceled between the grant and vesting dates. So we track all this information. We look at what's outstanding, granted, canceled every year. We look at a churn rate. We track that over time. And then the number of years at the end of the vesting period, we look at that— or sorry, we look at the number of options we expect at the end of the vesting period, assuming the churn rate's applied through the vesting period. So you get to the net number of options to be valued. This is the value of each option during the year. Granted during the year. So you multiply the net number of options at the end of the year times the value of the options. You have to convert them to warrants because they're actually not options, they're warrants. The difference being that warrants are for a security that has not yet been issued. Options are for securities that are already issued. Small difference, but you make that conversion. The warrant conversion rate— see, it's not a big deal here. And then here you have the annual employee stock option expense. Once you understand the value of the options, then you look at the liability or the annual value of the option expense. And you look at the number of years before each warrant vests to calculate the expected number of warrants that could be exercised. We look at the liability as well, right? So it's always important to look at the net because, look, a lot of these options that get put out there are going to be Cancel. They're not all gonna vest, right? So you need to be— you need to mark them down for that. You need to convert all the warrants into call options to arrive at the fair market value of each option. Calculate the value of each tranche of outstanding options, and then sum the value of each tranche. And that's where we get this liability number here. Good question. Are employee stock options a red flag for issues with the company? So, you know, this is a really good question because anything can be a red flag or anything doesn't have to be a red flag. I think a big part of the value-add for New Constructs is when you think about these ratings for Broadcom or Microsoft, what we're going to do is focus you on whether or not the sum total of all the adjustments we make, right? And we make a lot of adjustments, right? I mean, let's, let's go to the education section, right? We're going through all of these adjustments— income statement, balance sheet, valuation, right? Sometimes these adjustments are huge. But, you know, if you take a look at any of these white papers, we'll highlight where they're the biggest adjustments. You know, like for example, the LIFO reserve Right, for Microvision was $10 million, but it was 76% of assets, right? Huge outlier data points, right? And that's one of the kind of benefits of what we're going to do. So we, because we collect this data on everything, we can identify outliers. But the big takeaway is that we're not going to go out and cry wolf on any one adjustment or any one particular company's adjustment because we're going to know the context. We're going to know the context of the adjustment in terms of how big it is compared to its peers, right? As per my analysis here, right? So for example, if we were to sort this— if we were to sort this group of companies by the value of the option— of the liability, we could make a big deal about Oracle. $5.8 billion, but it's only 3% of the market cap, so who cares, right? Right? So it doesn't really matter that much. You know, then let's look at our rating on Oracle. Oh, it's an attractive rating. So at the end of the day, it's a huge liability, but it's not really a red flag. Because at the end of the day, given the economics of the business, given maybe all these other adjustments we make, They've still got positive economic earnings. They still have a top quintile return on invested capital. So I want to make sure you guys understand, everyone understands, we're not in the business of fearmongering. We're not in the business of bragging about how many adjustments we make. I've seen competitors do that. One of the most respected people in the field, I remember at his conference back in 1997 in London, author of a very famous book about EVA, talking bragging about making 260 adjustments. I scratched my head and I thought, good Lord, I know there's a lot of adjustments, but 260? Right? He's a consultant. He wanted to scare investors into thinking, oh, there's some adjustment out there, blah, blah, blah. That's not necessarily the case. What's important is to do this work to make sure you can trust your numbers. You want to be a value investor? You can't trust Reuters data. You can't trust Yahoo data. It's all completely adjusted. Sometimes the adjustments matter, sometimes they don't. You can trust us to be honest about both, what all the adjustments are and whether or not they matter, right? It's not just a matter of collecting the adjustments. It's having enough, enough depth in the database to know whether or not it should be a red flag. So when you open one of our models or you look at one of our ratings, right, you're getting the complete You look at something like Oracle, you look at all the value adjust— valuation adjustments for these guys. Biggest one, debt, right? And then the next biggest one, the value of outstanding options, $5.8 billion. But it really doesn't matter or doesn't really affect the business from the returns on invested capital. Yeah. It doesn't really affect the business. are as high, consistently high, as they've been in this business. Now, we were to take something like Tesla, you know, the liability is a red flag, or at least there's enough combinations of red flags for Tesla to get a dangerous rating, right? And look, when you have a -4% return on invested capital, that's going to be a big red flag. Not to say that Elon Musk is not Genius. He's brilliant. But I'm thinking that a lot of the upside is priced into this stock already. That's not to say Greater Fool Theory may last for a while. Look, I saw it when we were in the tech bubble. People bought stocks not because they thought they were good, but because they thought they were going to go up more. So it's just about waiting until you can sell it to somebody at a higher price. But it doesn't mean that the risk Isn't high, right? Too often people see stocks going up and they think risk has gotten lower. Stocks go up, risk gets higher. So look at the company model on Tesla, or we can actually scroll down quickly and look at the big adjustments we're making. And there, here's that liability, $4.6 billion, $2.7 billion in debt. So you might think they got a decent amount of debt here, but the real big liability Is in options. So yes, it's a red flag for Tesla, but not so much a red flag for Oracle. Big red flag for Tesla, not so much a red flag for Oracle. So I think it's important to keep in mind, I think the big takeaway here is, and that's why I wanted to focus on one adjustment, because a lot of times when we're going through and talking about the ratings, there's a lot of detail here. We're in And there's a lot of detail behind— hidden behind each one of these items. We've talked about each one in particular. We've talked about quality of earnings as a group and valuation as a group in prior webinars. But I think it's really important to understand that we're covering all the bases and we're doing it objectively. We're not in the business of fearmongering and trying to make a big deal about adjustments. That's why we've got white papers. That show you which companies are the biggest offenders. Largest decrease in taxes, largest increase in taxes. There it is. We explain to you exactly how it affects NOPAT in our calculation. We're about transparency and trust, not about fearmongering. So adjustments sometimes are red flags and sometimes not. Depends on their size, size of the adjustment, depends on the size relative to the economics or the financials of that business. Why do startups like to use stock options? Because they're cash poor. That's a good question, right? I mean, that's— we see it a lot in smaller companies. So if you're a small-cap guy, you know, you need to be paying special attention to options because it's not just that thing on the income statement, it's that liability related to all the outstanding and unexercised options. Right. Here's another really good question. Why do we care about both? Right? When we're looking at stock option expense— by the way, you know, Oracle's giving out their fair share of option expense, right? As a percent of revenue, got to be pretty big here, you know, in 2000. Oracle's just like everyone else. They're doing it too. Not as bad as some people. I mean, there are a lot of companies like Broadcom and VeriSign was multiples of revenue. But people say, well, you know, if they paid for the options already out of their income statement, why is there a liability? It's very important to understand that you do need both, right? Because you need to understand the option expense historically, because you need to make sure you factor that into your model when you're forecasting. So when we're forecasting, We need to make sure that whatever margin assumption we have in our DCF model or whatever valuation model we have reflects. So that's the beautiful thing here is that these margins going back in history for new constructs, they reflect option expense all the way through the whole history. Other models aren't going to give you that. Other models aren't going to give you a forecast page, period, right? These are some of the best models you're going to find in the world. Especially on 3,000 companies. But the key takeaway is here, you got apples to apples. You get history that counts and that matters, right? So you need to understand what the margins have been over time so you can forecast a better margin. And that margin is net of option expense going forward. All right? However, the margin is not net going forward of the existing liability. For the DCF. So in the same way, when you're looking at valuing the stock, you don't give companies— you don't say, well, there's no excess cash because you take out the profits they make. No, you have a liability related to the options that carries into the future because it's a claim against future cash flows. These are unexercised outstanding options that are a claim against future cash flows. In addition to the future options that you're going to be granting. You got to account for both. So you got the cost of options in the future baked into your pre-tax profit margin, and you need the liability pulled out here in the same way we add back cash, right? For those that are not familiar, this is a picture of our discounted cash flow model that is provided Inside every one of our valuation models, and you have the ability to look at multiple scenarios in these things and get a sense of how it affects valuation. This decision page allows you to compare the impact of different scenarios, see how it affects valuation. These are the— this is a chart of the values per share implied by different scenarios in the model. This is the neutral scenario in yellow, the default, the pessimistic scenario in blue. Anyway, it's a really cool way to get a quick and dirty sense of how different margins affect value, how different assumptions affect valuation. You know, I have client meetings all the time and they love this feature because I tell them, listen, we can go in, we can do— give me your worst-case scenario, give me your best-case scenario. We throw it in the system right here. We throw it in the system. Best-case scenario for Revenue growth. I'm getting off track here right now. I can't help myself. Revenue growth, pretax profit margin, your cash tax rate, your working capital, your fixed asset. These are all the things that go into producing cash flow, all on one page. And you can say, okay, well, let's just say I think margins for Oracle are going to be lower than they've ever been since 2000. So let's go— let's just put them at 30%. Okay. Right? And let's call this pessimistic. We'll save it off. We can go back and say, all right, how cheap is it? Ah, it gets a little bit more expensive. So, you know, in the default scenario, they need 6 years of profit growth. In the pessimistic scenario, they need 15 years because you got lower Margins. And notice you got a lower return on invested capital versus cost of capital spread. That's what economic earnings margin stands for, ROIC minus WACC, right? Than you do in the short period. And you know what? When your returns on capital are lower, it takes more time to grow. And now they have a 15-year market implied growth appreciation period instead of a 6-year. The point being here, it's a really tool— really awesome tool to very quickly and accurately measure the impact on valuation of different financial scenarios based on different strategic outcomes. Super powerful tool. Sorry, I can't help myself on that one. All right. A couple quick questions I'll get to quickly because we're out of time. When should the value of employee stock options be measured? Always. Quick answer. When should the expense of employee stock options be recognized? Always. This is a cost of doing business. I remember having a meeting once with an institutional investor who wanted to argue with me about this. This is the end of the broadcast, by the way. This is a great story. So this guy is the head of research for a multi-billion-dollar fund. And he tells me, I'm so sick and tired of hearing about this option expense. Look, at the end of the day, you know, you got so much cash in the cash register, and that's what I take out, and that's my cash flow. I don't care about these options. I said, okay, interesting. What if I said, I invited you to be a part of my store, and I own 100% of the equity in the business, and you're going to be an equal partner. And in exchange for that, you're going to give me a bunch of money, but I was going to still run the store, and you're going to stay at home. So in exchange for the money you gave me to run the business, I'm going to give you 50%. Every day, I take out all the money out of the cash register. What do you think that guy's going to do who gave me all that equity? Or if I gave him options for all that equity, what is he going to do if I just put all that money in my pocket and pretend like he doesn't get any, right? Options are for equity in the business. Equity is ownership in profits. If you don't account for the cost of giving away ownership appropriately, you misrepresent what the existing owners actually do own. Because if the existing owners only own a fraction of what they think they own, then they don't own all those cash flows flowing through the income statement or the NOPAT statement or the discounted cash flow. They own only a percentage of those cash flows. And we deduct the cost of giving away options and the liability related to outstanding options to provide our clients with a true measure Of the profitability of the business and the value of the business, net of the options granted, net of the ownership that's been given away, because that ownership is in cash flows and you need to net it out in order to get a sense of what you really own. Okay. Thanks very much. I appreciate the time. And we will probably skip next week because I'm going to be out of town. And we will get back in 2 weeks, and we're probably gonna cover, uh, in our next webinar, we're gonna talk about a danger zone stock. I'm gonna break down exactly how we picked a particular danger zone stock. It might even be Twitter, 'cause we got a really good article out on Twitter right now. Don't forget to take the survey. Thanks very much. Thank you.
More from David




Earnings Recap: Decoding Signals from SpaceX, Palantir, Merck, AMD, Caterpillar, McDonald’s, & More

Watch Our Earnings Recap: Market Heavyweights Apple, Microsoft, Amazon, Meta, Visa, and More



Earnings Recap: Top Insights from JPMorgan, Bank of America, Taiwan Semiconductor, Netflix, and More


The IPO Melt Up: How Smart Investors Use AI to Find Abnormal Investment Opportunities