In this video Isaac from Opsit.co demonstrates a custom AI‑driven financial‑reporting application built for a Xero‑based accounting client, designed to replace a $25,000‑per‑year legacy reporting tool. He walks through the dashboard, showing high‑level metrics (sales, P&L, gross margin, EBITDA, cash drivers, APAR, debtor/creditor days) and drill‑down capabilities such as profit‑and‑loss sub‑categories, transaction detail, and variance checks. Key functional features highlighted include data verification against source transactions, dynamic account‑mapping with visual alerts for unmapped accounts, cash‑flow summarisation, inter‑company grouping for consolidated views, on‑demand data refresh, and editable calculation layers. Isaac then addresses common practitioner questions: how clients access the dashboard (internal tool with PDF export), how to add new UI elements via AI‑powered app composers (ChatGPT desktop, Cloud Code, Replit, Lovable), the likelihood and handling of Xero/QuickBooks API changes, and the ongoing maintenance burden (roughly 10‑20 % of initial build effort). He emphasizes that AI accelerates development but does not eliminate maintenance, and that UI/UX refinements can be iterated quickly through AI prompts. The video concludes with a brief live demo of adding a PDF‑download button, a note that deployment, security, and hosting are beyond the scope, and a call‑to‑action for viewers to subscribe and comment.
Chapters
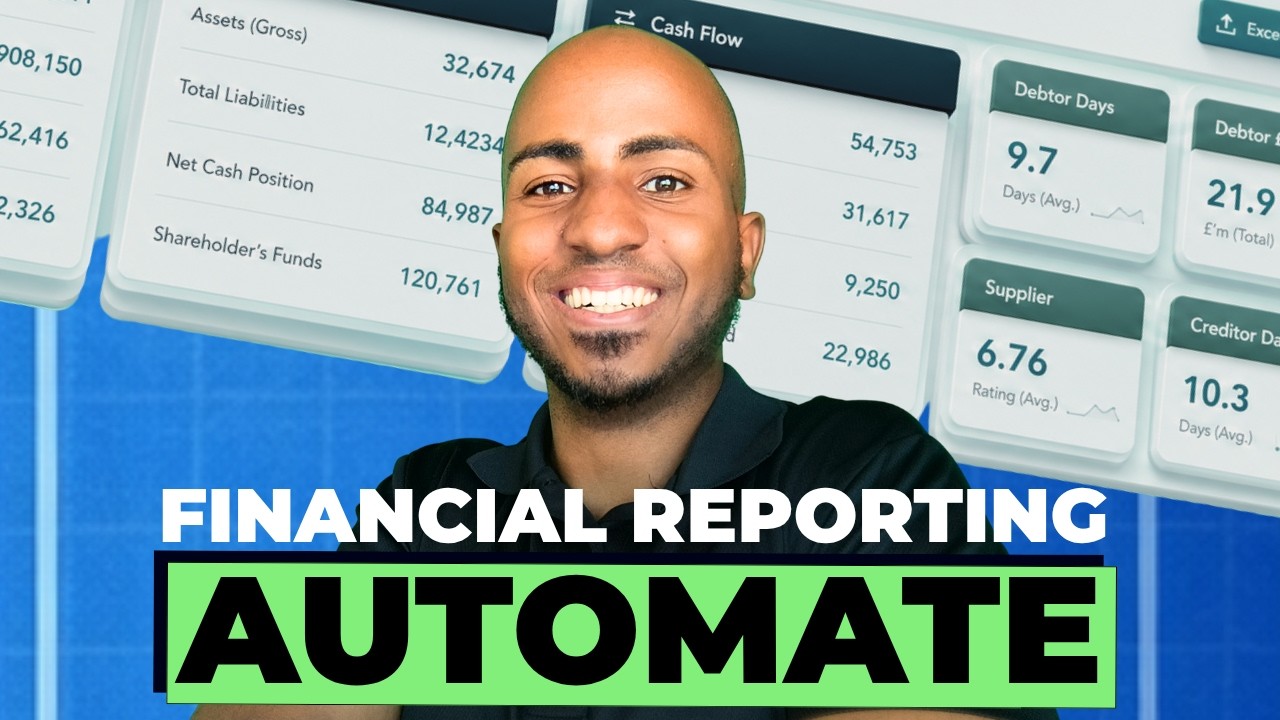
Hey, this is Isaac from Opsit.co, an agency that has helped more than 100 accounting firms incorporate AI and automation into their day-to-day workflows. And one such workflow, it's reporting. Okay, accounting are starting to automate financial reporting with AI and getting rid of sometimes expensive financial reporting tools that charge you, you know, $30 a client, $50 a client, depending on which one you choose. So in this video, I want to show you custom reporting app we built to replace a tool one of our accounting firm's clients was paying $25,000 a year for. I also want to take some time to answer some common questions that you might have, especially if this is the first time you're attempting to build an app as complex as this one. Questions like, can we verify the data? Can we control the mapping? What do we want to change the calculations, change the dates? We want an update, want to consolidate clients, or like, what if the API changes? How should I be thinking about maintenance? Like, all of those things we'll discuss at the end. as well. Let's get started with the demo. This is dummy data, but this is effectively what the app looks like on their side. This is specifically a Xero-based client, although QuickBooks has many of the same reports, so this wouldn't be possible. Let's open up the dashboard to see what the metrics actually look like. This first, a big picture report. The idea of being able to see at a high level sales and the P&L in a very brief format, right? Being able to see the percentage gross margin, the percentage across different categories, and then EBITDA and net profit at the end, being able to see cash drivers, what's driving cash up or down, and some key metrics related to like APAR, debtor days, creditor days, et cetera. We can go into the profit and loss statement. And a couple of things worth knowing here. I can expand the various buckets to see the subcategories underneath and then be able to see the actual transactions as well, as well as being able to see the variance. So this is something that sometimes comes up when clients are asking, okay, I want to build this report. How do I know it's accurate? How do I know where the data is coming from? How can I verify that it's actually aligned with reality? This is a feature our team built to be able to allow not only ourselves as we build this and develop it to ensure that the total from transactions on the P&L are actually aligned. Another thing you might have noticed is that we have this review mappings. Right? Clients might add new accounts all the time, and you want to make sure you have an ability to easily map accounts. You notice there how it highlights when I have an account that's not mapped, and then I can come here and say I want to see only up-mapped accounts. I see this new account, Project Delivery Contractors. This might be cost of goods sold. I want to save, and then I want to go back to where I was. Easy peasy. If we wanted to look at cash flow in a summarized format, to assess the net change in cash. Another question we're often asked is like, okay, I want to create groups, right? We have clients that own the restaurant, but then another business that's a rental company, and they want— they exchange money between those companies, right? Intercompany transactions. So you might want to be able to group certain companies. That's something— that's a feature that we added just as a group to be able to add, hey, these 2 companies, let's just say they are the same or they're part of the same group, a mapping exercise if any of them are not entirely mapped, and then a combined view of those entities. There are some other features more technical in nature to like get the data at any given time and refresh it, as well as being able to see the calculations underneath and edit them if needed. Some of these features the platform they were using already had. Some of these features are things that This client requested and wanted to build custom for them. So some rapid-fire questions. How will clients access a dashboard like this? Our recommendation for firms building in financial reporting apps is that you leave this as an internal tool that then you hop with the client on a call and walk them through this. Alternatively, you can simply add an option for you to be able to download any of these pages as a PDF or some other format. So then you can send it to the client. Second question, what if I wanted to add anything to this dashboard? Now, this particular demonstration was built in ChatGPT desktop application, but in whatever AI platform you're hosting apps, Cloud Code, Replit, Lovable, it'll be a function of showing the composer here and being able to ask, hey, can you add a button at the top of the big picture report that allows me to click a button To download the PDF version that I can send to the client and set it to run. Gonna be working there in the meantime while I answer some of the questions. What if the API changes? Great question. The reality is that especially with Xero and QuickBooks, so many other applications rely on them that they are not incentivized to release a breaking change of their API at all. That would be very undesirable. Then other app developers are gonna be mad. So major, major API changes are actually very rare. Maybe every 3 to 4 years, for example. And most of the time, the older versions of the API are kept functional to allow the developers to adjust from one version to the other. Now, the underlying question about asking like, what about API changes is like, what's really the maintenance cost or maintenance burden related or associated with building something like this? I like to say that AI speedups speeds up development but doesn't necessarily entirely remove maintenance because there are sometimes things that depend on other parties like QuickBooks or Xero. In our 5 years building automations, you know, it was the same thing. Like there's some effort that goes into building it in the first place and some effort that goes into maintaining it long-term. Roughly speaking, rule of thumb, we find that maybe with 10 to 20% of the effort that it took you to build it, you can maintain it. As well. So hypothetically, in the case of this client, they paid $25,000 for this app. If it took $15,000 to build it in the first place with an agency like ours, you might be looking at like $3,000 a year to maintain. Again, assuming you wanted a professional firm do that for you. The alternative is also to ask AI whenever something breaks and use that as the first. Another question, how easy it is to update it? Again, depending on the platform you're on is A prompt away. Now, as you talk about the app per se, it's really going to be as easy as you can make it. Building a tool that's easy to use is sometimes difficult, and it's been the job of like UX designers to find ways to minimize drag and make a tool that's easy to use. But in our experience, the first draft, the first version that AI comes up with, it's relatively user-friendly. If you add more and more apps, you might find at some point that that you want to tell it, hey, I'm finding this app very hard to use. I went through this workflow and had to click 7 things. Help me think about ways to make that an easier user experience. It will tell you, and then it will probably go ahead and develop it for you too. All right, so after working for probably 8 minutes or so, uh, here's what we have. I open it up on a sample browser here on Chrome, and I now am able to download this. And this is a feature that I literally didn't have 10 minutes ago. So our experience is that after the bulk of the work is done to get the data in, adding new features that are not really getting more or different data can be fairly quickly to roll out. Now, what's outside of the scope here of this conversation is how do you roll it out, deploy, secure it, host it. That could be the topic of another video, but this is becoming a reality for many, many firms. Today. And if you appreciated the walkthrough, subscribe, give us a like, leave a comment below, and I'll see you on the next one.