Dylan Patel walks through the Chip Book, a 35-page monthly PDF that tracks semiconductor fundamentals. It has 10 fixed charts on hyperscaler spending, silicon content by market, and wafer shipments, plus 25 rotating slides from 200-300 datasets when they show inflections worth watching.
Chapters
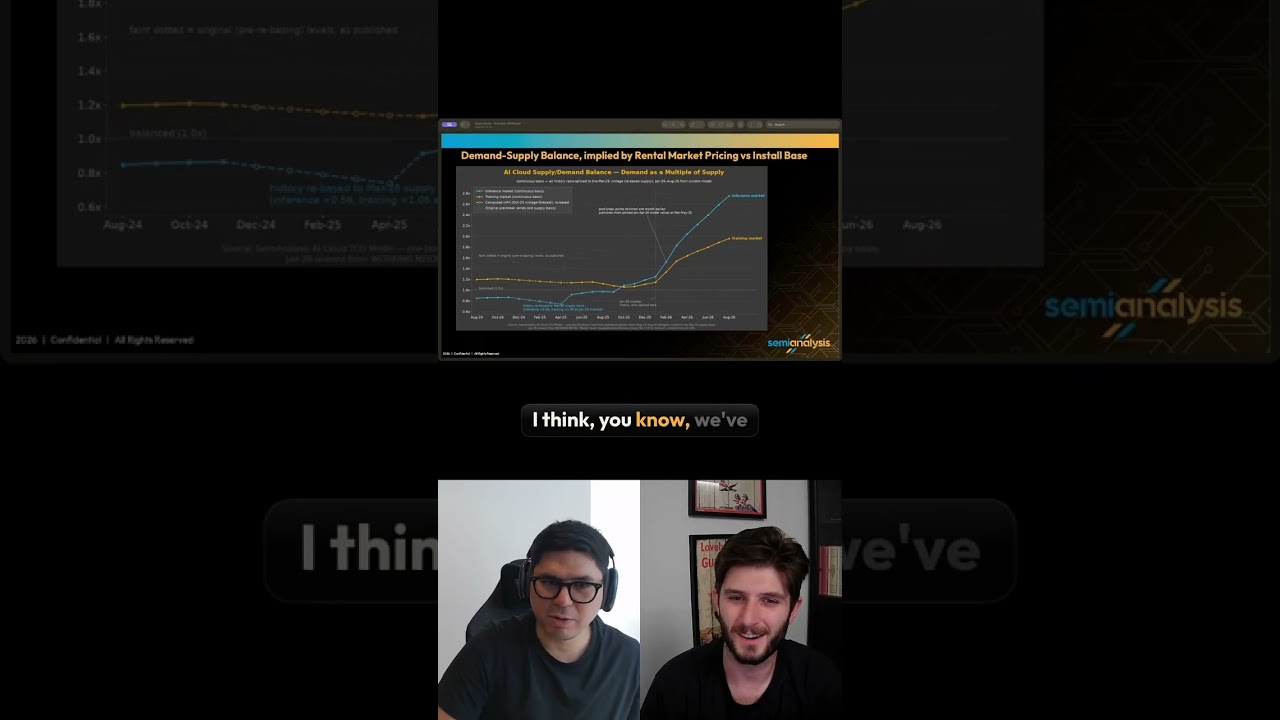
Basically, the chip book looks like this. It's basically third. I'll like make it very simple. It's basically a PDF with 35 pages of charts. The first 10 charts are the same charts every single month. It comes out on a monthly basis. The first 10 are like fundamental building blocks of the semiconductor industry. Things that every semiconductor analyst, every investor, every company needs to keep their eye on. Basic things: What are the hyperscalers spending? What do the main silicon content product shipments look like? Whether that's PCs, smartphones, auto, wafer shipments, PCBs, right? We're not just looking like end market. We're also looking very early in the supply chain, but basic semiconductor building blocks. Those are 10 slides that appear every single month. The next 25 slides rotate on a monthly basis. We track probably 200 to 300 different datasets, but not every month are those 200 datasets interesting, actionable? Are there any inflections? Sometimes they're just boring and nothing happens that month. So as opposed to sending our customers a 250-page chipbook that would just like completely overwhelm any analyst, nobody would even look at it. What we do is we say, let's identify— we don't have a specific number. It could be 15, it could be 25, whatever we think is actually interesting. We pick out another 25 or so slides and we amend those. We append— amend— append those to the first 10. So now we have 35 pages. We have the 10, and then we have the 25 that vary every month. Every single page of the Chip Book has the chart, and it has a— on the bottom, 3 things. It says, number one, what is this data? Number 2, it says, what are the stocks? Not all of them, but what public companies are connected to this data? And number 3, it gives an update every month of what we're seeing in the data. So you can scroll through the Chip Book, you could flip through it, And you could say, here are the companies that are connected. Here's what happened this month. Here's my update. That's how you read it. What we, what we now add to the Chipbook as well, which I think is a super valuable tool, is we write an executive summary at the beginning of every Chipbook. So the front page of the Chipbook is the executive summary. In the executive summary, Chaim and I tell you the 2, 3, 4, 5 most important implications of the Chipbook. We see these are the trends that we're seeing this month. These are actionable ideas. These are either investment ideas, they're ways of tracking very important components, they're ways of tracking the overall industry. And we call out in the executive summary what page in the chip book you can find that data. So we'll say, you know, this is what we're seeing in PCs, page 7, which relates to our view on China exports, page 13, which has implications for silicon content from this company. Page 15. So you could just read that one-page executive summary, and it's a very, very valuable piece of research that allows the customers to then go flip through in depth the 35 pages of the chip book. That's kind of the overview of what it looks like.