Tracking Insights that Matter with WSI’s Andreas Mueller-Schubert
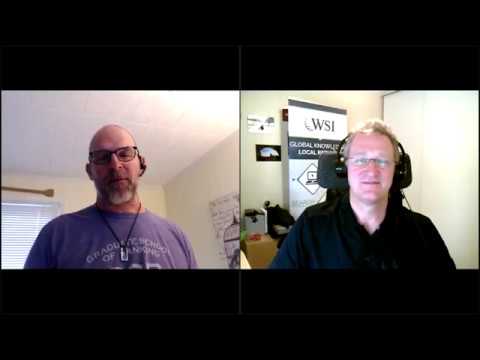
Andreas Mueller-Schubert explains how to turn digital data into action. Start with clear business goals and SMART KPIs, then use free tools like Google Analytics and Google Tag Manager to track what matters: impressions, click rates, conversions. He walks through real campaigns from wineries and restaurants showing audience segmentation and budget timing.
Chapters
Greetings everybody. Welcome to the Wednesday, May 27th. I had to check my date here. I can't believe it's almost June 2020 episode of Free Webinar Wednesdays. And you may notice we're doing something a little different today. We've got our webcams turned on, at least for the beginning, because I want to say hello to everybody. I know we've even got some customers of ours that are saying, hey, when we talk to you, we want to see your faces. We want the human touch. So we've got the webinar webcam turned on, although we may not keep them on for the whole thing, but we've got our good friend Andreas from California, a colleague of mine within the WSI network, who is the last but not least author of chapter in the WSI 3rd edition of our Digital Minds book. But we're really excited that we're wrapping up the culmination of all 13. We had 12 chapters plus a couple of weeks ago. Our president Val and our head of marketing Cheryl did the intro of the changing role of the consumer with a little bit of a COVID-19 spin on it. So it was really great to have them on. So 13 shows altogether, chock-full of great information, and we're gonna wrap up our series with Andreas talking about tracking insights that matter. Because at the end of the day, after you do all of this really cool digital stuff, you wanna make sure that you're analyzing what's actually happening. In the world of digital with analytics and codes and conversions and ROI and all the other buzzwords that go along with that. So I'm sure Andreas is gonna share a lot of that great information with us. But before we switch the presentation over to him, just wanna remind everybody that today's show and all shows are recorded and made available at freewebinarwednesdays.com. So you can hop out there and check out the show. Feel free to share it with your friends or colleagues or other folks that are at the office. And because today's show and all shows are also live, if you are attending live, of course, if you're watching this on the replay, you're not going to get the advantage. But if you are attending the show live today, please feel free to use the chat function in your control panel, which is probably in the top right-hand corner of your screen. And you can go ahead and type in a comment, question, or just an observation. And we'd love to hear from you. The last thing that I wanna do is a special shout out to my good friend Sean, a banker friend of mine. On last week's episode with Jason McCoy, when we were talking about kind of customer loyalty, we were chatting a little bit about Netflix. And I made the comment about, well, Netflix is great, it would be so awesome just to be back in a movie theater and enjoy some buttered popcorn and to sit in the comfy seat And just to have that experience, which we're all being deprived of thanks to stay-at-home orders and social distancing. He did the whole, I'm gonna go one step beyond, and he hopped on Amazon and literally ordered me a box, 6 bags of buttered theater-style popcorn that were delivered to my house last week. So I've been enjoying popcorn, and I wanna just say thank you very much, Sean, for sending that over. That was really cool of you. Not to say that anybody on the show that's watching has to pay attention to other stuff that they need to send me in the mail, but I wanted to give Sean a special shout out and say how cool it was that you thought enough to send me some popcorn. So Andreas, if you were here with me today, we'd be munching on some popcorn and we'd be having a good old time and our mouse and our keyboards would be all buttery, but you know, it's worth it. So with that, I'm gonna go ahead and make Andreas the presenter. And while I do that, just kind of briefly, Andreas and I have known each other for a number of years. His wife is actually in the business with him, as is my wife, and we had the great pleasure and tremendously fun opportunity to spend some time with the two of them. He's out in wine country, and if you know my wife, you know that wine is at the top of her favorite things. And Andreas and Georgia were just such awesome, gracious hosts, and it took us around and arranged for transportation and got us into some just amazing wineries. And I've thanked you a number of times, kind of in email and whatnot, but I want to give you a public shout out for just making that one of our probably most memorable trips. And we're looking forward to hopefully the day when we can do that, and we've already promised Ryan that we would pop over and visit him.
Yeah.
And we'd make it a little bit of a WSI world tour, if you will, and make a road trip from Michigan, maybe in the RV, and come over to wine country. So thanks again for that great time and those great memories. So welcome to Free Webinar Wednesdays. I'm glad you're here.
Thank you so much, Eric, and we will definitely do this again. And good morning everyone from beautiful wine country. It's a sunny day. It's actually going to be very hot here, but you know, it's an interesting time we are all in. I'm going to talk a little bit about this and Maybe a little background about myself, and let me show my screen. I have prepared a slide.
There we go.
Okay, so I'm gonna skip this one. I'm gonna go to this one. So my name is Andreas. I'm originally from Germany. That's probably where you hear the accent. And I was born in the '60s. I say stuck in the '80s music and living the dream in Napa, California. And what I typically do, I have a little air guitar, and when I start a webinar, I'm gonna start it with some music. And this was the last seminar on March 4th that I did for one of the local chambers. And, you know, it's, it's, it has become a little tradition. And typically I play, you know, Rolling Stones' Start Me Up for a couple of seconds, but it's always fun. So my passion is internet-driven businesses, business model innovations. And, you know, my background is in— I'm an engineer and I have studied marketing. And specifically, I realized very early in my life that I like to understand systems. I like to understand how things are related to each other. And yes, I'm the data dude. I like to understand numbers. I like to understand how things relate to each other to make some decisions on steps on things to do. I have done this my whole life, my business life. I was always in the telecommunication industry, but it was always interesting to see what's happening in the market. And over the years of my life, I have seen things growing and things going down and going through crisis and all these kind of things. And it's very important to understand what the numbers mean and what they are telling us. And this is what I want to bring to you today with a couple of examples. Maybe a little throwback, some office fun. We are all somehow stuck in the '80s. This is a team in Napa. We have an office right downtown Napa, very close to the next wine bars, and we have some fun. This was a surprise Halloween fun. You see my famous blue air guitar. So that's a green guitar. Lead guitarist is my wife. and some other team members that have joined the fun. What do I want to discuss today? I want to give us a little understanding what's happening right now with all the coronavirus things happening and how our days are changing. But I also want to define in the next step, how do we get from data to decisions? What are important steps that we have to do to get from the data that we collect to decisions. I want to talk about some helpful tools that some of them are free, some of them are more on an agency level where you have to pay for the tools. But there's definitely in our industry, definitely lots of data. I think there's nothing short of data, but what it means is very important. And I want to show you some examples of how you can start with some business assumptions in the data model, defining KPIs, and then you measure success. And at the end, I'm very open to any questions that you might have. The new reality and how long. This is a slide I used right when the stay-at-home orders came out because this changed our life overnight. No kids going to school, they're at home, they're running around, they have to be taught what they can't learn in school. You know, parents working from home sometimes, and I have 2 clients which are actually married, 2 different clients working from home. It's sometimes funny when we have conference calls with one of the business and then with the other business. It's pretty interesting. But what it means is our world changed overnight. And I was looking at the slide, you know, 30 years ago, just 30 years ago, there was no internet at home. 30 years ago, the only connections we had to the world was a phone and was the broadcast TV. That's it. Actually, 25 years ago, internet connections to the home started. So it's very short timeframe that the internet has changed our world. And I like to say thanks to the internet that this has really been— otherwise, a lot of the things working from home, like what we do right now, wouldn't be possible. There's another very interesting aspect. I was researching a little bit how long does it change, how much time does it take to change a habit or change a behavior. And there was some research done by Philip A. Lally, and on average it's about 66 days. It can change, depends on the person, the behavior, and the circumstances, can be faster, but it can also take longer. But on average, 66 days. And if you think about it, We are in a stay-at-home order, at least here in California, since mid of March. So we definitely passed the 66 days. And I think a lot of the things that people learned during this time will stick. I'll give you one example, video conferences. You know, Zooming, GoToMeetings, or Facebook Live. You know, stay connected with your family using video conferences. Or here in Napa, very popular, our virtual wine tastings. I think these things will stick. And there's already discussions that you can read, maybe not everyone has to go back to the office and remote working is actually becoming effective. We are all getting used to it. There's a lot of things that will stick and it's changing every day. Every day this will change the way how we do it. But it's very important to understand what it means from a data perspective. I want to show you one example. on the next slide, which is a Facebook advertising campaign that we did for a winery around holiday. So holiday special in December. And for the same winery, we did a shipping special in April. One thing that we always saw, there was a big peak in the morning when people get up, they jump on their phones, they look at— and this is a Facebook advertising campaign— they look at their Facebook feed, and they engage, and it is actually the highest peak. Now this peak is gone, it doesn't exist anymore. And the same at the evening. In this case, this was pretty consistent, you know, things are tapping off in the evening. Not the case anymore. Actually, one thing that we learned is we should continue the advertising beyond 10 PM. Actually, there's a lot of activities happening these days until 1 AM in the morning. So this is how you see the data, understand what the data mean, have some checkpoints, some reference points, and then make decisions. I'm going to give you a couple of more examples what really changed over the last couple of weeks. Let's build a little model, and this you can read this in the chapter in the book. Is you know you have to start with your business goals, and and the business goals can be. I want to grow my revenue, I want to grow my followership, really become clear what is my business goal, what I want to achieve. And this can be a campaign goal, this can be a general business goal. It really is important that we define what is our goal, and the more we aim for clarity, the better it is. So the more we're getting clear what success means for a campaign or the business, the better it is, and you will be able to to define what we call SMART goals. SMART means specific, measurable, attainable, relevant, and time-bound, because you want to make sure that you are able to measure what business success means. And then you establish KPIs. Let's say I want to achieve a revenue growth of 5%. I want to sell— if let's stay with the winery example— I want to sell 1,000 cases. Of wine or some— whatever it is, it's very important to establish these KPIs. And then, you know, with the right tools, you can start the data collection. Now all the different data, and I talk about the tools in a minute, are coming in, and it's very important to collect the right data. So that's important to have the right tool that provides the data, but also as data are coming in, and it typically takes a little bit of time to get a really good understanding about the relationships, what's going on, understand pattern in the data, and then adjust and fine-tune. Now you're back on the business goal level. Now you can look at the KPIs. How are they performing in relationship to my goals? A very important step. And, you know, it can actually be that you, over time, you figure, you know what, I cannot reach my business goal. I might need to go back and and redefine some of the things. So this can actually be kind of a circular pattern, but start with the business goals, establish some clear KPIs, use the right tools for data collection, understand the patterns and relationship, and then adjust and fine-tune. And I will show you some examples in a few minutes. I will give you an example about a lead generation campaign And I use this when we start with a client to ask some key questions. For example, what is the goal for your lead generation campaign starting at the business level? What is my key marketing message or special offer that I have? What am I offering to people when they see my ad, my email, and I want them to click on the special? What is it what I want people to get to catch within seconds. Question important, who's my target audience? This is very important, especially if you do advertising. You can waste a lot of money in advertising if you not understand who is my target audience. And this is true for any channel, uh, like be it Google advertising, Facebook advertising, display advertising. You really need to understand what's my target audience. And I will show you a couple of, of examples, uh, in the slide deck, uh, how you can better define what your target audience is and When you are in front of the right target audience, there's a high chance that these people are interested in your marketing message and that they click on the link. Also important, what marketing channels? And a marketing channel could be, as I said, an advertising campaign via Google, via Facebook, could be an email marketing campaign, maybe a combination of different channels to drive leads to a specific page. And this is the next question. What happens when people click on the email link or click on the advertising link? Where are they going to? And this is a very important part. We can do all the hard work and spend all the money to, to get people to the click, but then it's very important to bring them to the right page that is in relationship with the ad or with the message on an email campaign. And then very important, what do I want people to do on this landing page? Do I want them to sign up for a seminar? Do I want them to buy a product? And I want to make it as easy as possible, make it as clear as possible. We call this conversion optimization. Now we got people coming to the page and we want to see how well this page is performing from a conversion optimization perspective. Again, there's KPIs where you can measure the success of the landing page or how successful it converts. Always a good business question. What's my budget? How much am I willing to spend? And what is my ROI expectation? I can show you in a few minutes a little bit the sales funnel simulation tools that we use that you can give an indication where are we going with this campaign and how do I measure success and adjust if required. These are key questions. That at the beginning of a lead generation campaign is always very important to ask these questions to understand what is going on. Let's take a moment and look at some helpful tools. And many of these tools are actually free. Google Analytics or Google Ads, if you want to run some advertising campaign, these are free tools that Google provides to you. There's also some other Google tools that are free, but that are a little bit more complex, like Google Search Console, Google Tag Manager. These are all data-related tools, search-related tools that give us additional information. But you can also use Facebook Insights, you know, the Facebook data. There's also Facebook Ads Manager, which I will show you later in the example, that is also free, but it's a little more complicated to use. It's beyond boosting. There's also, you know, A/B testing, heat I show you some examples about this. A heat map is where you can see and understand what people are doing on a landing page or web page, and you can optimize the conversion. A/B testing is a very important way of testing your message, testing maybe an email headline, testing, you know, is my landing page performing if I have 2 versions? So A/B testing is a very important area, and I hope you get a feeling that Data and making decisions has a lot to do with assumptions when you build your business model, when you build your plan for a campaign, and then verifying it. So it's a very important step. Remember, start with your business goal, identify your KPIs, measure them, and adjust. Let's quickly introduce some of the tools that we use a lot. And Google Analytics is free. And if you haven't done this on your own website, the tip is set up the Google Analytics and start tracking. Start tracking what's happening. You might not have a specific goal in mind right now, but you can collect data from the past. And this is very important because you might want to compare website traffic and behavior of people in this month versus the previous months, or maybe versus last year, so that you can make decisions if your campaign, if your activities are showing results. What Google Analytics provides to you is who is visiting my web page, where is a visitor coming from, and where means the source. Is a person coming from Google Search, maybe from an advertising campaign? It's very important to understand if you have advertising campaigns running or specific campaigns, you want to know what's going on. And if you set up Google Analytics in the right way with goals or you have an e-commerce function, you can even track the funnel down to the completion of a purchase based on the traffic where it's coming from. You also want to know what the website visitor is doing on my web pages, on my website, and When you have set up goals or you have an e-commerce area, you see this area conversions. This is a screenshot out of Google Analytics. You can actually see how well the sales funnel is working and how my website is converting. And again, these are data, lots of data, and making decisions out of this. On the next page, I'm going to show you an example for— this is just a screenshot And not sure how deep everyone is into Google Analytics, but this is comparing— it's actually a winery that we are looking here. You know, we're comparing March versus April. Actually, in this case, the winery was able to increase the traffic during coronavirus by 58%, which is a great achievement. You can see in the pattern there are some email campaigns that were sent out that really brought a lot of traffic. To the winery. But in general, a very positive picture what was going on. We have users, which means the website business. We have new users which have not been on the website. We have sessions. Some users are coming back more than once. In this case, we had 15,778 users and we have 20,000 sessions, and the number per session is 1.3. went down slightly, but it's still that we have 1.3 users coming back more than once or coming back on average 1.3 times. Page views, and this is what we call behavior data. How many pages did all the users visit? 64,000 in this case went up pretty nicely. You know, the average 3 pages went down slightly, but still 3 pages. So this is important to understand how impactful is a change. I'm not worried about this change. You know, people spent nearly 2 minutes on the website. That's a good time. The bounce rate is high, partially driven by advertising that we were doing at this point in time. But it's in a range where I'm not too nervous about it if you understand where the traffic is coming from. And then you see where the traffic is coming from. There's some organic search. This is where Google search, a very nice, highly converting traffic. Number one, we have referral traffic, which means people are coming from a third-party website from a and click on a link. Then we have the email campaigns, direct traffic, social media. So a nice mix of traffic. What's also interesting to see is how many people are coming via mobile. In this case, is actually the majority. about 50%, and then desktop and tablet are sharing the other 50%. Desktop is 44%. In this case, we did some advertising, and this was social media advertising, drives a lot of mobile traffic. But it's important to understand today the traffic between mobile and desktop in most cases, and this is tourist industry, mobile is the number one source. So it's very important to look at the website, the landing page, How is it performing on mobile? And this can make a huge difference if a campaign is successful or not. Heatmap. A heatmap is a software that can track what users are doing on the web pages and can give indications where users are clicking. This is a menu structure. I'm not sure how well, you can see this, but you see where people are clicking on specific buttons. That's what we want to have. A heatmap can also track touches, scroll depth, how deep are people scrolling into a page. This is a very important indication to understand if I have a long web page and typically we see that not everyone goes down to the page to the bottom. It's actually the opposite. People are not really scrolling deep into pages. So it's very important to think about where do I put my call to action buttons, where do I put my purchase buttons, where do I put my information that I need to have people see when they land on a page. And it also shows some mouse movement. So these are very interesting indications how a landing page is performing. And as I said, the performance of a landing page can make a huge difference if you run an advertising campaign or you want to bring people to sign up for seminars or whatever you want to do. The page and understanding what people are doing on the page is a very important element. A/B testing. In A/B testing, you can test different messages. You know, you can test your marketing messages, you can test your ads. You know, in this case, we were testing 2 different Mother's Day ads for a winery for sparkling wine, which one was performing better. You can test landing pages. Maybe you have 2 versions of landing pages. Maybe you change the color of the call to action button a little bit and you get a higher improvement of conversion. You know, some of the things you cannot forecast, but this is where A/B testing is a really important way You can test audiences, and I will show you later how we are doing this in an advertising campaign. You can test different metropolitan cities from an advertising campaign against each other and reallocate budgets and these kind of things. And maybe a very easy example is if you send email campaigns out, just test the headline, the subject line, maybe play a little bit with the subject line and see which subject line motivates people more to open an email. Let's talk about a few of the KPIs. I mentioned some KPIs that are important, that give you some indications. In this case, I'm using paid advertising just as an example for KPIs, and I'm going to use some of the KPIs Uh, later. And one thing that's very important is impression and reach. So how many people see my ad? How many people did I reach? And there's a differentiation, especially Facebook advertising, between impressions and reach. Reach is the number of profiles, um, the ad was shown. Impressions was how many times the ad was shown. So there's a difference, and we want to understand How much coverage are we getting in our target audience? And a very important KPI is what's called cost per mille, cost per 1,000 impressions. That's what we are looking at, is how much money do we have to spend to show our ad in front of the audience and how well is our coverage. Clicks and click-through rate, very important. Now people see the ad and we want to see how many people clicked on the ad. That directly relates back to your marketing message and the way how the ad is done. And there's a huge difference in the click-through if you have animated ads with movements versus still ads. So this is a very important measurement that we use to get a feeling how well is our ad performing. Also cost per click, how much money do we have to invest for someone to click on the ad? And then finally, cost per acquisition, cost per result. So how much money do we have to invest until someone And I show you a winery example, buys the wine. On the right-hand side, you see some industry benchmarks. This is from WordStream, average click-through rate per industry on a search, Google Bing search, and on a display network. And you see in search, you have a much, much higher click-through rate, somewhere in the 3.5% to 7%, depending on the industry you are in. Search is very highly converting traffic because people already have in mind what they're searching for. So you get a quite high click-through rate, as you can see here in the 5 to 7%. And you have, if your landing page is well designed and matches to the search criteria, you have actually highly converting traffic. Again, people already have something in mind. In the display advertising arena, and I put Facebook advertising into the same category, you have less— it's a factor of 10, maybe a little bit even more, uh, lower click-through rate. Because here it is very important that you show up in front of the right audience. In search, there's an intent. People already search for something specific. In display, it's very important to be in front of the right audience, because if you're not in front of the right audience, people ignore your ad. So you really need to work hard to be in front of the right audience and define well where your ad is shown. This is also very important that you're not wasting ad money. So just to give you a feeling how you can understand and use these data and where it makes sense to adjust and to understand why is my click-through rate lower than average or lower than my expectation. Maybe there's something wrong on the audience we are targeting. Maybe there's something wrong with the ad itself. Another example is email marketing. And email marketing, a very important parameter is the opening rate. And here you got some examples per industry. Let's say 20 to 25% is average, and it heavily depends, uh, you know, if you have a more general email list or you have, you know, I give you a winery example, you have some club members, you have some maybe people that are really interested in your emails because they are industry-specific, maybe for you, for the retail clients and these kind of things. The opening rate can be much, much higher, but it really depends how your list is structured. And list segmentation is very important. Click-through rate, the same. When people open it, you want people to click on the link to eventually end up on your landing page. So it's very important. How many emails do I send? A very important measurement is a bounce rate, hard or soft bounces. That means a hard bounce is this email address doesn't exist anymore. Soft bounce typically means that the inbox is full. What's important on the bounce rate is this is also used to calculate your email sender score. And with all the scam emails, spam emails that are going around, and a lot of scam is happening right now, I'm not sure if you heard, but during coronavirus, the increase of spam emails that are phishing emails that try to click you on links and get you to bad websites increased by 600%. So the industry is really, I think over 90% in general is spam email. So it's a very important measurement. The bounce rate is how good is your email list, how good is your history, because otherwise if you're not keeping your email list up to date, your emails will end up in spam. You will not be able to pass spam filters. So Very important to watch this. Then opening rate, as I discussed, click-through rate, and again landing page performance that you could measure via Google Analytics, time on page, the conversions that are happening. So here you have the email measurement that happens in the email system combined with Google Analytics measurement that are happening on the website. And now I want to get into an example Maybe you want to fine-tune a campaign. This is an ad campaign, and I'm not sure if you're familiar with Napa Valley. Mike Gerkechil, who just celebrated his 97th birthday, he was a winemaker in 1976 who won a Paris tasting with a Chardonnay, which really brought Napa Valley and, let's say, the New World wines onto the map. And Gerkechil Estate one of our clients was running a special around his birthday. And this is where we— this is the initial setup. So we think about the geographic areas, and, you know, this is Facebook advertising. It's like the display advertising. You really want to be in front of the right audience that they— there's a high likelihood they click on the ad. So we're starting about thinking about the geographic area and how we distribute the budget. This is at the initial setup phase. And, you know, we know in Napa that we have a big concentration of very popular Napa Valley visitors from Silicon Valley, San Francisco, Sacramento. We know that West Coast cities typically perform pretty well. The likelihood that they have been in Napa and know the brand is pretty high. But we also used nationwide out of the database, we know which cities or metros are very successful specifically for wine sales and these kind of things. You can go by zip codes and all kinds of— all the target is to get as close as possible in front of the right target audience. And in this case, we used Facebook advertising. You actually have something that is called a lookalike audience where you can create an ideal profile for this winery, and you can define how the audience matches to this profile. A 1% audience match is very close, a 10% is a little bit broader. But if you know how the ideal profile of a wine lover looks like, Then you can play with these audiences and then you can measure how these audiences are performing against each other. And there's always surprises. There's no general rule. Sometimes the 1% performs better, sometimes the 10%. It's really interesting. And we can also, in this case in Facebook, interest-based targeting. You know, people that love wine, have expressed it on their profile, They're known for traveling. Maybe they are known for traveling to Napa. So these are people that are very interesting. So we can define next to the lookalike audience, we can also define interest-based targeting. And again, it's a display type of targeting. It's very important that we show the ad in front of the right people because otherwise the danger that we are spending money in front of the wrong people and wasting money is very high. This is a screenshot based on the assumptions, and you see this is out of the Facebook Ad Manager, the different audiences that we have, and you see the results. These are purchases, and you see immediately that one area— and this is actually nationwide— the 1% lookalike audience has a lot of purchases. And, you know, the cost per purchase is actually very low. You remember the cost per acquisition, which I said is a very important target. In general, we're actually performing really well here from the cost per acquisition. I always feel if we are in the $10, $15, $20, that is an okay performing, but this is a very well performing audience. And you see, for example, the nationwide 5 to 10% lookalike audience, which has the same cities, is performing well but not as well as this one. And this is how we use to reallocate budgets between the different audiences and optimize. When we set up advertising campaigns, it always has fundamentally 2 or 3 phases. It's an advertising strategy discussion based on the questions that I showed you at the beginning to really define what's the business goal and what means success. It's a setup and initial phase of a campaign where we carefully spend some money to test different scenarios. And then there is a scaling phase where we invest more money into the campaigns or audiences or ad sets that are performing very well. This is an example of a campaign that started in the March timeframe. Here you see the test phase at the beginning. And then you see the first scale, and because everything was happening very nicely, we actually decided to increase even further. And you see how many people were reached. These are profiles, 110,000. How many times was the ad shown? 199,000. So frequency is 1.8. So people have seen the ad maybe in average less than twice. This is how much money we had spent until this time. And now we can calculate some very interesting parameters. How much money are we spending per 1,000 impressions? This is a very important indicator to see, and I always look at the $10 mark in this range to see, are we performing in an area which is economic, which makes sense? If you go far beyond $10, $15, $20, this is industry-specific. I'm using this example here, but it gives us a very good indication how much money are we spending so that the ads are shown. Very important, what is the cost per click? How much money do we have to invest for someone to click on an ad? And then very important, how much money in average are we paying, are we investing for a conversion? So these are important areas. And this is, you know, these 2 impressions and cost per click shows us How well is the ad performing, in this case on Facebook? So how many people are clicking? How many— what's the click-through rate? How many, you know, errors we have? The cost per result is a very important indicator to also show us now people are coming to the landing page. How well is the landing page performing? How many people that land on this page are purchasing at the end? And that's the cost per acquisition, which is a very important area. And what is my conversion rate? A good conversion rate of the landing page is somewhere in the 5 to 10%, and that's what you can calculate and can understand. The better the landing page is designed and really in line with the ad, the higher the conversion rate will be. And it's a very important element to really think about landing page performance because You can spend a lot of money in advertising, and if the conversion, let's say, is 1% versus 10%, it's a huge difference in the return on investment. So this is one area that we're really watching very closely. Another insight which is interesting and which is a little bit unique actually here, we have— and this is audience gender, women versus men— And you see blue is the reach. So how many women or men did we reach with this campaign and how many link clicks? And I always like to see the blue and the green in balance, or ideally actually the green being bigger than the blue. And what is very interesting to see here, that in this case we're actually performing very well with the audience 55 and older. And specifically, if you look at men 65 and older, they are performing very well. So this gives us an indication we might not want to spend so much money in this age group that are younger. We might want to redirect more money into the age group that is well performing. And we see also the same here with amount spent versus link clicks. It's a different view. And There is a big difference in performance and link clicks, which eventually gives us the purchase. Again, men 65 years are very well performing here. And these are data where you see pattern, where you understand pattern, and now you can start shifting budgets around to optimize for the highest number of purchases in this case. So how did the data help us fine-tune the campaign? So we moved ad budgets into the best-performing ad sets, and the ad set was the different geographic areas, the different targeting that we are doing with lookalike audiences or with interest-based targeting. We adjusted age and gender targeting to reflect the higher engagement of 55-year- old and older males. We also changed the daily time of the ad campaign to cover more evening night hours. You remember the picture I showed you at the beginning where the, the behavior has completely changed? People are buying more and are more engaged during evening hours these days. And I give you another example where we had seen a massive change since the COVID-19 stay-at-home order happened. Email marketing campaigns. Some of you might send email marketing campaigns around, and in the past, data always suggested that Tuesdays at 11 AM is the best, the most successful time to send email campaigns. It's not Monday, it's not Friday. I think the reason is on Mondays we are going through the weekend emails and we don't have time. Tuesday, just before lunch, 11 AM, was the best successful time. Nowadays, probably at Tuesday 11 AM, with all the stay-at-home orders, home teaching is going on, cooking lunch is going on. It's probably the worst time to send an email campaign. It's probably better to send an email campaign more towards the evening where things have calmed down a little bit more. So it's These things, and this is where the data that we are getting out of the different campaigns, the opening rates at different times, is so important to understand how things are changing if the environment suddenly changes significantly like what we are all experiencing right now. In summary, define your business goal. And your business goal, whatever it is, define what you want to achieve. What you want to achieve is a lead generation campaign. What do you want to achieve with, with an email campaign? What do you want to achieve? What's important? Why am I on social media? What's my goal? Turn your goal into metrics. Smart goals. Very important that you are able to measure your goal. Define these KPIs. I gave you a couple of examples. What is industry standard and what is important for the different campaigns. Track, analyze, and ongoing optimization, adjustment, and fine-tune. I hope I could show you an example with the Facebook advertising campaign example that I showed you. There's more in the book. And chapter 12, it's about the tracking of metrics that matter. And I'm open to any questions now.
Cool. Well, next to chapter 7, yours is probably the second best chapter in the book. No, yours was awesome. We've gotten comments from folks that are attending live saying this is good stuff, this is great. So, um, big thumbs up and very, very good stuff here. So, um, I'm gonna work my way backwards. So the most recent thing that you had mentioned was regarding email send times. We just did an internal email for our office making announcement for a new program that we're launching. And that went out at like 6 o'clock and we got a 78% open rate. Now it was a small list and it was, you know, pure opt-in, but, you know, I kind of had the same thought as you is work schedules are crazy and what seemed to be the published best time that from a report back in 2019 of the best time to send an email or the best time to do anything. Those, not to say that they can be completely thrown out, but they all need to be looked at much differently in a COVID world because our worlds have changed. And like you said, we're making meals and we're teaching kids and we're, you know, jumping on webinars and, you know, everything is completely Shifted. So that was interesting that you had mentioned that because we had just experienced that ourselves and kind of was surprised that it did what it did. So, one question that we get a lot that's been posted, and I wanna pose it to you. To what extent have you ever been in a conversation with a client or even a prospect where you've shared some of this? And somebody at the senior management level said, this stuff is way too creepy, I don't want to do it, we're violating people's privacy, we're crawling into too much stuff. How do you justify or validate the fact that using this data doesn't violate privacy and really does have legitimate business purpose versus abusing it, which unfortunately is being done by some marketers and companies and giving the whole industry What are your thoughts or response on something like that?
Yeah, I think it's a very important question. And, you know, we have to be very mindful what we are using. The data that, for example, Google Analytics is tracking, it's not tracking the individual user. We see aggregated data, we see trends, we see users visit us, but we don't know exactly who that visitor is. So that's And the same is true with Facebook. I don't know what the lookalike audience at the end is, and it's the algorithm that determines where the ad is shown. But I agree, there are areas where we have to be careful. And, you know, I am from Europe, where in Germany there's a lot of data privacy going on there. And I think, you know, we have to be mindful of of how much we do, how much the tools are allowing us, and how far we're going to stretch what is possible. I think there is a growing mindset in the tool providers and the big advertising engines that privacy, and specifically with the GDPR regulations in Europe, which I think has put a completely new look onto the data, and for companies like Google or Facebook, they have to follow these rules. It's not economic for them to run regions with different software. So I think the privacy laws and implementations worldwide will get us more privacy protection. But I completely agree, and I can only highlight the bad side of it, where data and hacker attacks are happening to get into data, and phishing emails are sent around to get to your data and to sell your data to bad people. So very good question, Eric. And I think at the end, it's our responsibility to use what is in the right area of data privacy.
Right. What I usually say is we use our powers for good and not evil, because with great power comes great responsibility. I think that might be a Spider-Man reference, if I'm not mistaken. But, you know, we have to make sure and be forthcoming when we're talking to our clients about, hey, this could creep you out, but here's what we do with it. But more importantly, here's what we don't do with it. So Maria made a comment on this as well. She says it's very easy to cross the line. The data is powerful, but she should be used To give people relevant content. For example, she does not want to see ads for something that has nothing to do with her. She wants to see ads on relevant items, and the data helps make sure that that happens. And in the chapter that I wrote for the book, I talk about you know conversational marketing and chatbots, and how through Facebook the data knew that I was an avid cyclist, and it presented me with. A laser rearview tail light that I could stick on my bike. And not only did I buy it, but I bought that pretty much right then and there, all through a Messenger-based transaction. It was a paid advertisement. They had me targeted. Again, they probably, you know, they didn't know that it was Eric Cook, but the data that they were using, like what you talked about, make sure that that shows up. If they were trying to sell me baby diapers or wedding planning services, Neither one of those would have been relevant to me, but they obviously used the data to get it in front of me, and it got them $15 because I bought the light. And, you know, it happened. So good.
Sorry, Eric.
No, go ahead.
I think it's actually a really good example of what I was talking about, showing the ad in front of the right audience. And, you know, advertising, if it's not done right, it's actually interruption. I don't know about you, but I don't— if I watch a movie on TV, I don't like to be interrupted by advertising. But maybe I am interested in getting the right advertising, what I'm interested in, what I'm like you, bike riding. And, you know, getting— there's an opportunity that, that, that might be actually good because you, you learn a lot about some great products coming out, which you might never have heard before otherwise.
Yeah. Throw anything in front of me that has something to do with bicycling, mountain biking, road biking, or golden retrievers. And it's pretty much take my money. So if you can get me figured out that way, plus some gadgets and other techie stuff, you know, I'm always a sucker for gadgets. But if I can get something that ties in those 3 things, that's my profile and that's going to make me a buyer. So, um, one question that I have for you that comes up with us a lot because we work with community banks and a lot of the community banks work with third-party platforms. That will do the online application, or they'll do the actual mortgage, or they'll do the debit card purchase, but they don't have access to those sites. So when you're looking at all of your statistics and analytics and you're measuring conversions and you're, you're, you're getting those numbers, if you're using a platform that doesn't give you the ability to track what's going on once they're there, but that's where the transaction actually happens, What's the next best thing in your opinion that a business can do to help them at least track what they can to determine what is working from a metrics perspective?
Yeah, one of the things that can be done, actually Google Analytics can help you to track down to the last click on your website before you go into the third-party website. Let's say, and we use this with some of our e-commerce solutions. Where when you go to the— when you put products into your cart and then the last step, the checkout function, is actually done in a third-party system, we typically lose people there. So we can track initiate checkout. That's a goal that you can track. We cannot track in some cases down to the final purchase, but that's the last step. And if you know that you might You can make assumptions. I might gonna lose 10% of people in the area. You just have an indication. So Google Analytics is a very good way. If you use Google Tag Manager and both website systems are able to handle Google Analytics, you can actually set it up that it continues to track even on the other website. And that's what you really want to have because now you have the capability to understand Maybe my Facebook advertising traffic coming to the website, doing all the right things, and now leaving to finish a purchase. To get to that point, there are technical ways to connect the two, but it really depends what the third-party system can handle.
Yep, exactly. And then probably time for one last question. What percentage would you say of your customers are moving a vast majority, if not maybe all of their advertising to digital because they're now realizing this tracking, the metrics, the insights are available, which you don't have when a radio advertisement or a billboard or a newspaper— is it 100% digital, or what would you say that split is?
So I think Definitely the coronavirus crisis have opened a lot of people's eyes that you need to be online to be able to continue your business or to be able to stay in people's mind. So we see a lot of requests and help us, help us to get to a point where I might have a store, an e-commerce store, or help us to promote my e-commerce store that I can sell online. So, you know, restaurants are a perfect example. Restaurants— and we have a couple of restaurant clients— walk in, pick up food in the evening for dinners, and these kind of things. It's a major element of their business today. You know, things are changing. People can come back into restaurants over time, but it was the only thing they could do, and a lot of restaurants weren't even prepared. So moving things to online, making your website You know, for pickup ready, having an online ordering system, a big, big element of these days. And I think one of the things that will happen out of this COVID-19 phase is actually an even further move into digital, a much, much more move to be able to continue to do business online.
Yeah, I've kind of referred to it as the genie's out of the bottle, but From both ends of the perspective of the businesses are realizing that some things that they didn't think they could do, they're now doing, and they're doing very quickly. But at the consumer side, there's a lot of consumers that had traditionally not engaged with businesses electronically. You know, I would go to a new restaurant, I wouldn't do order out, I wouldn't do takeout, and now I'm shifting. I may decide that that's something that I'm just going to continue to do because, you know what, I kind of like being able to grab food, come back to my house, or I can get You know, delivery service. It's a lot more convenient. I've learned the app, I've played around with it. And so both ends of the spectrum. Once— and it was really interesting that you started off with that, how long does it take to form a habit? Because we're all in that habitual formation process now, where once those habits are done of working from home, using webinar and video conferencing, leveraging digital tools, getting, you know, That habit's going to be hard to break and go back. And even colleagues of ours have, you know, not renewed lease space and encouraged and empowered staff to work from home. And even the conservative banking world, they've figured out a way where if you had said this 6 months ago, you're going to need to figure out how to get your employees secure access to your customer data on your core processor from their home. They just said you're crazy. We gotta have everybody in the office. Everybody's gotta be on the network. It's a security risk. We would never think about doing that. And in short order, they learned what a VPN is, and they learned how to remote and telecommute. So, yeah, it, it is a different world. And there's, I don't think, any signs of it going back to the way that it was, which I don't necessarily think is a bad thing. It's just different. So. Cool. Well, there's lots of other stuff that I would love to bounce off of you, and we could chit-chat about this all afternoon long, but I just looked at the clock and it is top of the hour. So any other parting words of wisdom as people think about diving into metrics and insights and tracking that you'd like to leave us before we close for the day?
I think it's, it's, as I said, important is to understand what I want to achieve. What's my goal? And then breaking it down step by step. And, you know, people like us, like Eric, like myself, that's what we do— measure the data, come back with suggestions, and, you know, making things successful. And at the end, we want to achieve your business goals. That's our passion, to help people to grow.
Yeah.
And, you know, data will help us to get there. And I think— I hope I could give a few examples how to use data and to make some of the adjustments, and sometimes a small adjustment has a big impact.
Yeah, no, this, this was great. Comments are still coming in. We appreciate the info. Good stuff. Got a good checklist of things to go back and look into, so very much appreciate it. So, well, that concludes, uh, not only today's webinar but the Digital Minds book chapter guest author speaking series. So If there's any chapters that you wanna go back and relive, certainly head back out to freewebinarwednesdays.com. And, we've got 13 great episodes out there with some really good stuff. And, it's kind of appropriate. Yours was the last chapter as a culmination of making sure you're analyzing everything, and it was a nice coincidence that we were able to end the series with your session as well. So Thank you so much, Andreas, for being part of the show.
Well, thanks for having me.
Yeah. So with that, we'll look forward to seeing everybody out there on Free Webinar Wednesdays. We'll see you on the internet. Have an awesome week. Be safe and stay healthy. And, uh, I guess we'll see you online. Take care, everybody. Bye-bye.
Bye.